Transition from fishbone mode to β-induced Alfvén eigenmode on HL-2A tokamak
2021-09-10ZhihuiZOU邹志慧PingZHU朱平CharlsonKIM金智善XianquWANG王先驱andYaweiHOU侯雅巍
Zhihui ZOU (邹志慧),Ping ZHU (朱平),Charlson C KIM (金智善),Xianqu WANG (王先驱) and Yawei HOU (侯雅巍),∗
1 CAS Key Laboratory of Geospace Environment and Department of Plasma Physics and Fusion Engineering,University of Science and Technology of China,Hefei 230026,Peoples’s Republic of China
2 International Joint Research Laboratory of Magnetic Confinement Fusion and Plasma Physics,State Key Laboratory of Advanced Electromagnetic Engineering and Technology,School of Electrical and Electronic Engineering,Huazhong University of Science and Technology,Wuhan 430074,Peoples’s Republic of China
3 Department of Engineering Physics,University of Wisconsin-Madison,Madison,Wisconsin 53706,United States of America
4 SLS2 Consulting,San Diego,California 92107,United States of America
5 Institute of Fusion Science,School of Physical Science and Technology,Southwest Jiaotong University,Chengdu 610031,Peoples’s Republic of China
Abstract In the presence of energetic particles(EPs)from auxiliary heating and burning plasmas,fishbone instability and Alfvén modes can be excited and their transition can take place in certain overlapping regimes.Using the hybrid kinetic-magnetohydrodynamic model in the NIMROD code,we have identified such a transition between the fishbone instability and the β-induced Alfvén eigenmode (BAE) for the NBI heated plasmas on HL-2A.When the safety factor at magnetic axis is well below one,typical kink-fishbone transition occurs as the EP fraction increases.When q0 is raised to approaching one,the fishbone mode is replaced with BAE for sufficient amount of EPs.When q0 is slightly above one,the toroidicity-induced Alfvén eigenmode dominates at lower EP pressure,whereas BAE dominates at higher EP pressure.
Keywords: internal kink mode,fishbone mode,β-induced Alfvén eigenmode (BAE),energetic particles (EPs),HL-2A,NIMROD
1.Introduction
Energetic particles(EPs)produced from auxiliary heating and burning plasmas are known to have strong influence on the internal 1/1 kink [1–3] and Alfvén eigenmodes [4] in tokamaks.In particular,the fishbone modes have been observed widely on tokamaks,such as PDX [5],DIIID [6],JET [7],HL-2A [8],and EAST [9],in the presence of Neutral Beam Injection (NBI),Electron Cyclotron Resonant Heating(ECRH),or Ion Cyclotron Resonant Heating (ICRH),which are believed to be driven by the resonance between the trapped EPs and the internal kink modes,along with the diamagnetic dissipations from the EPs [10,11].On the other hand,various Alfvén eigenmodes(AEs)and energetic particle modes(EPMs),either in the spectral gap or on the continuum,can be excited by the EPs.Whereas the EP driven mechanisms for each of the individual MHD modes (such as AEs)and EPMs have been intensively studied [12–18],their overlapping regimes or transition conditions have been less clear.
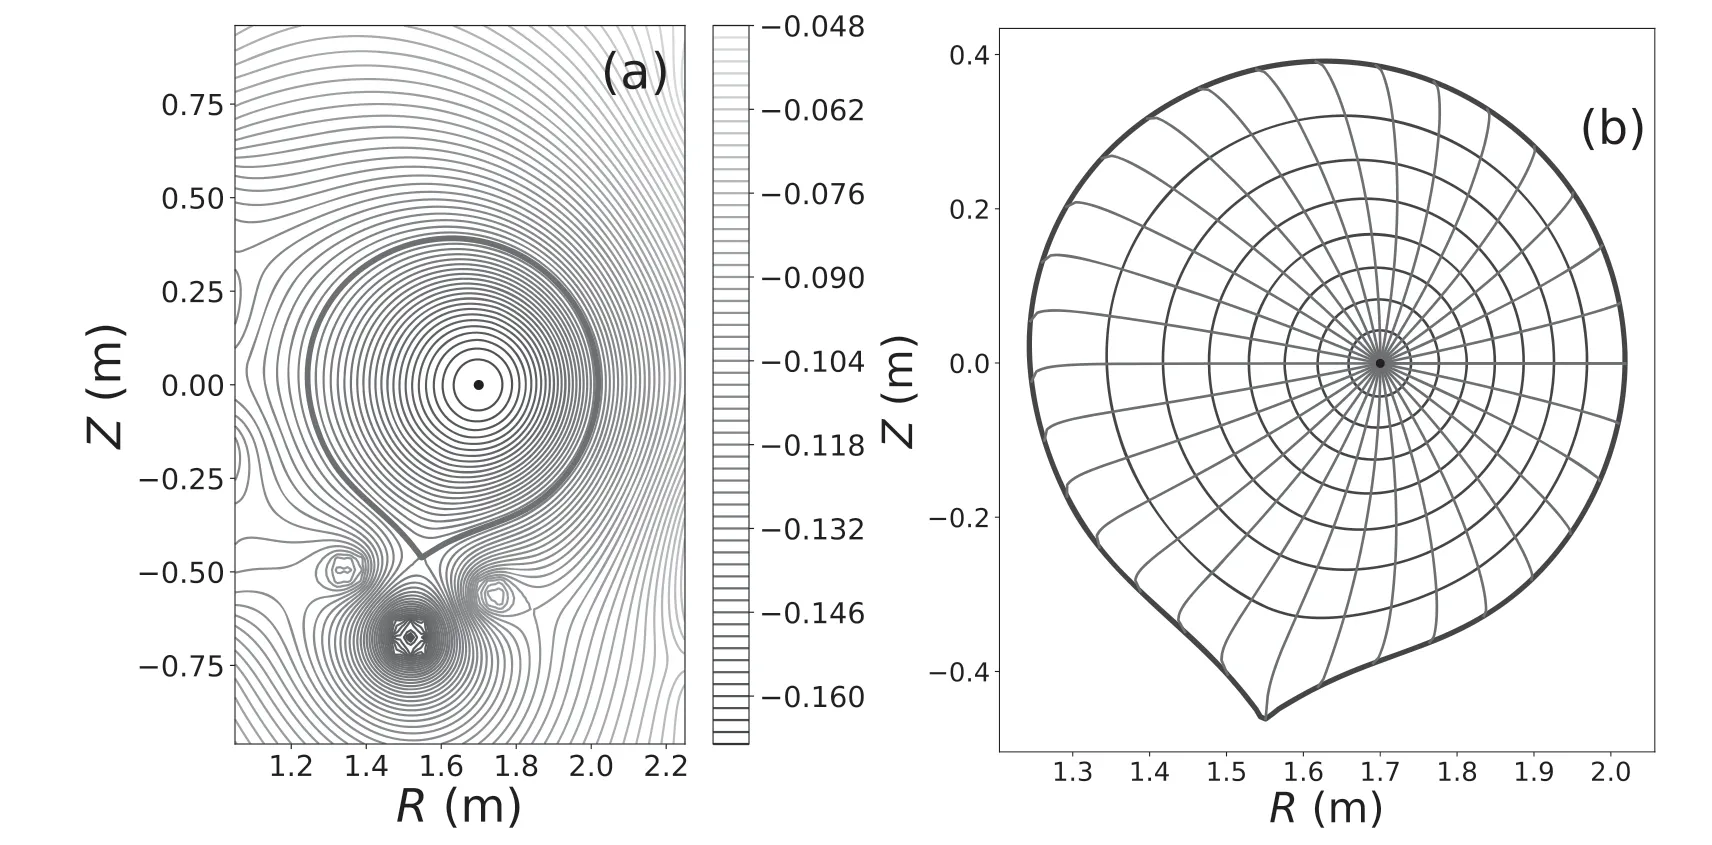
Figure 1.(a) Contour plot of equilibrium poloidal flux in (R Z,) coordinate.The red curve represents the last closed flux surface (LCFS).(b)The mesh grid of flux coordinates used in the Alfvén continuum calculation.Uniform poloidal flux and equal poloidal arc length are used in this flux coordinate system.The black point locates at the magnetic axis.The blue lines represent the constant poloidal fluxes,and the red lines the constant poloidal angles.The mesh grids used in the actual calculation are much finer than the above diagram.
HL-2A is a medium-sized tokamak where,with ECRH and NBI heatings,a number of EP driven instabilities [19],such as ion-fishbone[20],e-fishbone[21],toroidicity-induced Alfvén eigenmode (TAE) [22],and β-induced Alfvén eigenmode (BAE) [23],have been observed.In typical HL-2A plasmas with NBI heatings,the beam energyand the beam powerPNBI=1.0 MW [24].Based on the HL-2A configuration,we have recently found an overlapping regime and condition for the transition from fishbone to BAE instabilities in the presence of EPs,using the hybrid kinetic-MHD (HK-MHD) model implemented in the NIMROD code [25,26].With continuous variation of the safety factor profile and the EP β fraction,the dispersion relation and mode structure of the dominant EPdriven instability alternate between the characteristics of the fishbone and the Alfvén modes.The overlapping or adjacency for the regimes of these two distinctively different EP modes may not be always guaranteed,and our findings may help their identification and interpretation in experiments.Similar fishbone-BAE transition with increasing EP pressure has been observed in hybrid simulations using HK-MHD code M3D-K [27].
The rest of paper is organized as follows.The simulation model is reviewed briefly in section 2.The simulation set-up is described in section 3,which is followed by the report on the main results in section 4.Finally,we conclude with a summary and discussion in section 5.
2.Simulation model
The HK-MHD equations implemented in the NIMROD code including EP effects are as follows [26,28,29]
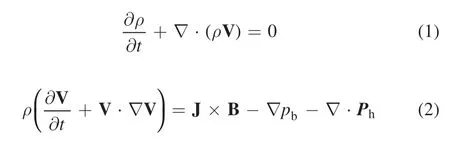
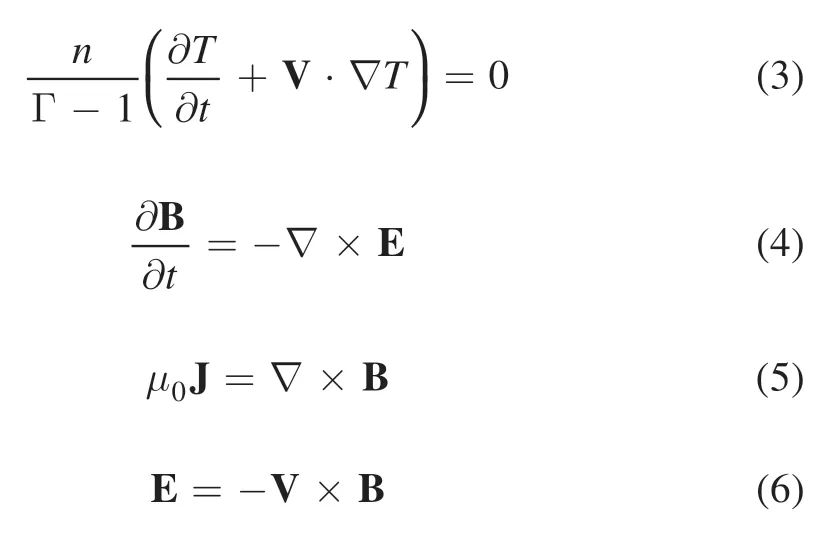
where ρ,V,J,B,pb,T,andE are the mass density,center of mass velocity,current density,magnetic field,background plasma pressure,temperature,and electric field respectively.Equilibrium used for the background plasma is assumed to be isotropic and stationary.In the limits ofnh≪nb,βh~βb,wherenb(nh)is the background plasma(EP)number density,βb(βh) is the ratio of background plasma (EP) pressure to magnetic pressure,and the kinetic effect of EP is coupled into MHD equations by adding EP pressure tensorPhto the momentum equation.The drift-kinetic equation is solved to determine the EP distribution and the pressure tensorPh[26].
3.Simulation setup
The equilibrium is constructed from HL-2A discharge#16074 using EFIT[30].The equilibrium flux surfaces and the mesh grid in magnetic flux coordinates are shown in figure 1,where the last closed flux surface(LCFS)is up-down asymmetric,and the flux surfaces are close to circles in the core region.
As can be seen in figure 2(a),theqprofile is rather flat about one in the core regionwhere ψ is the poloidal magnetic flux,andψ0is the total poloidal magnetic flux within the LCFS.The slowing-down distribution function is used for the EPs [26],
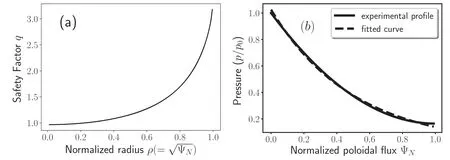
Figure 2.(a) q−profile and (b) pressure profiles in HL-2A discharge #16074.
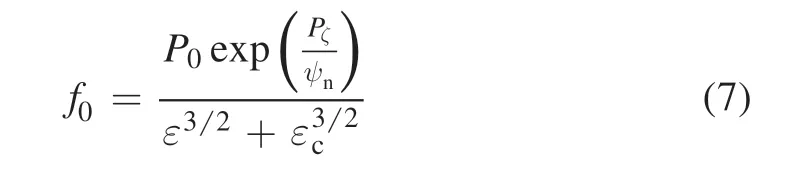
whereP0is the normalization constant,Pζ=gρ‖−ψpis the canonical toroidal momentum,g=RBφ,ρ‖=mv‖qB,ψpis the poloidal fulx,ψn=cψ0,ψ0is the total fulx and the parametercis used to match the spatial profile of the equilibrium,ε is the particle energy,andεcis the critical slowing down energy [31]
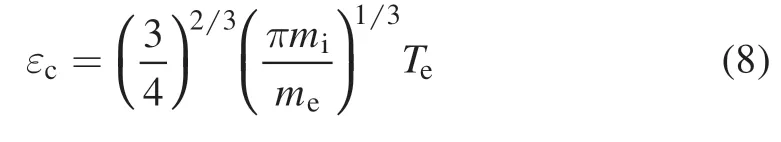
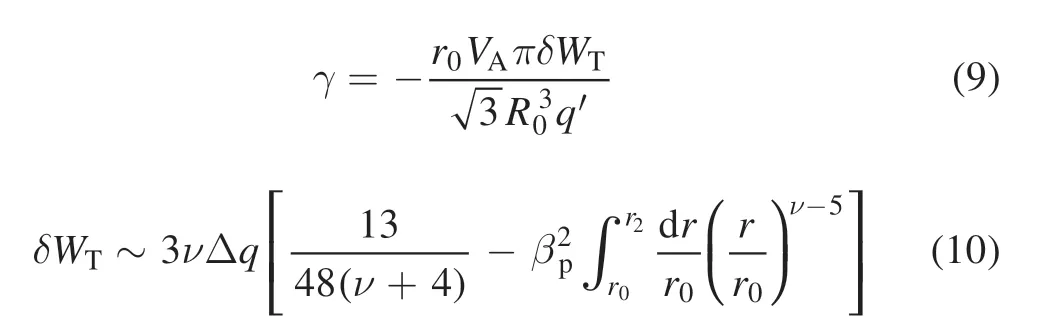
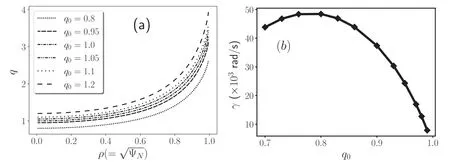
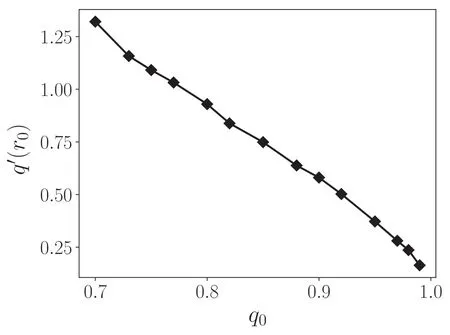
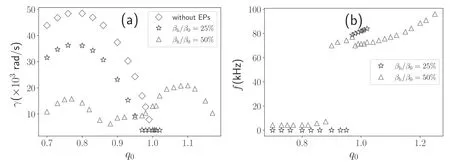
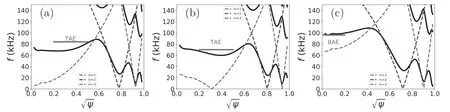
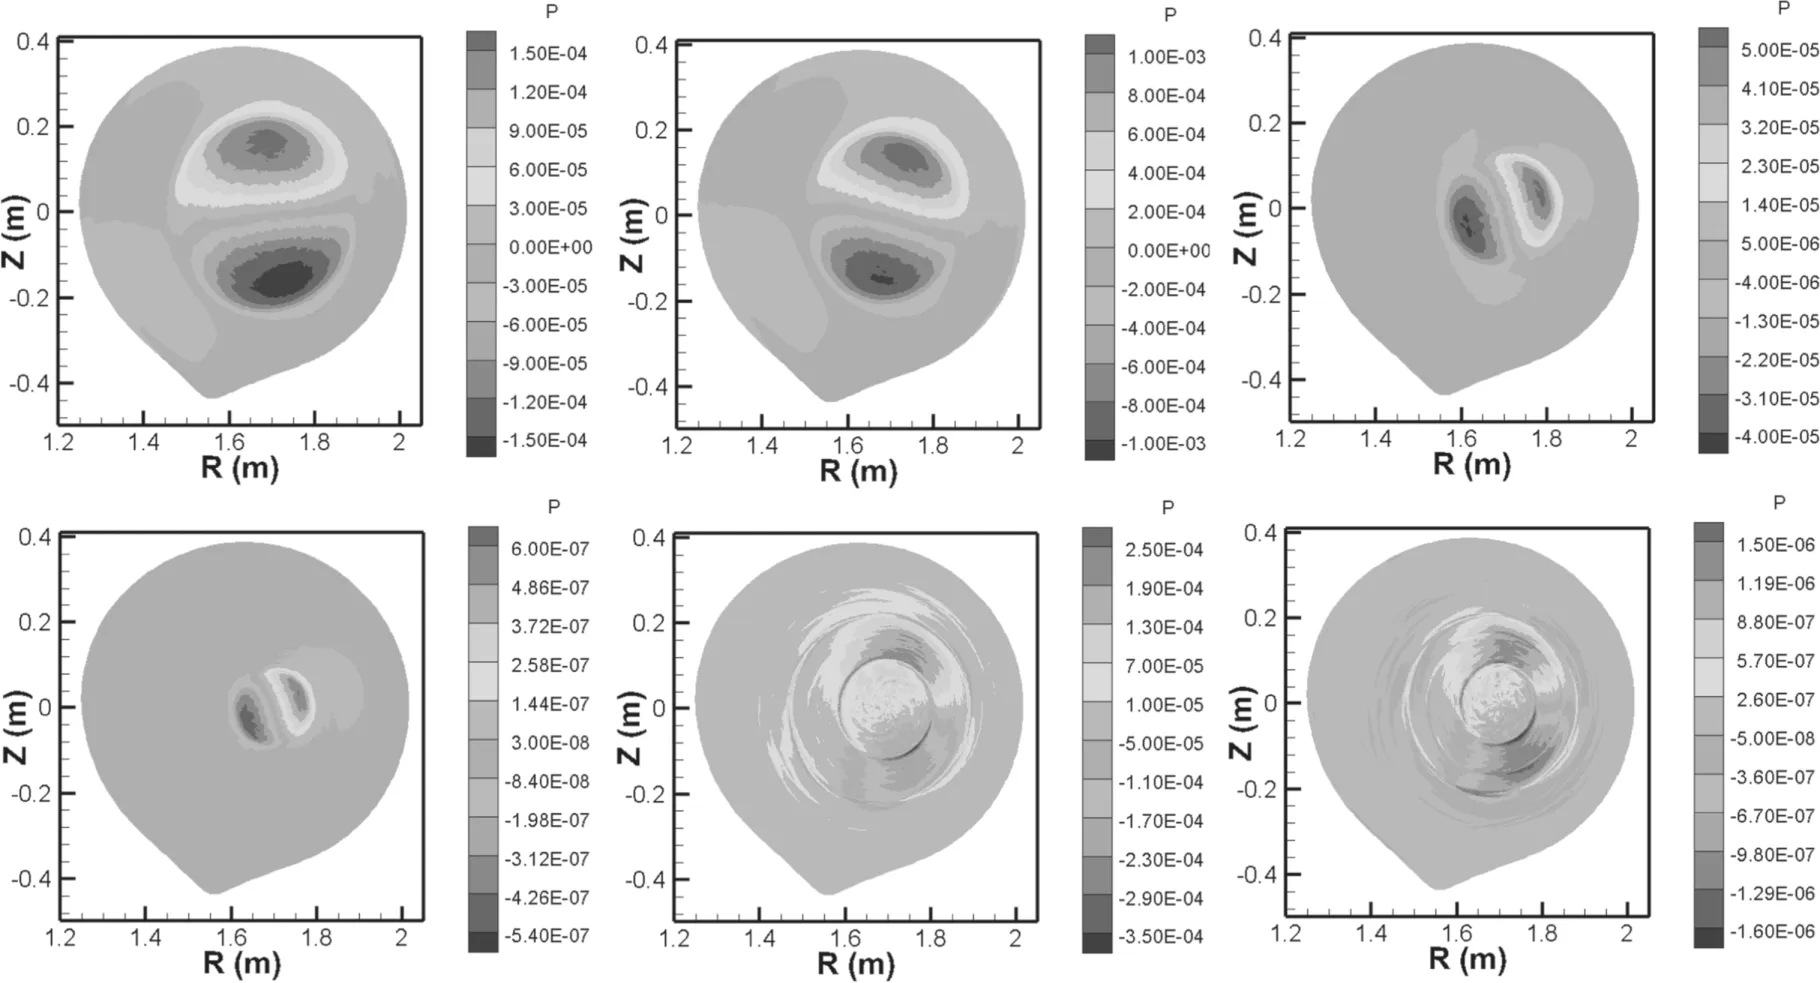
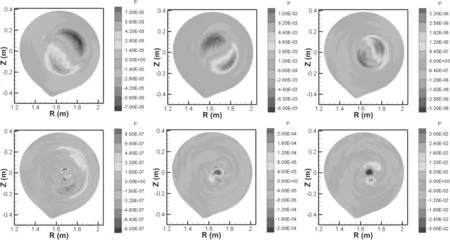
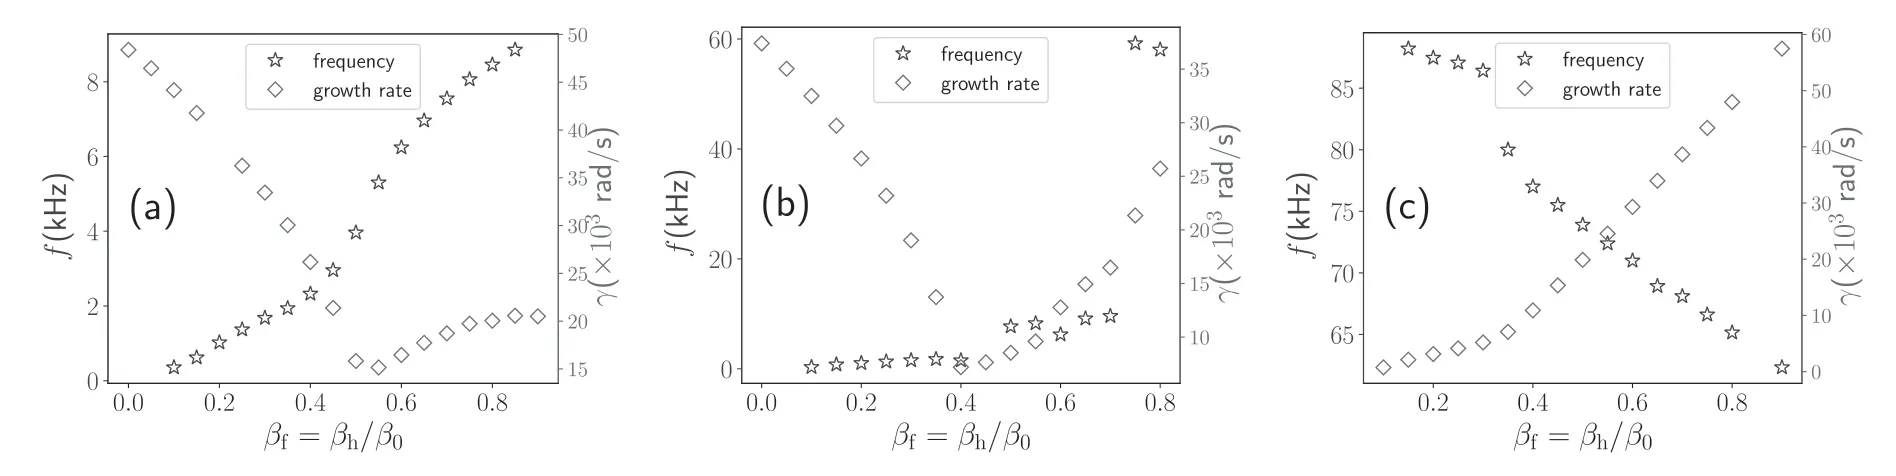
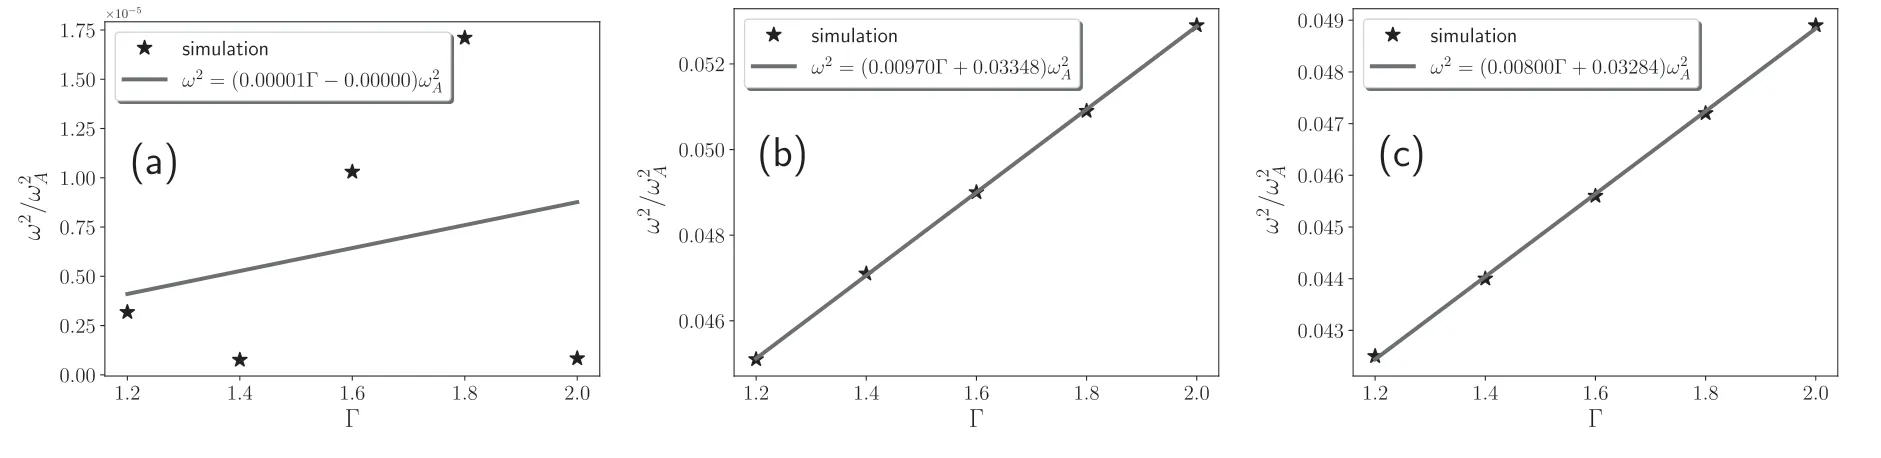
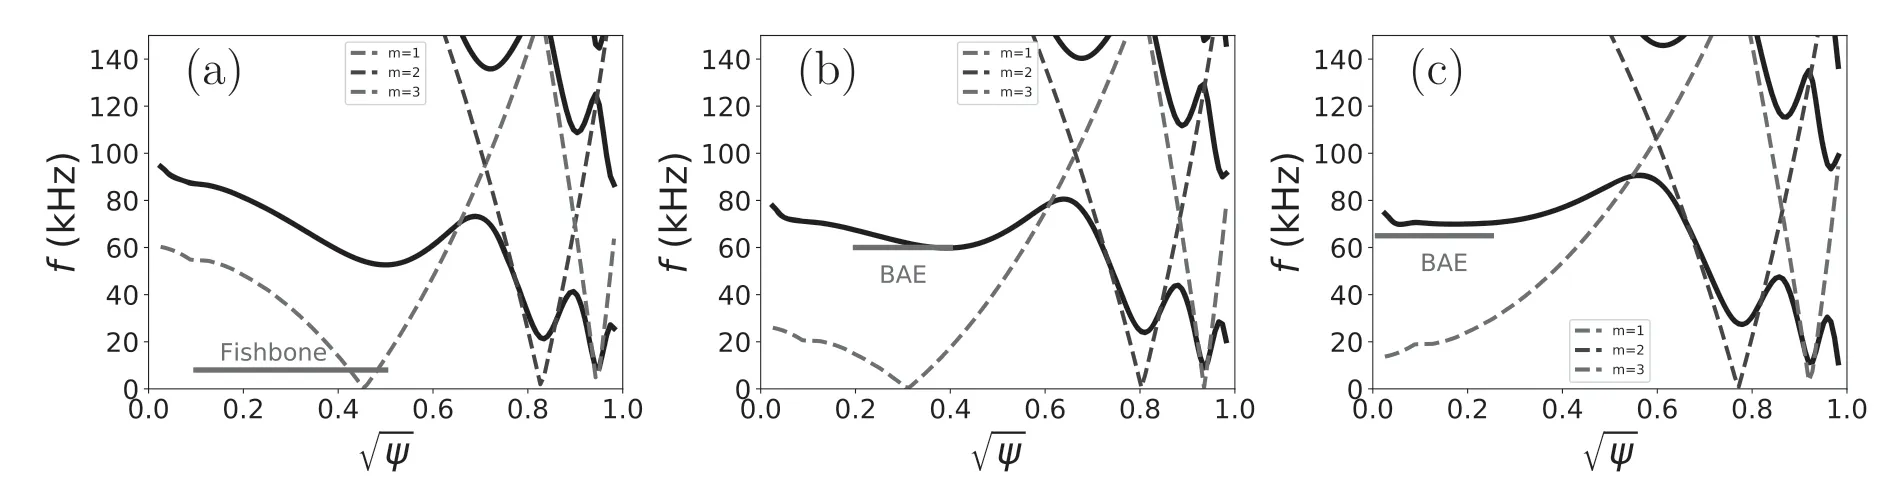
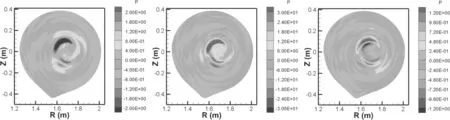
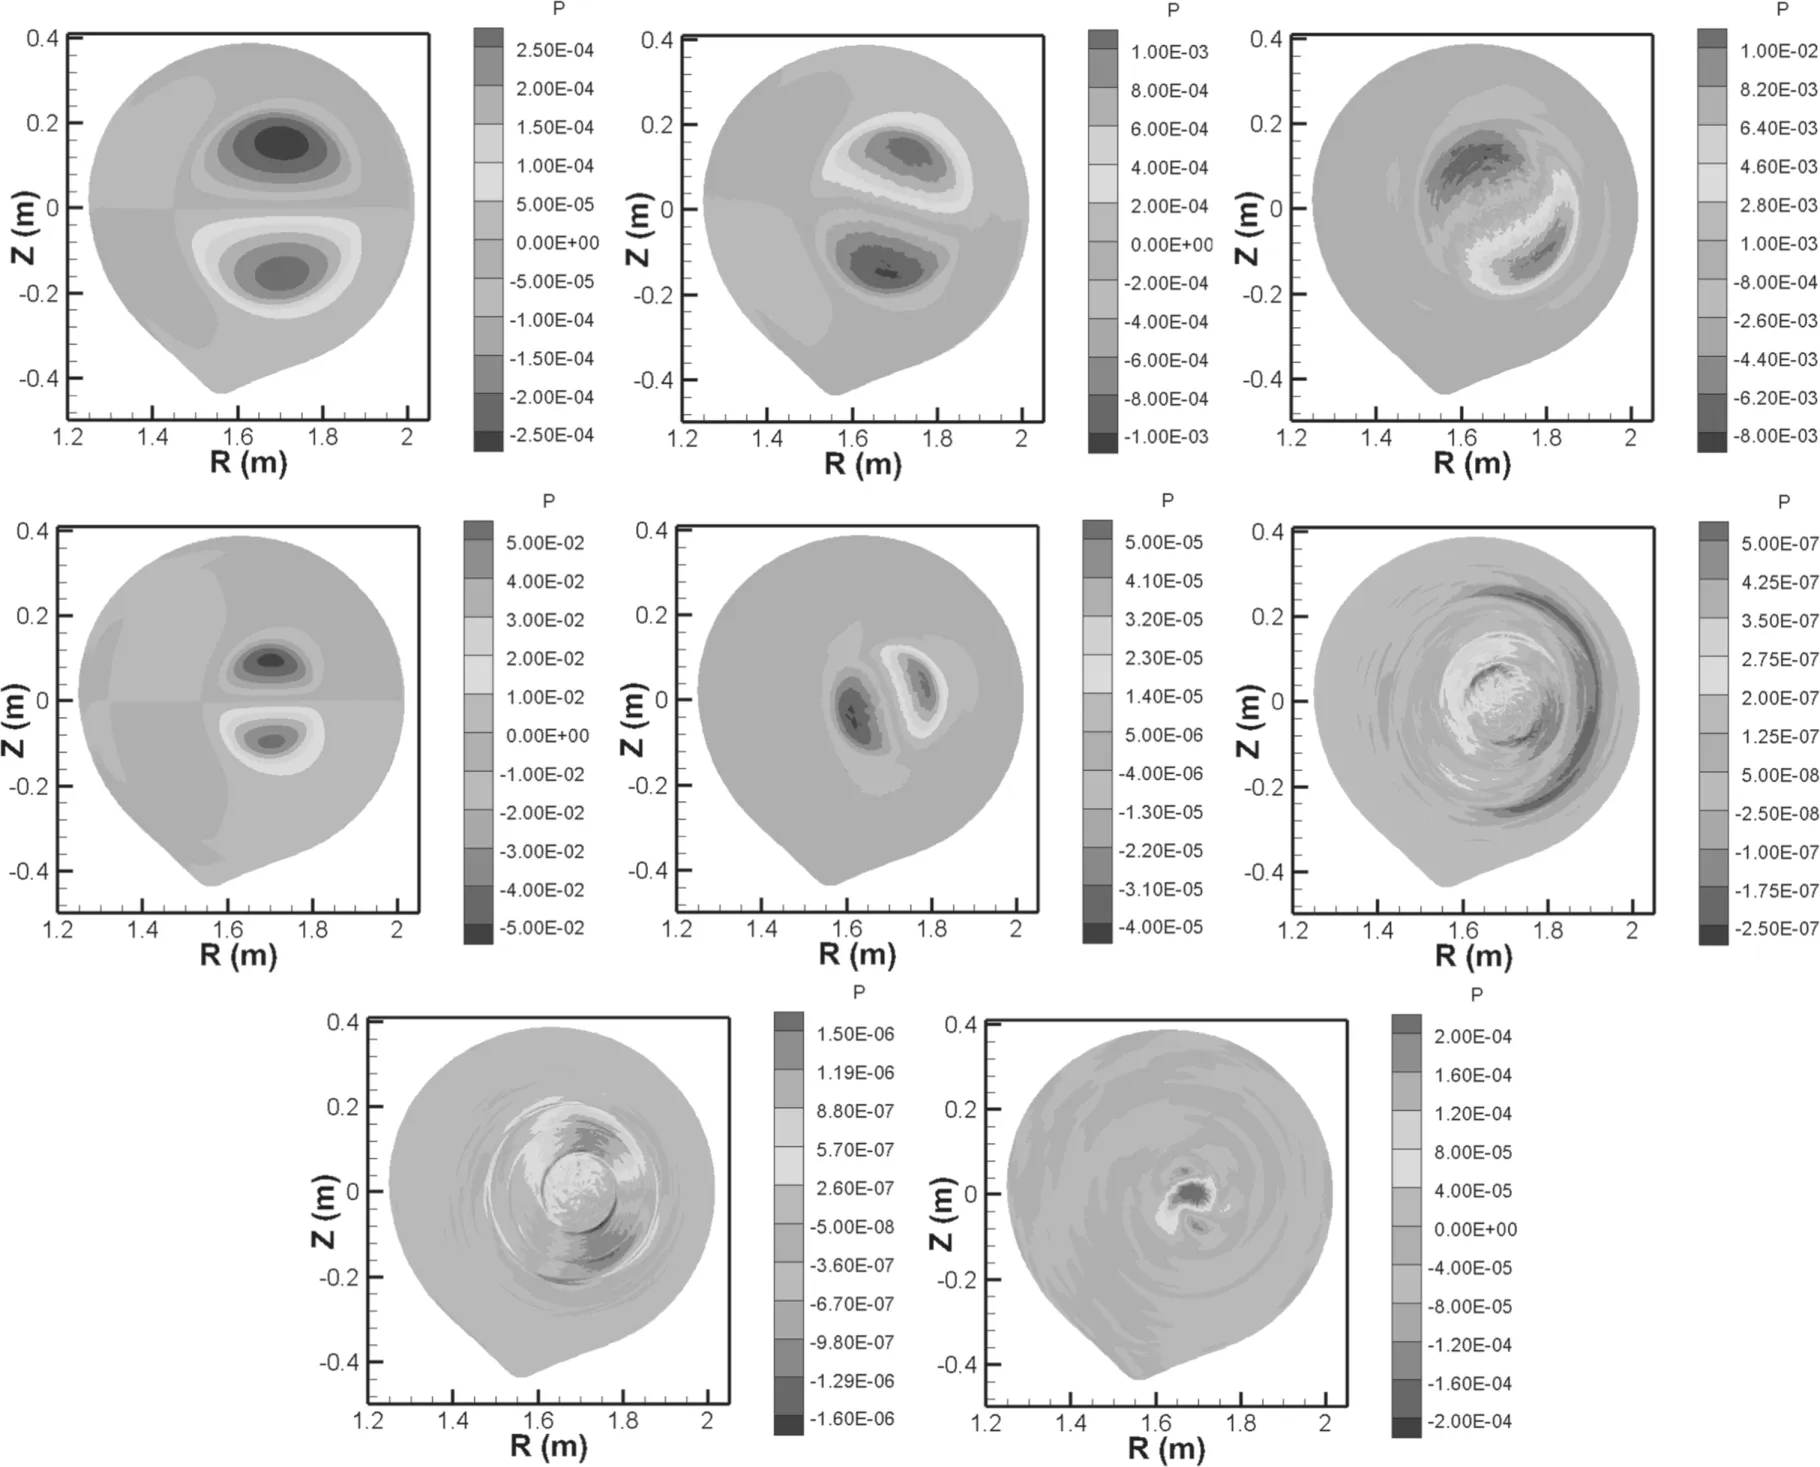
withmibeing the ion mass,methe electron mass,andTethe electron temperature.Whenε ε>c,the slowing down of beam ions is mainly due to the collisions with background electrons,and the collisions with background ions is dominant whenε ε As shown in figure 2(b),the EPs are loaded into the physical space following the profliep=p0exp(−cψ ψ0),wherep0is pressure at magnetic axis,c=0.5.Parametersp0andcare generated from the fitting to the original pressure profile from experiment.For linear simulations,resistivity η=0,toroidal mode numbern=1,and a total 106simulation particles are prescribed in the poloidal plane with 64×64 finite elements.Other main parameters are set up as follows [32].The major radius =R1.65 m,and the minor radius =a0.40 m for the LCFS,the toroidal magnetic feildB0=1.37 T,the number densityn=2.44 ×10¹⁹m−3,the initial energy of beam ions isεm= 40 keV,the background electron temperatureTe=1 keV,and according to equation (8),the critical energy isεc=14.8 keV. Figure 3.Magnetic energy evolution of (m,n)=(1,1) mode. In absence of EPs,and for the toroidal mode numbern=1,we find in linear NIMROD calculations that the(m,n)=(1,1)mode is the most unstable,wheremis the poloidal mode number.The magnetic energy evolution of the(m,n)=(1,1)mode is shown in figure 3,where the frequency and the growth rate can be evaluated from the calculation. As shown in figure 4(a),only the safety factorq0at magnetic axis is varied,so that theq-profile shifts up or down entirely without changing its shape.The linear growth rate of the (1,1) mode from NIMROD calculations increases first before decreases,and approaches 0 asq0approaches to unity.The growth rate of (1,1) modes reaches its maximum atq0=0.77 (figure 4(b)). Such a dependence of growth rate onq0may be understood from previous theory[3].For a monotonic parabolicqprofile withq0below 1,the quantity Δq=1−q0can be seen as a measure of free energy −δWTwithin theq=1 surface from equation Figure 4.(a) q-profiles with different q0 and (b) the growth rates dependence on q0 for (m,n)=(1,1) modes. Figure 5.Magnetic shear ′q r0( ) as a function of q0. where 1−q(r)~ Δq[1−(r r0)ν],q(r0)=1,q(r2)=2,VAis Alfvén velocity,R0is the major radius at magnetic axis,andis poloidal beta.It follows that the free energy −δWTdecreases withq0(q0<1).The magnetic shearq′=dqdr∣r=r0and free energy−δWTcan stabilize and destabilize the mode respectively.As can be seen from figure 5,the magnetic shearq′ decreases asq0increases.Then asq0increases,both the magnetic shearq′and the free energy −δWTdecrease.At first,the decreasing of stabilizing effect from the magnetic shearq′ is dominant,so the growth rate increases; asq0increases further,the reduction of free energy −δWTbecomes dominant,so the growth rate starts to decrease. The contour plots of the plasma pressure perturbation(figure 6) show that the (1,1) mode structure shrinks in size and becomes more localized in the core region asq0approaches to 1,which further confirms the theory prediction in equations (9) and (10). In the presence of EPs with βh/β0=25%,the growth rate of(1,1) mode increases first and then decreases asq0increases(blue star in figure 7(a)).Comparison with the cases without EPs indicates that the dependence of growth rate onq0is similar whereas the EPs have an overall stabilizing effect.The frequency is almost constant (3 kHz) whenq0<0.95,which can be identified as that of the fishbone mode.As shown in figure 7(b),forq0>0.95,the mode frequency jumps to another branch around 80 kHz and increases withq0,which is considered as a TAE from the Alfvénic continua in figure 8(a).For higher EP fraction with βh/β0=50%,the transition from the fishbone branch to the TAE branch(figure 8(b)) takes place at a lowerq0≃0.88,and the transition from the TAE branch to the BAE branch (figure 8(c))happens atq0≃0.97,and the significantly enhanced BAE growth rate reaches its maximum aroundq0=1.1 (red triangle in figure 7(a)). The dominant modes transition is also evident from the variation of mode structure withq0.For example,in the case with βh/β0=0.25,the perturbed pressure contour for then=1 mode in the poloidal plane shows clear(1,1)kink mode structure inside theq=1 surface whenq0<0.95,which shrinks in size asq0increases (fgiures 9(a)–(d)).Whenq0>0.95,the mode structure becomes qualitatively different,which now involves the coupling between two rational surfaces,which is characteristic of of the TAE mode(figures 9(e)–(f)).For βh/β0=50%,the kink mode structure is twisted whenq0<0.9(fgiures 10(a)–(c)).Asq0further increases,the kink mode structure shrinks and disappears,and the TAE/BAE appears outside theq=1 surface(figures 10(d)–(f)).The kink mode coexists with the TAE mode whenq0=0.95 (figure 10(d)),and the BAE mode dominates whenq0>1 (figures 10(e)–(f)). As shown in figure 11(a),for cases withq0=0.77,as the EP fraction βf=βh/β0increases,the growth rate decreases first before rising again,whereas the real frequency grows about linearly in both regimes where the growth rate decreases or increases.The transition between the two regimes occurs at βf=0.57.When the EP pressure is in the relatively low regime,the stabilizing effect of EP on the kink mode is dominant;in the relatively high EP pressure regime,fishbone mode can be excited.These results are consistent with previous theories [33,34] and simulations [26,35].Whenq0=0.90,the growth rate has the similar dependence on βh/β0,with a lower transitional threshold βh/β0=0.4.However,in higher βfregime,a new mode branch (which is identified as BAE later) appears where the real frequency is distinctively higher and decreases with βf(figure 11(b)).Forq0=1.05,only the new mode branch (which is identified as TAE and BAE later)persists,where the growth rate increases and the real frequency decreases with βf(figure 11(c)). Figure 6.Contour plots of pressure perturbation for different q0: (a) q0=0.80,(b) q0=0.90,and (c) q0=0.95. Figure 7.The dependencies of (a) growth rate and (b) frequency on q0 for the (1,1) modes. Figure 8.Alfvén continua with toroidal mode number n=1 calculated based on the slow-sound approximation from AWEAC Alfvén continua from the cylindrical geometry limit(dotted line)are also given.(a)βh/β0=0.25,q0=1.02;(b)βh/β0=0.5,q0=0.90; and(c)βh/β0=0.5, q0=1.25. In order to identify the nature of the higher frequency mode in figure 11,we vary the specific heat coefficient Γ of the bulk plasma,and calculate the growth rate.From figure 12 (b),we can see that,whenq0=0.9 and βh/β0=0.8,the square of mode frequency normalized by Alfvén frequency increases linearly with Γ,which is consistent with the property of BAE [27].Similarly,the BAE nature of the mode is also verified forq0=1.05 and βh/β0=0.8 (figure 12(c)).In contrast,forq0=0.77 and βh/β0=0.8,where the fishbone mode dominates,the frequency,which is near zero comparing to Alfvén frequency,is near the accumulation point of the spectrum,and is hence independent of Γ (figure 12(a)).The Alfvén continua are needed to identify the radial position and frequency of BAE.By solving the ideal MHD eigenmode equations in a torus,AWEAC (Alfvén Wave Eigen-Analysis Code) can output the Alfvén continuum for the EFIT equilibrium [36].Based on the Alfvén continua for toroidal mode numbern=1 calculated using the AWEAC code,the radial locations and frequencies of the modes withq0=0.9 andq0=1.05 are well within the BAE gap (figure 13). Figure 14 shows the variation of mode structure over different Γ withq0=0.9 and βh/β0=80%,whose dependence on Γ appears less obvious than the corresponding mode frequency.However,these mode structures are clearly AE-like,distinctively different from the internal kink.As bothq0and βfincrease from the kink dominant regime,the transition to BAE/TAE dominant regime is also apparent in the variation of mode structure(figure 15).Whenq0=0.77 (figures 15(a)–(c)),the well-defined (1,1) kink mode structure is localized inside theq=1 surface,and the mode structure is twisted as βfincreases,as shown in figure 15(c).Forq0=0.9 (figures 15(d)–(f)),besides the mode structure withinq=1 surface,there appears a new mode structure outsideq=1 surface as βfincreases,and the new mode structure is coupled with kink mode structure.As indicated in figure 13(b),the new mode structure is TAE.Whenq0=1.05(figures 15(g)–(h)),the kink mode structure can not exist becauseq0>1,and new mode structure appears as βfincreases.It is TAE when βf=25%(figure 15(g)),whereas the BAE becomes dominant when βf=50% (figure 15(h)). Figure 9.Contour plots of pressure perturbation of n=1 mode in poloidal plane with βh/β0=25% and (a) q0=0.70,(b) q0=0.77,(c) q0=0.90,(d) q0=0.95,(e) q0=1.02,and (f) q0=1.05. Figure 10.Contour plots of pressure perturbation of n=1 mode in poloidal plane with βh/β0=50% and (a) q0=0.70,(b) q0=0.77,(c) q0=0.85,(d) q0=0.95,(e) q0=1.05,and (f) q0=1.1. Figure 11.The frequency and growth rate dependence on βf=βh/β0 with (a) q0=0.77,(b) q0=0.9,and (c) q0=1.05. Figure 12.The square of normalized mode frequency as a function of the specific heat coefficient Γ for(a)q0=0.77,(b)q0=0.9,and(c)q0=1.05. Figure 13.Alfvén continua with toroidal mode number n=1 calculated based on the slow-sound approximation from AWEAC Alfvén continua from the cylindrical geometry limit (dotted line) are also given.(a) q0=0.77,(b) q0=0.9,and (c) q0=1.05. Figure 14.Contour plots of pressure perturbation of n=1 mode in poloidal plane with q0=0.9 and βh/β0=80% and (a) Γ=1.2,(b)Γ=1.6,(c) Γ=2.0. In summary,the transition of the dominantn=1 mode from fishbone to BAE instability in the HL-2A tokamak configuration has been observed to take place when both the safety factorq0at magnetic axis and the EP fraction are above certain threshold in hybrid-kinetic MHD simulations using the NIMROD code.Whenq0is well below unity,the dominant EP-driven instability is the fishbone mode; whenq0is slightly above unity,the dominant EP-driven instability becomes TAE and BAE as the EP fraction increases.The transition occurs in between these two regimes,where the mode frequency experiences abrupt jump even though the mode growth rate varies continuously,and the mode structure shows a mixture of signatures from both kinkfishbone and TAE/BAE.These findings may help the identification and control of the dominant EP-driven modes in experiments. For the HL-2A experimental equilibrium we study in this work,theqprofile is rather flat in the core region.The effects of the weak magnetic shear on the EP-driven modes remain to be better understood.With more reliable equilibria and the corresponding simulations for parameter scan,the transition boundary in(q0,βh) space can be given in the future work which could be more valuable experiments.In addition,as the EP fraction of plasma β increases,the finite orbit size of EP may no longer be ignored.We plan on further addressing these issues in future work. Figure 15.Contour plot of plasma pressure with (a) q0=0.77,βh/β0=0,(b) q0=0.77,βh/β0=0.25,(c) q0=0.77,βh/β0=0.5,(d)q0=0.9,βh/β0=0.,(e)q0=0.9,βh/β0=0.25,(f)q0=0.9,βh/β0=0.5,(g)q0=1.05,βh/β0=0.25 and(h)q0=1.05,βh/β0=0.5. Acknowledgments This work was supported by the National Magnetic Confineme nt Fusion Science Program of China (No.2019YFE03050004),National Natural Science Foundation of China(Nos.11 875 253,11 775 221,51 821 005),the Fundamental Research Funds for the Central Universities at University of Science and Technology of China (No.WK3420000004) and Huazhong University of Science and Technology(No.2019kfyXJJS193)respectively,the Collaborative Innovation Program of Hefei Science Center,CAS(No.2019HSC-CIP015),the U.S.Department of Energy (Nos.DE-FG02-86ER53218 and DE-SC0018001).This research used the computing resources from the Supercomputing Center of University of Science and Technology of China.4.Simulation results
4.1.Effects of q0 in absence of energetic particles

4.2.Effects of q0 in the presence of energetic particles
4.3.Effects of energetic particles for different q0

5.Conclusions
猜你喜欢
杂志排行
Plasma Science and Technology的其它文章
- Recent results of fusion triple product on EAST tokamak
- Suppression and mitigation of inter-ELM high-frequency Alfvén-like mode by resonant magnetic perturbation in EAST
- Simulations of NBI fast ion loss in the presence of toroidal field ripple on EAST
- Reconstructions of velocity distributions from fast-ion D-alpha (FIDA) measurements on EAST
- Tomography of emissivity for Doppler coherence imaging spectroscopy diagnostic in HL-2A
- Comparison of natural grassy ELM behavior in favorable/unfavorable Bt in EAST