Tensile strength of sea ice using splitting tests based on the digital image correlation method
2021-08-19CHENXiaodongHEShuaikangHEWenquanWANGZhaoyuJIShunying
CHEN Xiaodong, HE Shuaikang, HE Wenquan, WANG Zhaoyu &JI Shunying*
1 State Key Laboratory of Structure Analysis of Industrial Equipment, Dalian University of Technology, Dalian 116023,China;
2 DUT-BSU Joint Institute, Dalian University of Technology, Dalian 116023, China;
3 Marine Environmental Forecasting Station of Yingkou, Yingkou 115007, China;
4 Marine Monitoring and Early Warning Center of Liaoning, Shenyang 110001, China
Abstract The splitting test is a competitive alternative method to study the tensile strength of sea ice owing to its suitability for sampling. However, the approach was questioned to the neglect of local plastic deformation during the tests. In this study,splitting tests were performed on sea ice, with 32 samples subjected to the regular procedure and 8 samples subjected to the digital image correlation method. The salinity, density, and temperature were measured to determine the total porosity. With the advantage of the digital image correlation method, the full-field deformation of the ice samples could be determined. In the loading direction, the samples mainly deformed at the ice-platen contact area. In the direction vertical to the loading,deformation appears along the central line where the splitting crack occurs. Based on the distribution of the sample deformation,a modified solution was derived to calculate the tensile strength with the maximum load. Based on the modified solution, the tensile strength was further calculated together with the splitting test results. The results show that the tensile strength has a negative correlation with the total porosity, which agrees with previous studies based on uniaxial tension tests.
Keywords tensile strength, splitting test, digital image correlation method, ice mechanics, sea ice
1 Introduction
Sea ice is a common issue impacting human activities at high latitudes. Because the Baltic and Bohai seas are regularly hit by cold air during the winter, both China and Finland have a long history of dealing with seasonal sea ice(Leppäranta et al., 1995; Li et al., 2011). Extensive collaborations exist between Chinese and Finnish researchers concerning the design of ice-resistant structures(Qu et al., 2006).
In interactions with ships and inclined offshore structures, ice commonly fails when bending. Therefore, the tensile strength of ice is important in the design of the structural capacity of such structures. To determine the tensile strength via uniaxial tension tests, a sample needs to be dumbbell-shaped to avoid damage to the ice-platen connection (Cole et al., 1985; Lee, 1986; Menge et al.,1993). However, direct methods are time consuming and unsuitable forin-situ
experiments (Mohamed and Farzaneh,2011).To measure the tensile strength of brittle materials,indirect methods, such as simple beam tests, cantilever beam tests, ring-tensile tests, and splitting tests, have been developed (Wang et al., 2004; Timco and Weeks, 2010; Aly et al., 2019). Of these methods, the splitting test is the most convenient because the necessary disk-shaped samples can be directly obtained from drilled ice cores. Under a compression load, ice may fail in a splitting manner (Ji et al., 2020). For a typical splitting test, the tensile strength is determined by applying symmetrical loads to a disk sample,where the tensile strength can be calculated from the maximum compressive force (Rocco et al., 1999; Chen et al.,2020). Evidence indicates that splitting tests are effective in determining the tensile strength of rocks (ASTM, 2008).Furthermore, this method can be used to determine the elastic modulus (Wang et al., 2004; Ming et al., 2017). For materials in cold environments, splitting also has the advantage of determining the tensile strength (Zhou et al.,2015; Liu et al., 2018; Deng et al., 2019).
Even though the splitting test is widely applied to determine the tensile strength of materials, the uncertainty in the test is highly dependent on the loading technique. In a hydraulic rig, as studied by Kovacs and Kalafut (1977),considering the deformation at a non-uniform loading speed is difficult. Therefore, efforts have been made to examine the stress distribution during splitting tests. Yu et al. (2018) studied a theoretical solution for calculating the tensile strength from splitting tests under four different loading types. For distributed loads, Rocco et al. (1999) suggested a semi-empirical solution.To study the deformation distribution within a sample, the digital image correlation (DIC) method has been adopted in splitting tests (Wu et al., 2021). The DIC method was further developed for ice compression tests, and deformation localization has been well captured using this method (Qi et al.,2017; Wang et al., 2019).
In this study, to examine the tensile strength of sea ice and the influence of viscous deformation, the DIC method is applied to splitting tests. The tests are performed on ice samples with various loading speeds, thicknesses, and temperatures. Using the deformation distribution, a modified solution is then suggested to eliminate the influence of viscous deformation.
2 Experiment description
The splitting test has two advantages. First, the loading equipment is relatively simple to design. Because of the loading condition, all rigs for compression tests also work for splitting tests. The compression strength and tensile strength can be determined using nearly the same setup.Second, preparing a sample is very easy. Disk-shaped samples from drilled ice cores are much easier to obtain than the dumbbell-shaped samples necessary for uniaxial tensile tests.
2.1 Overall experimental procedure
In the splitting tests, disk-shaped samples were symmetrically subjected to compressive loads. During the tests, the upper plate was fixed, while the lower plate moved upward. The samples used in the tests were obtained from landfast ice in the Bohai Bay. The samples were tested at environmental temperatures of -5℃ (6 samples), -10℃(7 samples), -13℃ (6 samples), -16℃ (10 samples), -20℃(8 samples), and -33℃ (3 samples). When choosing the sample size and the loading speed, the standard for rock and concrete was taken as a reference. To verify if the standard was suitable for sea ice, the tests were applied at different loading speeds and for different sample thicknesses. Of the 40 samples, 32 samples were loaded at a speed of 0.04 mm·sand 8 samples were loaded at 0.1 mm·s. The samples used in the tests had thicknesses of 3 cm(28 samples), 4.3 cm (7 samples), and 6.2 cm (5 samples).During each test, the loading force and the displacement of the plate were simultaneously recorded. The sampling frequency was 100 Hz. For the samples prepared using the DIC method, images were captured at a frame rate of 20 fps.Because sample preparation is relatively time consuming,only 8 of the 40 samples were prepared using the DIC method. As shown in Figure 1, the surfaces of the samples prepared using the DIC method were painted with speckles.The deformation calculation method is introduced in Section 2.2.
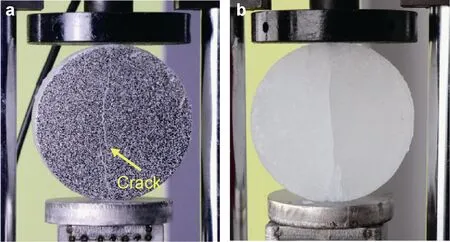
Figure 1 Overall setup for the splitting tests. a, An ice disk with a painted surface; b, Splitting test with a regular sample.
2.2 Determination of the full-field deformation
The DIC method was applied to obtain the full-field deformation. The DIC method recognizes deformation by matching speckles on the ice surface. In image processing, a painted surface is divided into multiple subsets. The DIC method can determine the normal and shear deformations from the movement and distortion of the subsets, as shown in Figure 2. The image features of the area of interest are transformed into a set number of subsets, whereA
indicates one subset on the location (i
,j
) at the time stepn
.In the next time step,n
+ 1, the shift and distortion of the matched subsetA
are used to calculate both the normal and shear deformations.
Figure 2 Sketch of the matching process used in the digital image correlation (DIC) method. a, Painted sample; b, Subset at time step n; c,Subset at time step n+1.
The speckles on the surface were produced by painting black and white spots. The used paints need to be cooled down prior to the painting procedure. In this way, the surface of the disk is not melted by the application of warm paint. Details concerning the application of the DIC method to ice mechanics experiments are provided by Wang et al.(2019). The resolution of the deformation depends on the image quality. In this study, images with 1626 × 1236 pixels provide a 0.3-mm resolution for the deformation. Several open source codes can be downloaded from GitHub with manual files (e.g., https://github.com/justinblaber/ncorr_2D_matlab; last accessed: 18 April 2019).
2.3 Description of the ice samples
A total of 40 ice disks were prepared at temperatures from-4℃ to -32℃ . The loading speeds were set to 0.1 mm·sand 0.04 mm·s. After each test, the sample salinity was measured via the liquid conductivity, while the density was obtained via hydrostatic weighting (Pustogvar and Kulyakhtin, 2016). The average salinity and density were 6.7 ± 3.1‰ and 849 ± 52 kg·m, respectively. The total porosity was calculated based on the suggested method of Cox and Weeks (1983). Table 1 shows the distribution of the brine volume and the total porosity. Thin-section tests indicated that the ice had a granular structure, as shown in Figure 3. The grain size was approximately 5-10 mm.

Table 1 Distribution of the brine volume and total porosity
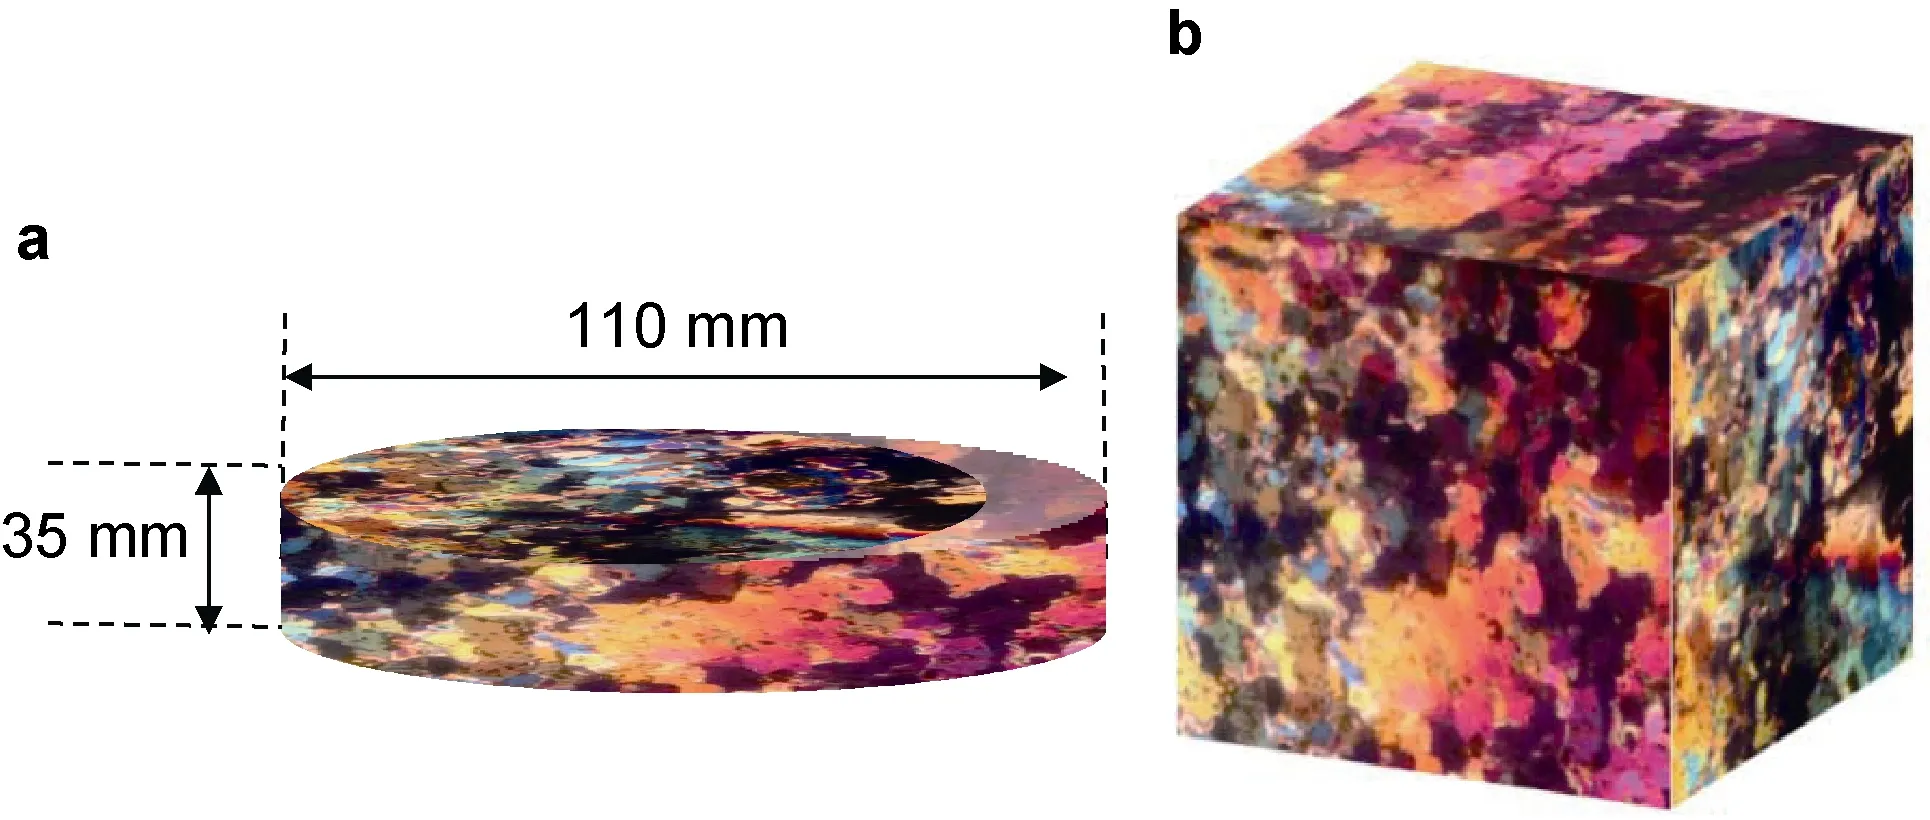
Figure 3 Texture of the ice samples. a, Dimensions of the ice samples; b, Structure of the ice cover.
3 Experimental results
3.1 Failure pattern of the ice disks under compression
The main mechanism of a splitting test is to create a strong tensile stress by applying a compression force. One way to ensure that the final failure was caused by tensile stress is to confirm that the samples fail to split according to the stress state analysis from elasticity theory explained by Muskhelishvili (1955). As shown in Figure 4, the samples failed with a main crack passing through the central line. This failure pattern indicates that the samples failed as the result of tension in the central area. This failure pattern appears on both the regular samples and the DIC samples; therefore, the failure process was not influenced by the surface paint.
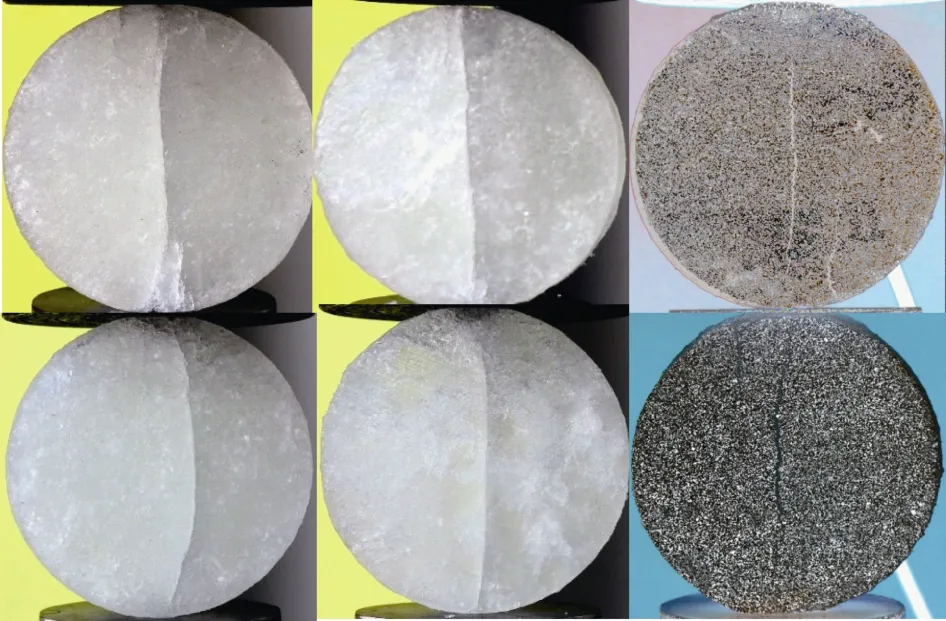
Figure 4 Final failures of ice samples in the splitting tests.
3.2 Distribution of ice sample deformation in the splitting test
The main advantage of the DIC method is that it can obtain the distribution of the deformation. The theoretical solution may be modified by localized deformation. In this section,the time history of the strain map was determined based on the DIC method. In this test, the sample dimensions were 110 mm (diameter) and 35 mm (thickness); the ice temperatur e was -12.6℃ ; and the loading speed was 0.04 mm·s.
(1) Deformation vertical to the loading direction
In Figure 5, the loading time history of the splitting test is shown. As shown in the curve, the load increased gently until it reached the maximum value, which was then followed by a sudden drop. The load reached its maximum value when the splitting crack developed, and then the sample failed. Based on the total time when the sample failed, the total deformation of the sample was approximately 1.6 mm for the loading speed of 0.04 mm·s.The distribution of the deformation vertical to the loading direction is shown in Figure 6.

Figure 5 Time history of the splitting test.
The distribution of the deformation vertical to the loading direction indicates that the deformation only had positive values, indicating that the sample was under tensile stress. Overall, the distribution follows two stages. In the first stage, the deformation is uniformly distributed throughout the sample, as shown fromt
= 0 s tot
= 33.7 s.In the second stage, strong deformation resulting from tension appears in the center of the sample, as shown fromt
= 43.1 s to the final failure. Compared with the short second stage, the first stage lasted approximately 40 s.Together with the time history curve, in Figure 6, we can see that the second stage only appears when the sample reaches the final failure. This indicates that the sample started to carry strong tensile stress after it was fully compressed.(2) Sample strain parallel to the loading direction
The deformation parallel to the loading direction had negative values, indicating that there were only compressive stresses in the sample. Unlike the deformation vertical to the loading direction, there is only one stage for the deformation distribution along the loading direction, as shown in Figure 7. Most of the deformation was distributed in the ice-platen contact area. Deformation localization was observed throughout the test. For the bulk of the sample, the deformation was relatively uniform.
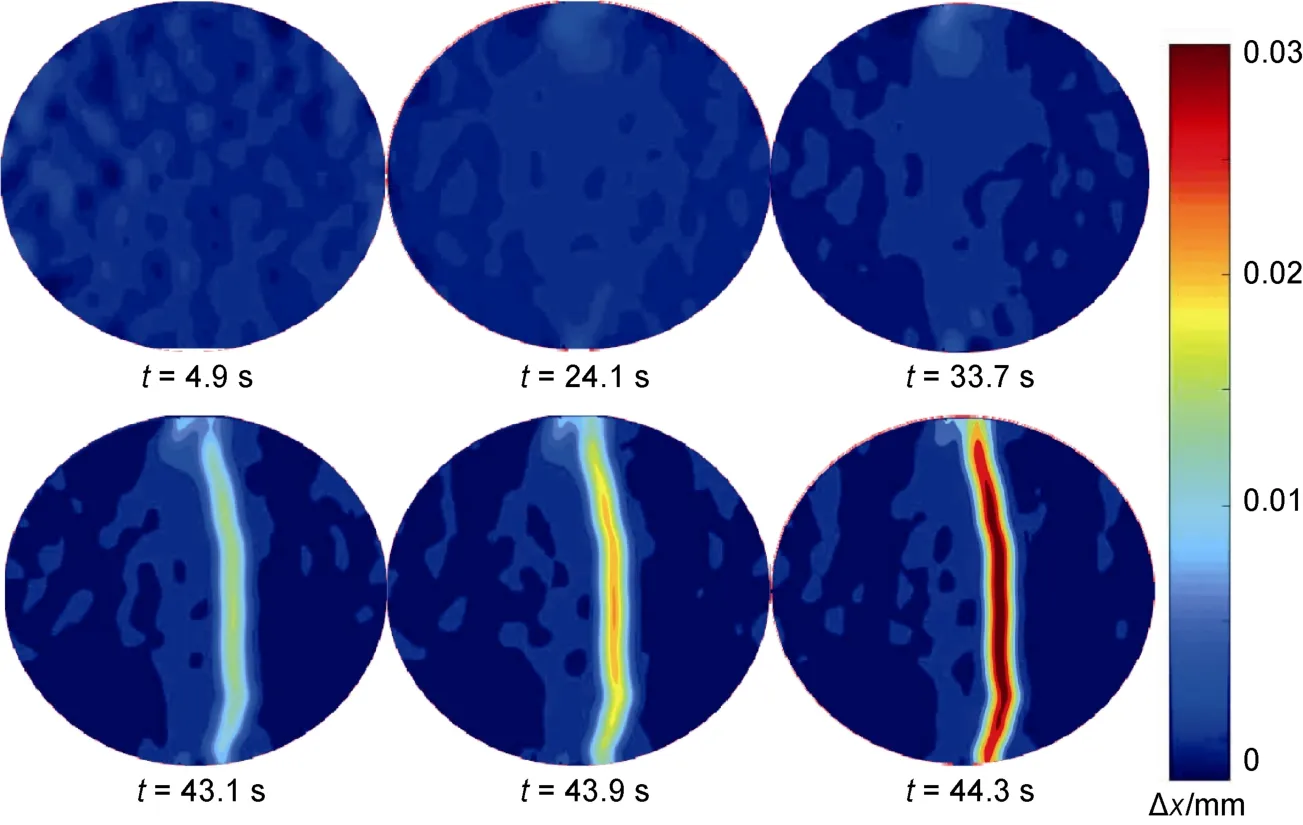
Figure 6 Deformation vertical to the loading direction time with time, t, indicated in seconds.
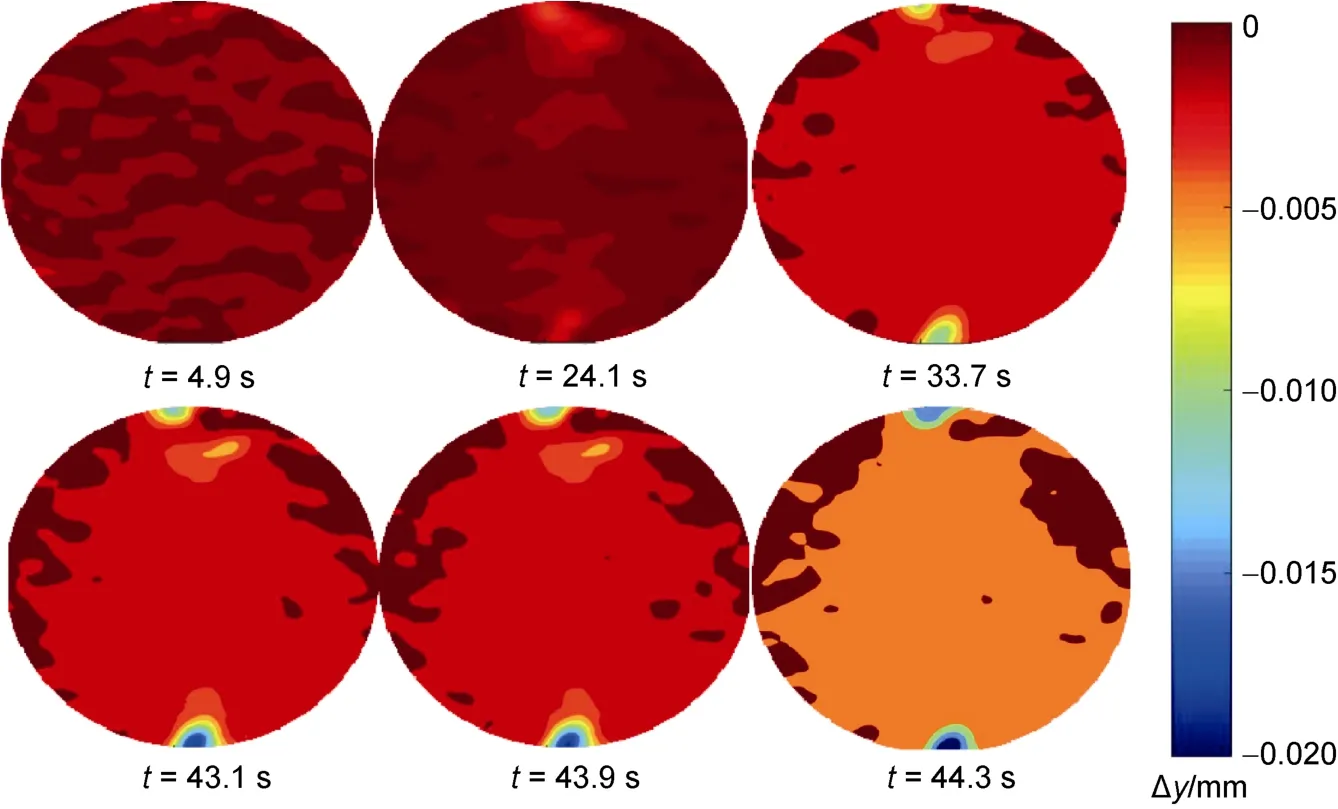
Figure 7 Deformation parallel to the loading direction with time, t, indicated in seconds.
The deformation along the loading direction suggests that the majority of the deformation resulting from compression was nearly symmetrically distributed over the ice-platen contact area. To simplify the theoretical solution,we assume that deformation only appearing in the ice-platen contact area is reasonable. Therefore, point loads become distributed loads for a sample under a compression load.
3.3 Time histories of various ice disks
Time histories were plotted for samples with three different thicknesses (3 cm, 4.3 cm, and 6.2 cm). Because the solution for the tensile strength is based on a two-dimensional (2D) assumption, the line load was also calculated, as shown in Figure 8. In the Figure 8, the time histories of the line load (P/L
), the ratio between load and sample thickness, are given. Figure 8 illustrates that there were no significant differences in the maximum line load for the different thicknesses. For thicknesses between 3 cm and 6.2 cm, there is no size influence on the determination of the tensile strength.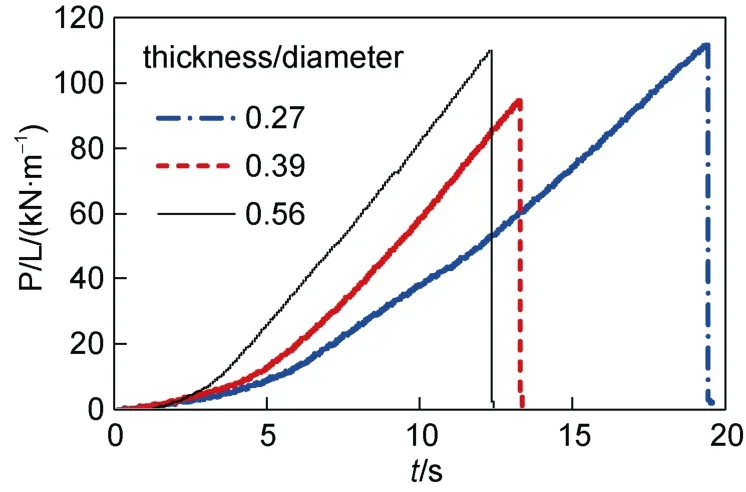
Figure 8 Time-history curves of ice samples with different thicknesses.
The relationship between the load and loading plate movement for the tests with different loading speeds is shown in Figure 9. Two different speeds of 0.04 mm·sand 0.1 mm·swere used in this study. The curves in Figure 9 indicate no significant differences in the maximum load.Therefore, it is likely that the loading speed is not an important factor in determining the tensile strength.
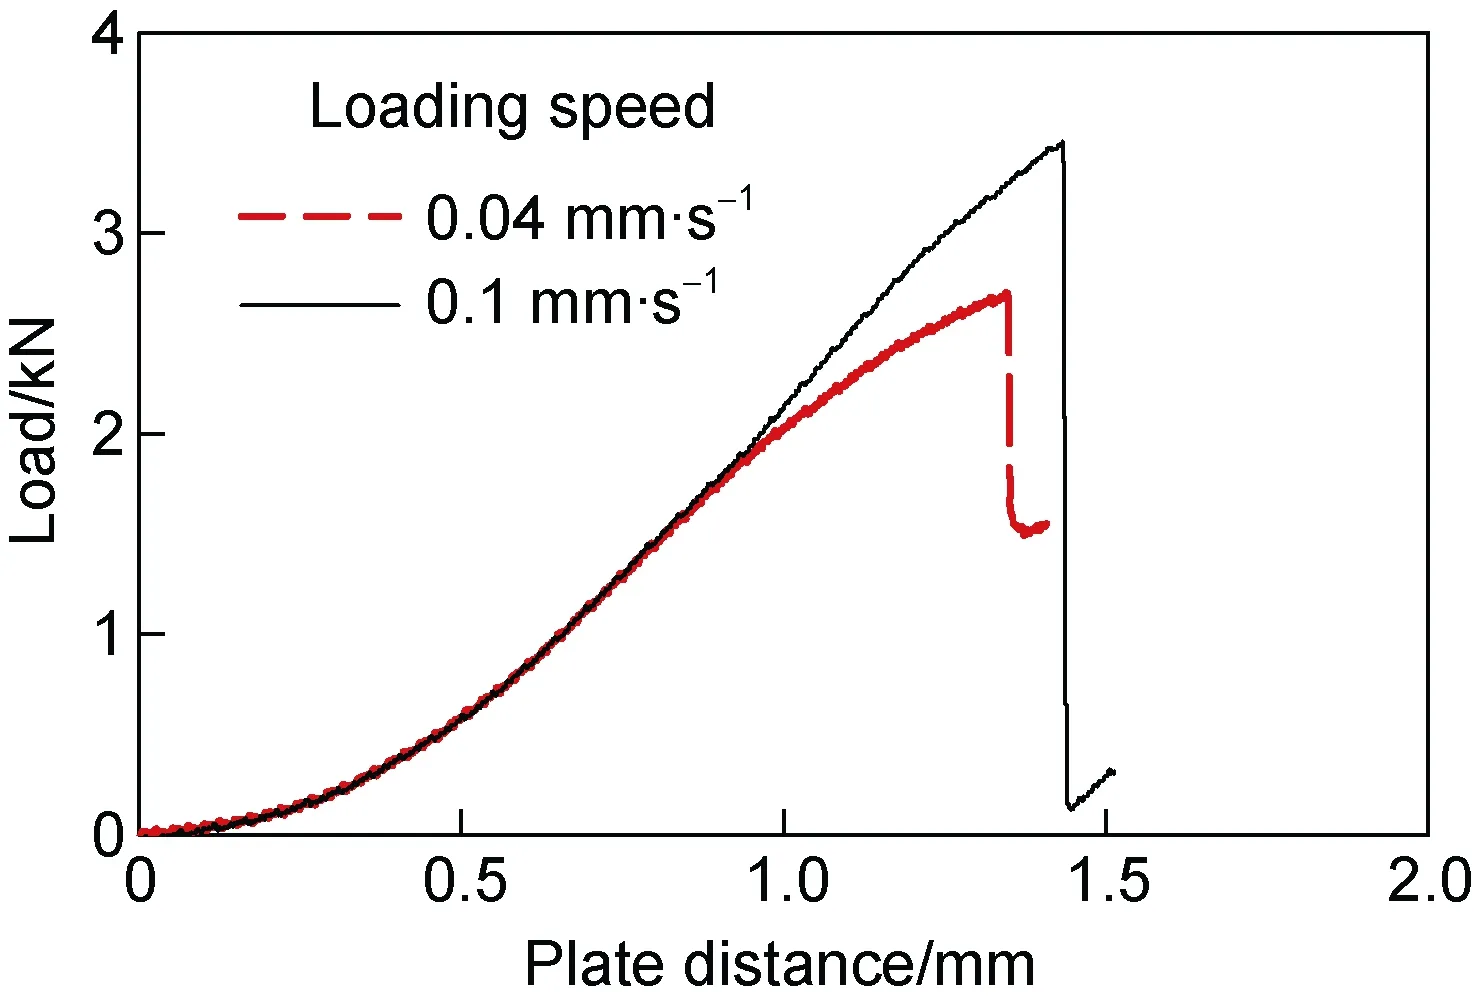
Figure 9 Relationship between the plate distance and the load for ice samples under different loading speeds.
In previous studies, the ice tensile strength has been strongly influenced by the brine volume. Because the ice samples were collected from the same area, the ice salinity of the samples in this study was within a relatively narrow range. To obtain samples with different brine volumes, tests were performed at different temperatures. The time-history curves of these tests are presented in Figure 10. As shown in Figure 10, the maximum load has a negative correlation with the ice temperature. The maximum load of the sample at -30℃ is more than three times that of the sample at-4.5 ℃ . The trend from this study is in agreement with that of a previous study (Menge and Jones, 1993). In the following section, the relationship between the brine volume and the tensile strength is further examined.
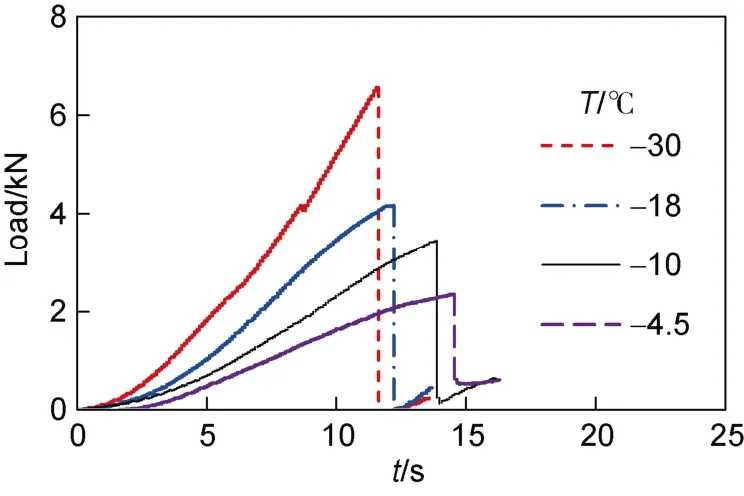
Figure 10 Time-history curves of ice samples at different temperatures.
4 Modified solution for determining the tensile strength
4.1 Derivation of the modified solution
To obtain an exact solution for the tensile strength, we began with classical equations. Because the thickness has very small influence on the loading process, the case of a disk under a symmetrical load can be simplified to a 2D problem, as shown in Figure 11. Subsequently, the elasticity model of Muskhelishvili (1955) can be used.
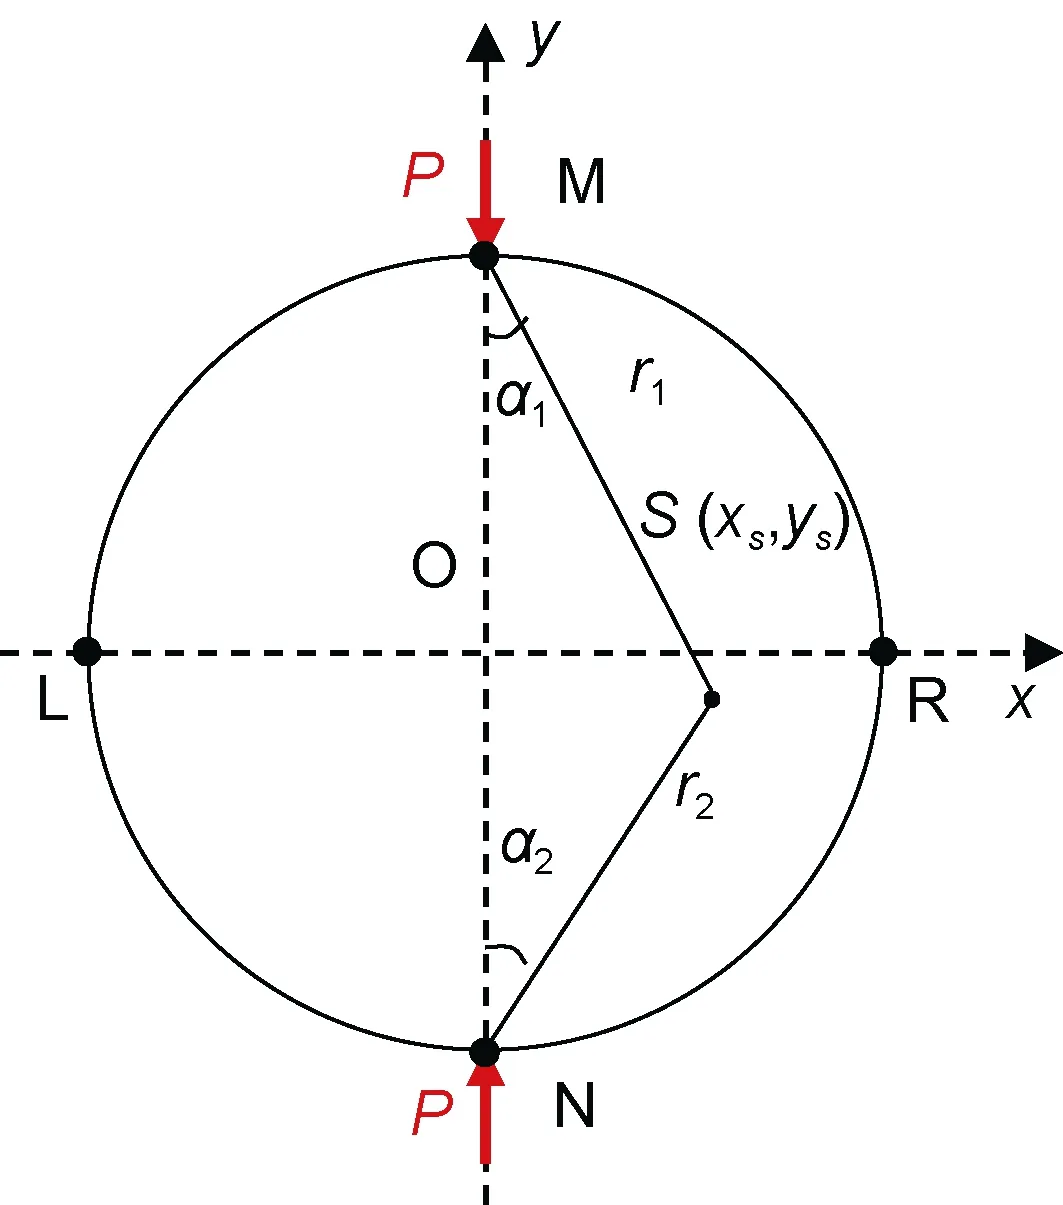
Figure 11 Schematic demonstrating the stress distribution within a two-dimensional disk.
For an isotropic disk subjected to concentrated loads,the analytical solution of the stress distribution is given by Muskhelishvili (1955):

σ
andσ
denote the normal stresses vertical and parallel to the loading direction, respectively,r
andr
are the distances from selected pointS
to the loading contact points M and N, respectively,α
andα
are their angles to the loading direction,P
is the concentrated load,D
is the disk diameter, andL
is the disk thickness.When pointS
is on they
-axis (x
= 0), Eqs. (1) and (2)become
Based on Eq. (3), the ASTM standard suggests that the tensile strength of rocks and concrete can be determined based on the maximum load:

P
is the maximum load andσ
is the determined tensile strength.Equations (1)-(5) assume two opposite point loads.However, sea ice is a viscous material and the contact area deforms during loading, as shown in Figure 7. A derived solution may not be available because the point loads become distributed loads. In this case, Rocco et al. (1999)suggested modifying Eq. (5) with a parameterβ
:
w
is the width of the distributed load.If we assume that the ice primarily deforms at the sample-plate contact area, then the width of the deformationw
can be rewritten as a function of the displacement of the plate, as shown in Figure 12. Because the loading speed is constant,w
becomes
Figure 12 Schematic of deformation within the contact area.
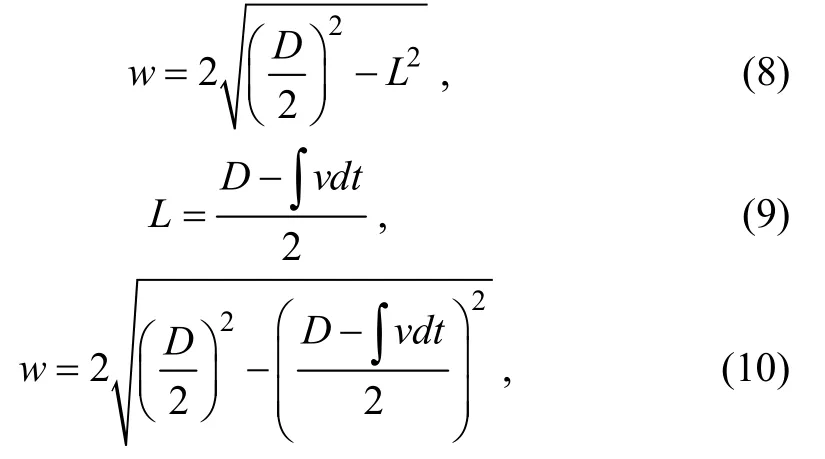
L
is the distance between the sample center and the plates andv
is the moving speed of the plates.4.2 Influence of porosity on the tensile strength
Equation (7) helps us calculate the tensile strength. The total porosity was determined following the method of Cox and Weeks (1983). As shown in Figure 13, the relationship between the tensile strength and the total porosity is plotted together with the data from previous studies. Overall, the tensile strength is negatively correlated with the total porosity. The tensile strength decreases from 0.9 MPa at 15‰ porosity to 0.3 MPa at 70‰ porosity. The trend from this study agrees with the results of previous experiments.From this viewpoint, the method introduced here can be used to determine the ice tensile strength. The tensile strength obtained here was slightly higher than that obtained by others in the low porosity range (40%-70%). Compared with the columnar ice used in previous studies, the samples used here were granular sea ice. There are no related studies concerning the differences in the tensile strengths of granular and columnar ice. However, if we consider the compression strength as a reference, the strength of columnar ice is lower than that of granular ice. If such a difference also affects the tensile strength, the results of this study are reasonable.
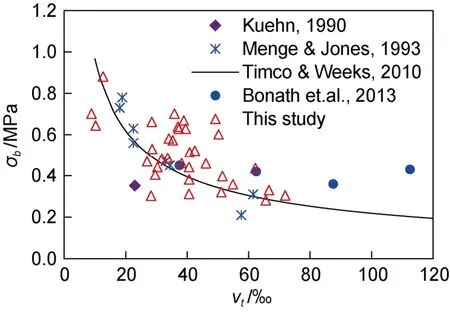
Figure 13 Relationship between the tensile strength and the total porosity.
5 Conclusions
Splitting tests were performed on naturally formed sea ice to study the tensile strength of the sea ice. The experiments were performed on samples with different thicknesses,loading speeds, and temperatures. The results show that the thickness and loading speed do not play important roles in the maximum failure load. Conversely, temperature had a strong influence on the maximum load.
The DIC method was also applied to study the ability of splitting tests to determine the tensile strength of sea ice. The DIC method was used to obtain the deformation distribution during the loading process.According to the deformation distribution, the central part of the sample experiences a strong tensile stress,leading to the final failure. The results indicate that the compression load is related to the tensile strength. In addition, strong compression deformation forms at the ice-platen contact area. This means that, if the case is simplified to a 2D problem, the sample can be treated with a distributed load rather than a point load. Based on the deformation, a modified equation was derived to determine the tensile strength. The tensile strength,compared with the tensile strength obtained from uniaxial tension tests, indicates that the tensile strength has a negative correlation with the ice porosity. This trend shows good agreement with that of the directly measured strength. The results from this study indicate that the splitting test is a viable method for determining the tensile strength of sea ice.
Data
All data that support our findings in this paper are available from the corresponding author (jisy@dlut.edu.cn) upon reasonable request.Acknowledgments
This study was supported financially by the National Key Research and Development Program of China (Grant no.2018YFA0605902), the National Natural Science Foundation of China(Grant no. 52101300), the Fundamental Research Funds for the Central Universities (Grant no. DUT21LK03) and Joint Scientific Research Fund Project of DBJI (Grant no. ICR2102). We thank two reviewers and Guest Editor Prof. Matti Leppäranta, for constructive suggestions and comments on further improvement of this manuscript.杂志排行
Advances in Polar Science的其它文章
- One special issue will be published in 2022
- Cover picture: snapshots of the long term cooperation between China and Finland
- An outstanding example of cooperation between Arctic and non-Arctic countries in cryosphere and climate research: Sino-Finnish cooperation for more than 30 years
- The role of lake heat flux in the growth and melting of ice
- Modelling on seasonal lake ice evolution in central Asian arid climate zone: a case study
- Variation of Antarctic marginal ice zone extent(1989-2019)
