The role of lake heat flux in the growth and melting of ice
2021-08-19BinCHENGXIEFeiLUPengHUOPuzhenMattiLEPPRANTA
Bin CHENG, XIE Fei, LU Peng*, HUO Puzhen & Matti LEPPÄRANTA
1 Finnish Meteorological Institute, Helsinki Fi-00101, Finland;
2 State Key Laboratory of Coastal and Offshore Engineering, Dalian University of Technology, Dalian 116081, China;
3 University of Helsinki, Helsinki Fi-00014, Finland
Abstract For shallow lakes, ice mass balance is largely dominated by thermodynamic processes. The heat flux from lake water plays a critical role for ice growth and melting. In this study, we applied a numerical thermodynamic lake model to investigate the sensitivity of the lake ice mass balance to the lake heat flux during the growth and melting periods. Several groups of modelling experiments forced by simplified climatological weather data have been carried out. Two sites, Lake Wuliangsuhai in Inner Mongolia, China’s arid region and Lake Orajärvi in snowy Finnish Lapland, were investigated. Lake heat flux affects inversely proportional maximum ice thickness followed by ice break-up date. The solar radiation and surface albedo complicate the effect of lake heat flux on lake ice mass balance during melting season. With heavy snowfall, the increase of lake heat flux adds on the formation of granular ice but reduces the formation of columnar ice. Under climatological weather conditions, the ice cover winter seasonal mean lake heat flux were 14 W·m-2 and 4 W·m-2 in Lake Wuliangsuhai and Lake Orajärvi,respectively.
Keywords shallow lakes, lake ice, heat flux, numerical modelling
1 Introduction
In the northern and mountain regions of Eurasia, lakes are frozen in winter. The ice season can be up to seven months long and the thickness of ice can exceed 100 cm. Apart from large lakes, an ice cover forms a solid lid over a lake and stabilizes the thermal characteristics of the water body.The surface water is kept at the freezing point or higher, and only thermohaline circulation is present (Kirillin et al., 2012;Leppäranta, 2014). Vertical transfer of heat in the water body is limited but can be large when the solar radiation penetrates the ice cover. In shallow lakes the bottom sediment forms a significant heat storage that can influence the winter thermodynamics (Golosov et al., 2007).
Mathematical modelling of lake ice growth and melting is approached by semi-analytical methods based on the freezing-degree-days for the first-order analysis (Ashton,1986; Leppäranta, 1993). Numerical models have been employed for more accurate descriptions of the evolution of ice thickness, including the treatment of the slush and snow-ice formation (Yang et al., 2012; Cheng et al., 2014;Stepanenko et al., 2019). The growth and melting of lake ice are primarily forced by the atmospheric forcing but the sensible heat flux from the lake water reduces the growth rate in winter and accelerates melting in spring. This heat flux and the solar radiation penetrated in the ice are key factors affecting the lake ice mass balance.
There are three principal layers in a static lake ice cover: primary ice, congelation ice and snow-ice (Michel and Ramseier, 1971; Gow and Govoni, 1983; Leppäranta and Kosloff, 2000). When a lake starts to freeze, ice crystals form at the surface and join to form a thin sheet of ice, the so-called primary ice. Freezing in calm conditions produces a very thin (millimeters thick) sheet of primary ice. When the ice forms under more disturbed conditions, the primary ice layer is formed of frazil ice. Congelation ice is formed as the ice grows down crystallizing from the lake water. An eventual snow cover acts as a good insulator and thus accentuates the decoupling of the atmosphere from the water body. A part of the snow cover may change into slush by mixing with liquid water from precipitation, melting snow or local flooding. Snow-ice forms when this slush freezes, and pockets of slush can remain within the ice cover and may persist for several weeks.
From the point of view of lake water, lake heat flux is a dominating component in the heat budget of ice-covered lakes since it is the predominant heat sink of the water below the ice cover. From the point of view of lake ice cover, the heat flux from the lake water to ice is a secondary factor in the heat budget of ice. It shows up in the growth rate and influences the thickness of the internal layers comprising snow-ice, slush, and congelation ice. In freshwater lakes, the water beneath ice cover is always warmer than the ice bottom (which is at the freezing point),and the heat flux from water to ice must be then positive.This paper examines the role of the heat flux from lake water to the bottom of ice using numerical modeling. Two typical lakes located in different climate zones in Eurasia- high latitude boreal and mid-latitude dry and cold districts - were examined to quantify the role of the lake heat flux and to highlight the differences between these climate zones.
2 Data and modelling
2.1 Lake sites and data
Two lakes (Lake Wuliangsuhai and Lake Orajärvi) were selected in this study (Figure 1). Lake Wuliangsuhai is located in the Central Asian dry climate zone in Inner Mongolia, China. It has a large surface area, about 300 kmand elevation of 1019 m above sea level. It is a very shallow lake with an average water depth of 1.3 m. The lake is usually covered with ice from early November to the end of March. Snow cover is very thin due to the arid climate environment. The diurnal solar radiation is strong since most of the winter has clear sky conditions. Lake Wuliangsuhai is the second largest lake in Inner Mongolia,it played an important role on the deployment of water resources. Both inflow and outflow affect the Hetao Irrigation District, so the water quality of the lake is very important to the regional economic and ecological environment. Most of the Lake Wuliangsuhai research focused on aquatic ecology (Sun, 2019), in particular the impact of ice cover on pollutant distribution (Yang et al.,2016) and the effect of subglacial light conditions on the primary productivity of the lake (Song, 2019). Not much attention was paid on lake ice physics.

Figure 1 Locations and geometric shapes of Lake Wuliangsuhai in Asia and Lake Orajärvi in Europe. Note the different spatial scales of the lakes.
Lake Orajärvi is located in the northern boreal zone in Sodankylä, northern Finland. It has a surface area of 11 km.It is shallow, the average water depth is 4.4 m. The lake surface elevation is 182 m above sea level. The first snowfall typically occurs in late October, but the snow may melt during warmer autumn days. The seasonally permanent snow accumulation on land usually starts between mid-November and early December. The lake ice season starts in early November and lasts until mid-May. Snow is present on the lake ice surface every winter. Lake Orajärvi is close to a super-observation site in Sodankylä (67.367°N,26.629°E) operated by the Finnish Meteorological Institute’s Arctic Space Centre (FMI-ARC). Benefited from the high-quality meteorological observations in the close-by supersite, lake snow and ice temperature, thickness and energy balance have been investigated (Cheng et al., 2014).However, the limnology was not investigated thoroughly.
Ice observation programs have been carried out in Lake Wuliangsuhai successively since the winter 2017/2018.A field camp was settled some 500 m from the east coast of the lake. The meteorological, lake ice and lake hydrological observations were collected for a period of about 60 d in each ice season (Cao et al., 2021). The observed average sensible heat flux from water to ice (Q
) was 6.4 W·mand 14.2 W·min winters 2016-2017 and 2017-2018,respectively (Lu et al., 2020). These values were higher than typically observed in high-latitude boreal lakes(Shirasawa et al., 2006; Yang et al., 2012). This is because the strong solar radiative flux in Lake Wuliangsuhai acted as a heat source for the water body below ice, in particular since the ice surface was snow-free or covered by thin snow.Additionally, the lake is so shallow that the bottom sediment contributed to the heat flux to water and ice(Huang et al., 2019).The heat flux from water to ice showed large inter-annual variations in Lake Wuliangsuhai. The difference between these two winters was mainly due to the difference in the lake water temperature and in the temperature difference between ice bottom and lake bottom during melting season. We observed an average water temperature of 4.7°C and a vertical water temperature gradient of 0.23°C·cmfrom January to February in winter 2017-2018, but the average water temperature observed during the same period in winter 2016-2017 was much lower, 3.8°C, and the vertical water temperature gradient was only 0.10°C·cm. The difference was attributed by the surface status, i.e., bare ice in 2017-2018 versus a thin layer of snow in 2016-2017. The water depth at the observation site in 2016-2017 and 2017-2018 was 1.7 m and 1.4 m,respectively. For a bare ice surface, more solar radiation entered the water body increasing the water temperature and warming up the lake bottom sediment (Cao et al., 2021).
Annual winter observation programs have been ongoing in Lake Orajärvi since 2009 using a thermistor string-based ice mass balance buoy (SIMBA) (Cheng et al.,2020). The meteorological observations were available from the nearby Finnish Arctic Space Centre, a supersite equipped with comprehensives instrumentation to perform weather and upper atmosphere observations (https://litdb.fmi.fi/). Unfortunately, there are no direct observations of the heat flux from water to ice. The observed water temperature was 0 °C at the ice bottom and between 1°C and 1.5°C at the lowest sensor located 2 m below ice bottom (Cheng et al., 2021). Compared with Lake Wuliangsuhai, the major differences in the weather conditions during winter were due to the snow cover, clouds and solar radiation. The climatological observations indicated that a mean snow depth on land was 0.45 m between November and May. The seasonal maximum mean snow depth was 0.75 m in early April. The maximum snow depth on land reached 124 cm in April in winter 2019-2020.The cloudy sky dominates the winter season. During early winter there was, in practice, no solar radiation since the solar zenith angle was almost zero. However, in early spring,solar radiation increases fast.
2.2 Numerical modelling
Numerical modelling approach was applied to investigate the lake ice mass balance. The quasi-linear partial differential equation of heat conduction is the core of the snow and ice thermodynamic models (Maykut and Untersteiner, 1971; Flato and Brown, 1996; Launiainen and Cheng, 1998; Saloranta, 2000). The upper and lower boundary conditions are the surface skin temperature (T
)and ice bottom temperature (T
), respectively. For each time step, theT
is a function of turbulent, radiative and thermal heat fluxes acting on a finite surface layer (Δh
). The surface turbulent and radiative fluxes are either observed,parameterized, or received from a Numerical Weather Prediction (NWP) model. The essential weather parameters forT
calculation are wind speed (
V
), air temperature (T
),relative humidity (Rh
), cloudiness (CN
) and snow precipitation (PrecS
) (Table 1). The Newton iterative method is often applied to calculateT
. Ice bottom is conjugated with lake water, so the freezing point temperature is always assumed forT
. Once theT
is calculated, the vertical temperature of snow or ice is solved numerically by the heat conduction equation. Finally, the snow and ice mass balance at both surface and bottom can be obtained before next time step.For the current snow and ice thermodynamic model,the ice bottom mass balance equation reads:

h
is the ice thickness,ρ
is ice density.L
latent heat of fusion;k
is the thermal conductivity of lake ice,T
is the lake ice temperature.z
is the vertical coordinate taken as positive downward. For numerical ice modelling,Q
is often regarded as an important external forcing parameter.The seasonal mean heat flux from water has been estimated as 1-5 W·min winter (Shirasawa et al., 2006;Yang et al., 2012), but in the melting period it can be more than 10 W·m(Jakkila et al., 2009; Leppäranta et al., 2019;Lu et al., 2020). The under-ice boundary layer may be laminar or turbulent, or in transition between them. The heat flux from water to ice is

λ
is the heat exchange coefficient,T
is water temperature. In laminar flow,λ
=k
≈ 0.56 W·m·℃is the thermal conductivity of water. Then, for a temperature difference of 1 ℃ across the top 1-m layer, we haveQ
≈0.5 W·m. In turbulent conditions, the first-order theory is formally similar to Eq. (2) but withλ
=k
≈10-100 W·m·℃is the eddy conductivity. Then the transfer coefficient depends on the roughness of ice bottom and stratification of the boundary layer. The water flow beneath a stable lake ice cover is often in the laminar-turbulent transition regime, where the exchange coefficient is not well established. Petrov et al. (2006)employed an effective conductivity,λ
≈ 20 W·m·℃, in a medium-size, shallow lake in Russian Karelia and confirmed for boreal lakes in Finland (Shirasawa et al.,2006).In this study, the modelling experiments are entitled as climatological simulations, i.e., the simulations covered the entire winter season from November/December to May.We used simplified external and boundary conditions based on the average values from the climatological normal period (1981-2010). Such simplifications minimized the complex interactions among atmospheric variables. Table 1 lists the essential model input parameters. The major differences between these two lakes are in the snow conditions, cloud cover and solar radiation(latitude).
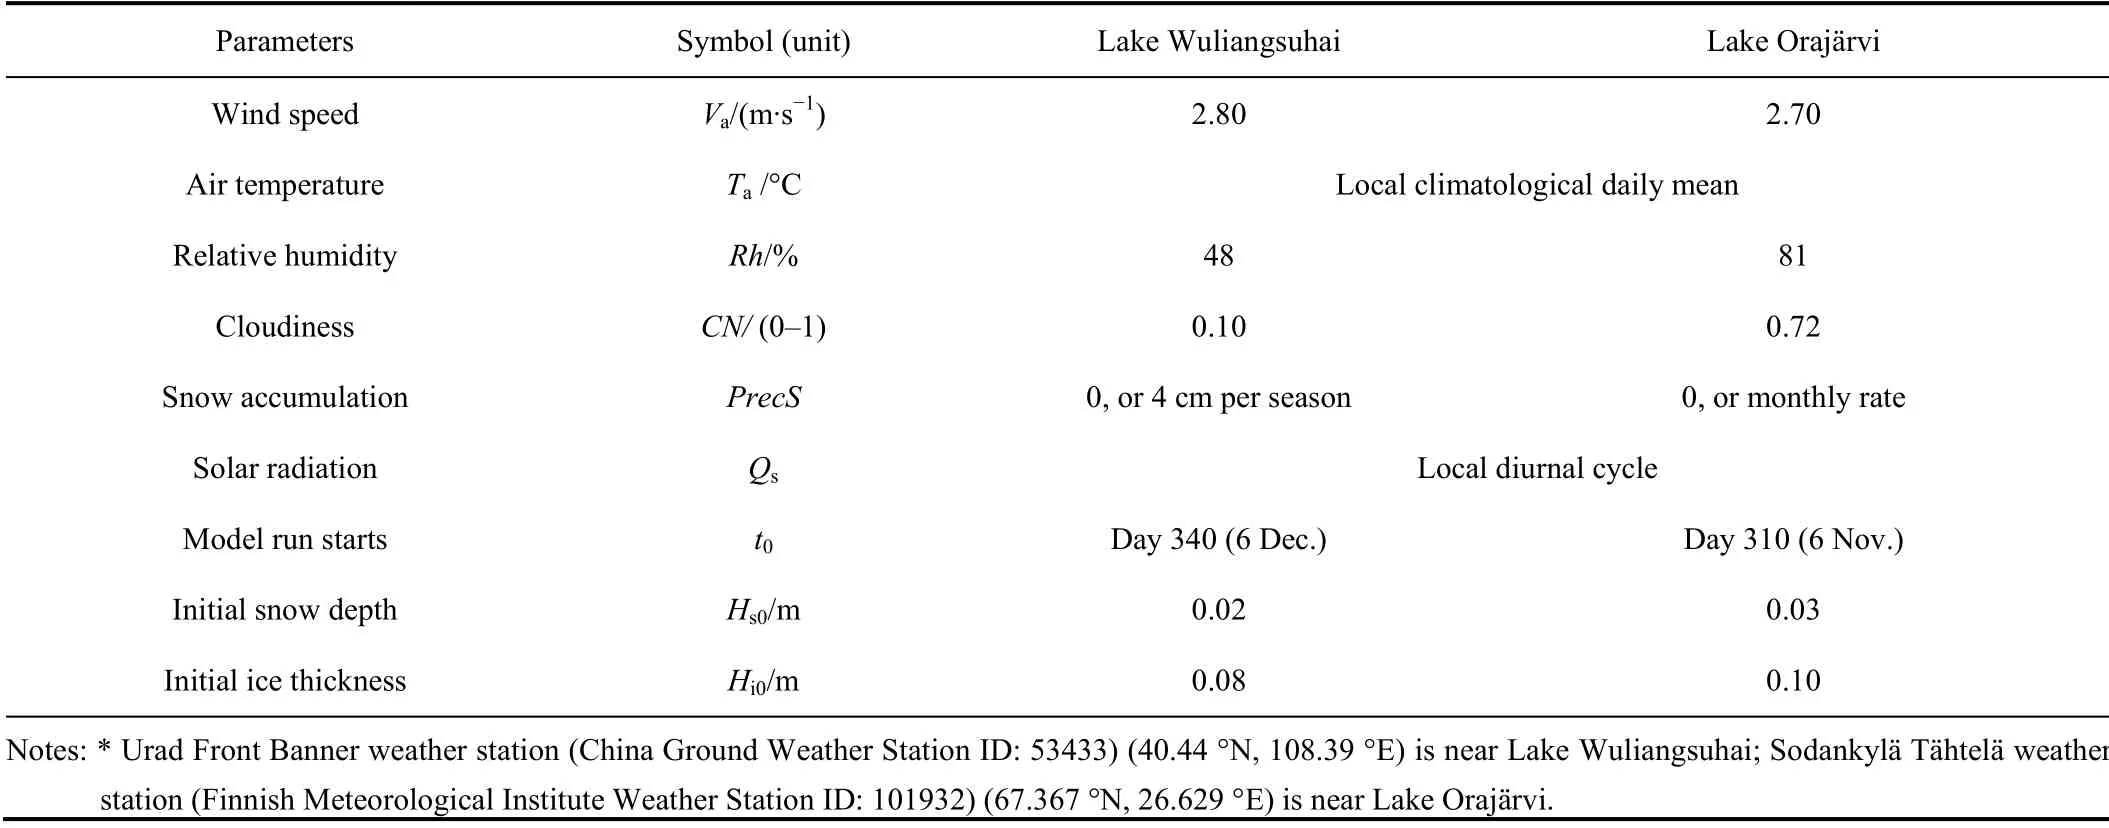
Table 1 Summary of mean climatological observations (1981-2010) obtained from weather stations* in the vicinity of the lakes and initial modelling conditions
Case studies on seasonal ice mass balance have been carried out for both lakes (Lu et al., 2021; Cheng et al.,2014). In those studies,Q
was time-dependent and selected either as an optimised parameter or based on in-situ observations to match the investigated cases. In this study,we focus on the role of a climatological meanQ
on total lake ice mass balance. During model simulations, the lake freeze-up strongly tied up with air-water interaction is skipped for simplification. Model experiments start in early December and early November respectively for each lake.We pay attention to the modelled maximum ice thickness,timing of maximum ice thickness, break-up dates and the effect of snow. Model experiments are carried out using differentQ
. We investigate two cases (bare lake ice, snow on lake ice) for both lakes. The seasonal meanQ
providing the best result of ice thickness evolution using climatological weather condition (c.f. Table 1) for both lakes are provided.3 Results
3.1 Lake Wuliangsuhai
3.1.1 Bare lake ice
A seasonal constant lake heat flux (Q
) was applied for each model experiment. The values ofQ
were between 0 W·mand 24 W·m. Model runs lasted from 6 December until 31 May. The ice breakup date was defined as the day the modelled ice thickness became less than 0.02 m. This breakup date was pure numerical. In reality,ice breakup date is prior this date because during final melting stage, lake ice submerged in the lake water deteriorates and easily subject to the dynamic break up by the wind (Zhai et al., 2021). The modelled seasonal maximum ice thickness was linearly decreasing with increasingQ
(Figure 2).The modelled maximum seasonal ice thickness ranged between 0.63-0.34 m asQ
increased from 0 up to 24 W·m. Both the timing of the maximum ice thickness and the length of the melting period were affected by theQ
(Figure 3). Using a seasonal mean observedQ
of 6.5 W·m, a case study showed a good agreement of modelled and observed seasonal maximum ice thickness of about 0.56 m in early March (Lu et al., 2021). Here, a model run usingQ
= 6 W·myielded a comparable observed maximum ice thickness (Table 2). However, the timing of the maximum ice thickness was on 17 March that differed from the case study. The difference is probably caused by the offset between the climatological daily mean and hourly values of the forcing data. Both the timing of the maximum ice thickness and the break-up date occurred earlier with increasing ofQ
(Figure 3). The breakup date was more sensitive to the
Q
compared with the timing of the maximum ice thickness. The melting period shortened from 68 d to 36 d.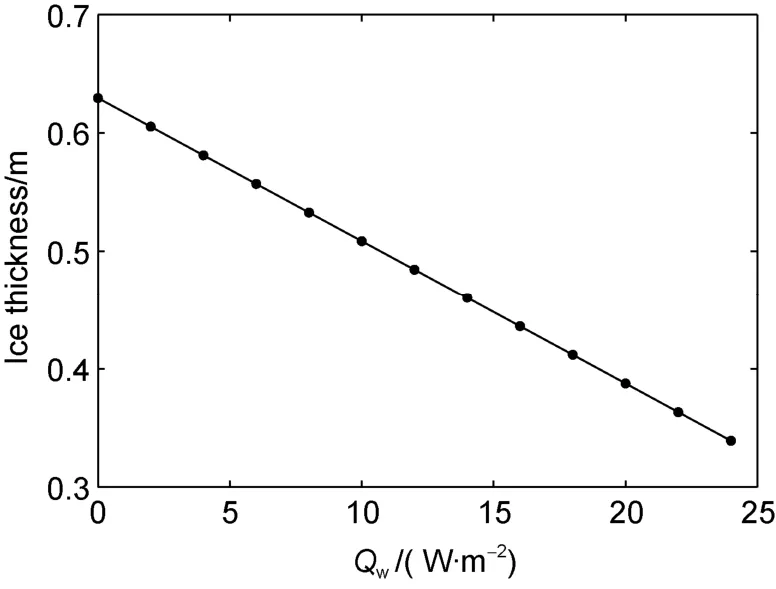
Figure 2 Modelled maximum ice thickness versus different Qw in Lake Wuliangsuhai. The black dots are Qw applied in model experiments.
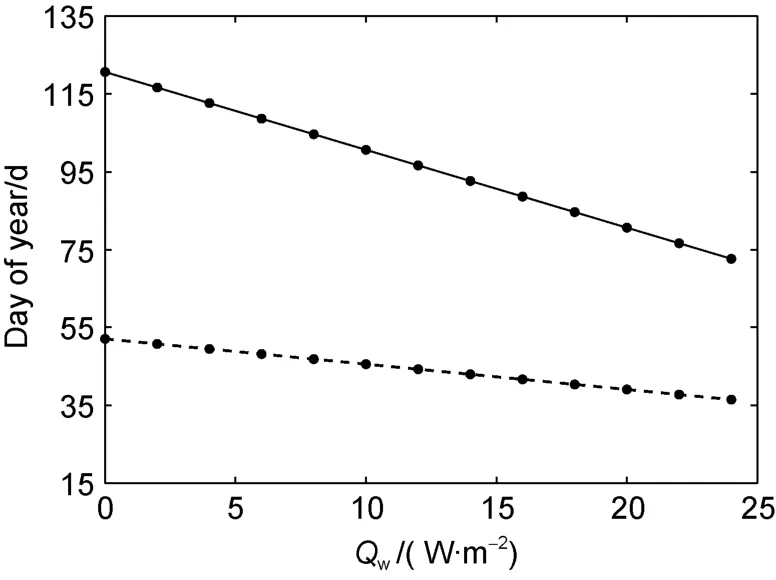
Figure 3 The times (Day of year) when the modelled ice thickness reached the seasonal maximum value (broken line) and the modelled breakup date (solid line) versus Qw in Lake Wuliangsuhai.

Table 2 Modelled seasonal maximum ice thickness, timing of maximum ice thickness, break-up date and total number of melting day(from maximum ice thickness until ice break-up) using different Qw in Lake Wuliangsuhai
Ice observations in Lake Wuliangsuhai were sparse.The limited measurements were collected in the field programs. Routine operational ice measurements have not been implemented yet. Early observations suggested that the maximum ice thickness can reach up to 0.6 m (Yang et al., 2016). This level, however, has reduced in recent years and its interannual variation is large (Cao et al., 2021).Under the climatological weather forcing (Table 1), we identified that model runs using a constantQ
of 14 W·myielded the seasonal ice thickness (Figure 4) that was in good agreement with the observed seasonal 15-day mean ice thickness during 3 successive field campaigns (Cao et al., 2021). We therefore conclude that a mean 14 W·mofQ
can be used as the winter climatological lake heat flux in Lake Wuliangsuhai.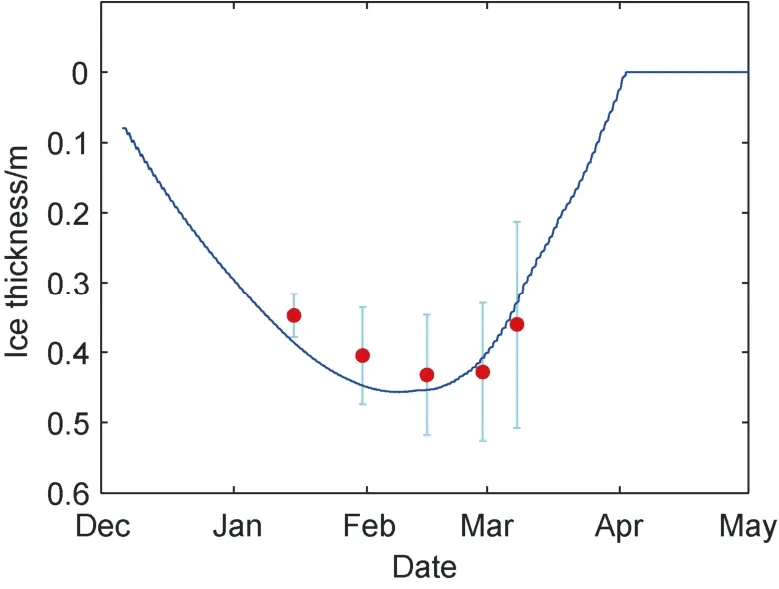
Figure 4 Modelled ice thickness evolution using constant Qw=14 W·m-2 in Lake Wuliangsuhai during the simulation period.The red dots are the observed 15-day multi-seasonal mean ice thickness. The vertical bars show the standard deviations.
3.1.2 Snow on lake ice
Although Lake Wuliangsuhai is in an arid climate region,snow may appear on lake ice occasionally. We therefore constructed a scenario assuming a thin snow (0.04 m in total) accumulation on lake ice during the simulation period when the air temperature was below 0°C. The initial snow depth was assumed to be 0.02 m. The selection ofQ
for model experiments is the same as in section 3.1.1.With this very thin snow cover on top of lake ice, the modeled maximum ice thickness was reduced because of snow insulation. The increase of lake heat flux is inversely proportional to the modelled maximum ice thickness as in thebare ice case. However, a weak nonlinearity between the maximum ice thickness andQ
is visible (Figure 5), most likely attributed to the effect of snow. The timing of the maximum ice thickness is slightly more sensitive to theQ
than the breakup date (Figure 6). Compared with the bare ice case in Table 2, the timing of the maximum ice thickness was more sensitive toQ
, and the break-up date delayed further from 10 to 30 d in response to
Q
changing from 0 to 24 W·m. Ice season was getting longer with snow on top.

Figure 5 Modeled maximum ice thickness versus Qw with a thin snow cover on top in Lake Wuliangsuhai. The black dots are Qw applied in model experiments.
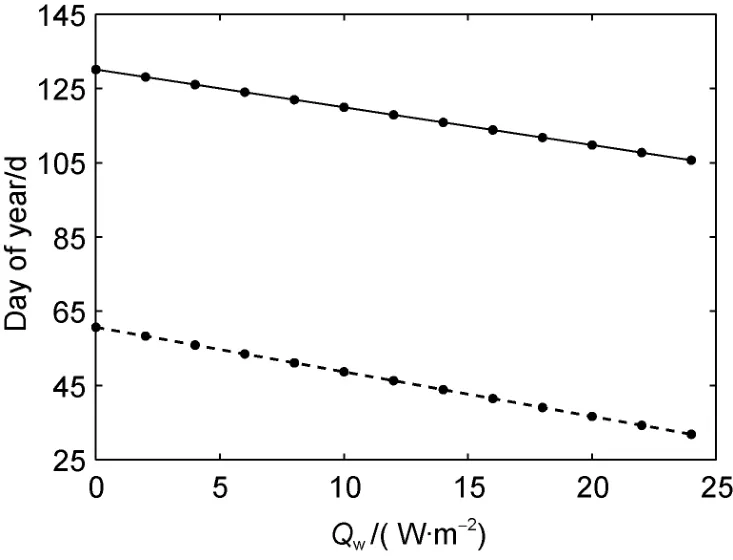
Figure 6 The times (in Julian days) when the modelled ice thickness reached the seasonal maximum value (broken line) and the modelled breakup date (solid line) versus different Qw in Lake Wuliangsuhai with a thin snow cover on top.
3.2 Lake Orajärvi
3.2.1 Snow on lake ice
Snow is guaranteed on lake ice in Lake Orajärvi. The monthly accumulated snow precipitation (PrecS
) is obtained from the climatological normal period(1981-2010). For each winter month, the accumulatedPrecS
was averaged to each day and converted to snow depth by dividing by the average snow density assumed to be 330 kg·m(Cheng et al., 2014). In Finnish Lapland,snowfall can be substantial. In addition to its insulation effect,snow can interact with lake ice causing snow to ice transformation. In early winter a heavy snow loading on top of the relatively thin lake ice may cause a negative freeboard and subsequently flooding of the snow. A slush layer may be generated that subsequently freezes above the original ice cover. On the other hand, melt water from snow layer or snowfall (in the form of sleet or wet snow) may percolate downwards and refreeze above the original ice cover, to form a frozen slush layer. In both cases, the snow on lake ice becomes a source term for lake ice. The first process is called snow-ice formation due to flooding(Leppäranta, 1983), the second one is called superimposed ice formation (Kawamura et al., 1997). Both snow-ice and superimposed ice can be classified as granular ice. The detail modelling procedure can be found by Cheng et al.(2003, 2014). The snow and ice interaction in early winter season can be very complex (Toyota et al., 2020). To avoid this, model runs started with the initial snow depth and ice thickness of 0.03 m and 0.1 m, respectively. These initial values were averages from 33 years climatological HIGHTSI simulations (Wei et al., 2016). The model runs started on day 310 (6 November).The modelled maximum ice thickness decreases asQ
increases (Figure 7). We can see whenQ
was larger than 18 W·m, the modelled maximum ice thickness was gradually approaching 0.3 m. This ice is entirely due to granular ice formation, as the ice formed from lake water was completely melted before the ice reached the maximum thickness due to snow to ice transformation. This nonlinearity of the modelled maximum ice thickness versus lake heat flux was caused by snow effect. The seasonal maximum ice thickness ranged between 0.94 m to 0.3 m in response to the variation ofQ
.The timing of the maximum ice thickness and breakup revealed similar characteristics as in Lake Wuliangsuhai with snow in ice (Figure 8). Both dates were advancing with increasingQ
, but the timing of the maximum ice thickness was more sensitive toQ
than the breakup date,resulting in a longer melting period: from 41 d to 62 d with the variation ofQ
from 0 to 24 W·m.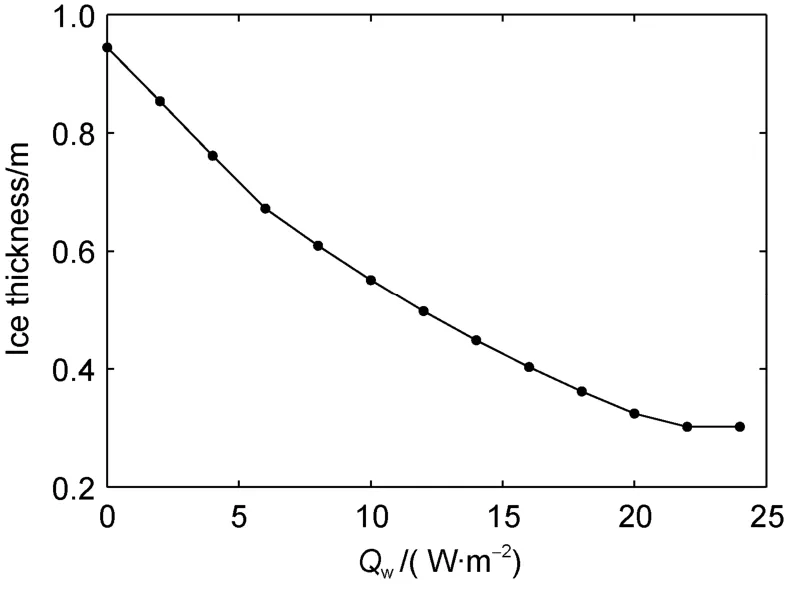
Figure 7 Modelled maximum (solid line) ice thickness versus Qw in Lake Orajärvi. The black dots are Qw applied in model experiments.
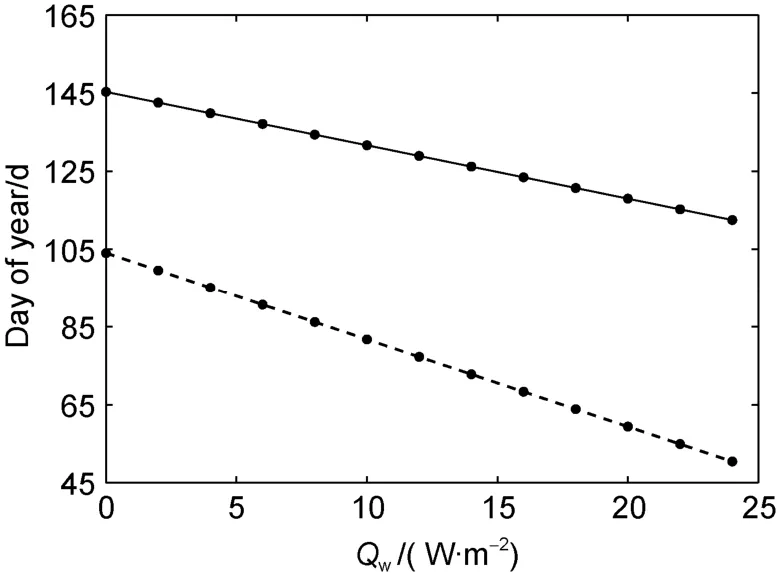
Figure 8 The times (in Julian days) when the modelled ice thickness reached the seasonal maximum value (broken line) and the modelled breakup date (solid line) versus different Qw in Lake Orajärvi.
Figure 9 shows the modelled maximum lake ice thickness as a function of differentQ
applied for the model run. WhenQ
was small, bottom ice formation dominated the growth. An increase of
Q
gradually decreased ice formation at the ice bottom but increased granular ice formation. The increase ofQ
at some point makes the granular ice formation surpass ice freezing at bottom. WhenQ
was larger than 18 W·m, granular ice was the main ice layer. Overall,Q
was inversely proportional to the ice thickness. This conclusion is the same as with the model run without snow cover. The last three dots on the broken line indicate that the net ice mass balance at the bottom was negative. The columnar ice melted before the ice reached the seasonal maximum entirely as granular ice. The seasonal maximum thickness was contributed by the refreezing of snow, i.e., granular ice formation.Compared with in-situ observations, we find that model run using a 4 W·mheat flux from lake water yielded the best agreement (Figure 10). Analogous to the Lake Wuliangshuhai case, we identify this value representing the climatological heat flux from Lake Orajärvi.
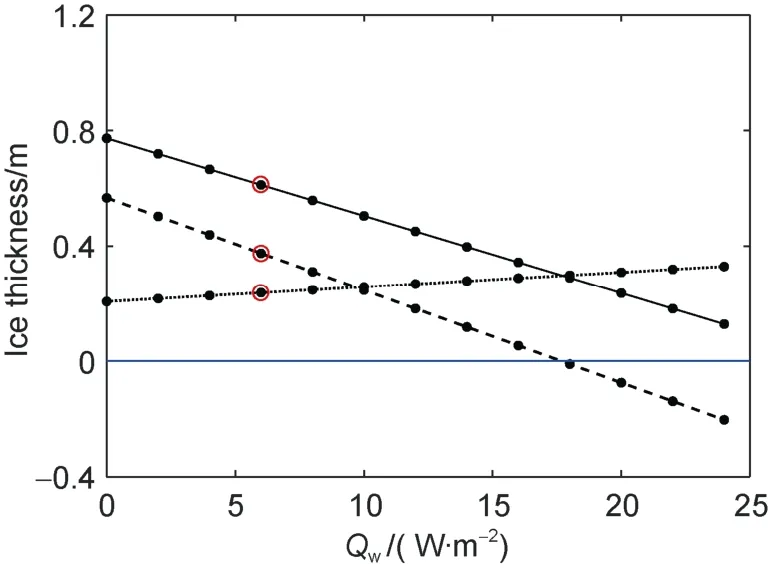
Figure 9 The modelled maximum lake ice thickness (solid line),congelation ice (broken line) and granular ice (dashed line) as a function of Qw applied for the model runs in Lake Orajärvi. The red circle on each line is the validation experiment result. The black dots are Qw applied in model experiments. The zero-reference level is the blue line.
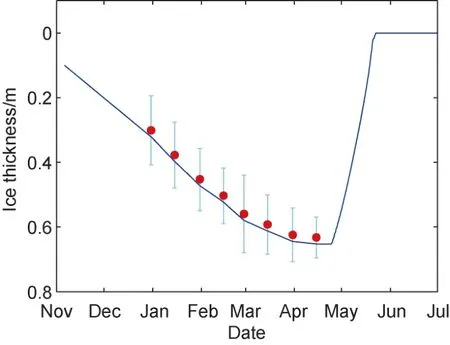
Figure 10 Modelled ice thickness evolution using a constant Qw = 4 W·m-2 during the simulation period in Lake Orajärvi. The red dots are observed 15-day mean ice thickness from 4 successive field campaigns (borehole measurement). The vertical bars are the standard deviations.
3.2.2 Bare lake ice
Model runs without snow for Lake Orajärvi are presented here. This is a virtual scenario and model forcing and initial conditions are the same in section 3.2.1 except snow was zero during the entire simulation period.
Without snow, the modelled maximum ice thickness could reach up to 1.1 m in the case whenQ
= 0 W·mand linearly reduced to 0.6 m whenQ
= 24 W·m(Figure 11).The maximum ice thickness was 30-40 cm thicker than in the case with snow on ice. Increasing by 2 W·msteps seasonalQ
will reduce 4 cm seasonal maximum ice thickness. Compared with snow on ice case, the melting period elongated for 9 d with increasing ofQ
(Figure 12).Because ice reached maximum early without snow and thicker ice need long time to melt.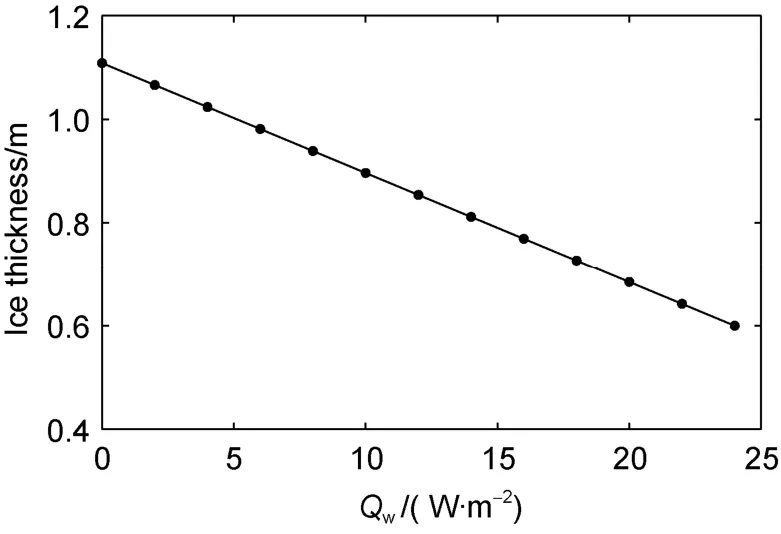
Figure 11 Modelled maximum (solid line) ice thickness versus Qw in Lake Orajärvi without snow. The black dots are Qw applied in model experiments
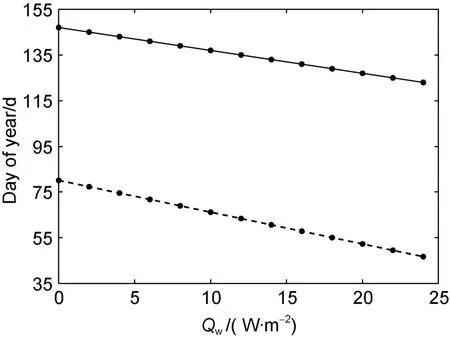
Figure 12 The times when the modelled ice thickness reached the seasonal maximum value (broken line) and the modelled breakup date (solid line) versus different Qw in Lake Orajärvi without snow.
4 Discussion and conclusion
A thermodynamic snow/ice model was employed to investigate the role of lake heat flux on lake ice mass balance. Lake Wuliangsuhai in arid and dry Northeast China and Lake Orajärvi in snowy and humid Finnish Lapland were selected as the study sites. Seasonal model runs were carried through using fixedQ
and the local climatology of mean wind speed, relative humidity,cloudiness, daily mean air temperature, and diurnal solar radiation. For each lake, two scenarios of bare ice and snow-covered ice were investigated.For bare ice, increase ofQ
causes linear decreasing of modelled seasonal maximum ice thickness, and earlier breakup date and timing of maximum ice thickness. Bare ice condition is common in Lake Wuliangsuhai. The model experiments revealed a good agreement of modelled seasonal ice thickness against seasonal mean in-situ observations during 2015-2018 when using a seasonal mean heat flux of 14 W·m. Bare ice condition has never been recorded in Lake Orajärvi. However, if it happens, the seasonal maximum ice thickness would range 1.1-0.6 m in response toQ
changes from 0 to 24 W·m.Snow complicates the role of lake heat flux on ice growth and melt. When a thin snowfall is assumed on top of ice in Lake Wuliangsuhai,Q
is still inversely proportional to the seasonal modelled maximum ice thickness, but with a weak nonlinearity caused by the effect of snow. Snow is thick in Lake Orajärvi, increase of
Q
will linearly reduce the ice growth at ice bottom prompting snow to ice transformation Thus, the date of maximum ice thickness,breakup date and melting days were totally different as compared with a thin snow condition. For Lake Orajärvi,the modelling experiments revealed that a good agreement of the modelled seasonal ice thickness against the climatology when using a seasonal mean heat flux of 4 W·m.The difference in the optimal values of lake heat flux in both lakes is attributed to many aspects. Lake Wuliangsuhai has very rare snowfall events in winter. Even if there was snowfall, snow is often blown away rapidly by strong winds. It is completely in contrast to the situation in Lake Orajärvi, where snow episodes always occur in winter and snow accumulation on lake ice is substantial. Therefore,solar radiation can contribute to the lake heat flux under ice for Lake Wuliangsuhai, while it is most likely not the case for Lake Orajärvi. Additionally, Lake Wuliangsuhai is very shallow compared to Lake Orajärvi, and the transmitted solar radiation through ice can also warm the lake bottom sediment further increasing the heat flux from water to ice.All these factors result in a higher climatological lake heat flux in Lake Wuliangsuhai (14 W·m) than in Lake Orajärvi (4 W·m).
The timing of maximum ice thickness and ice break-up dates became earlier with increasingQ
in the two lakes.This phenomenon is not affected by the snow conditions,but, however, both dates with snow on lake ice are delayed compared with snow-free cases. On one hand, snow insulates the heat exchange between cold air and ice,postponing the forming of columnar ice. On the other hand,the process of snow to ice transformation creates granular ice that needs time to develop so that the timing of the maximum ice thickness may be postponed.The numerical modelling experiments have some simplifications to highlight the role of the heat flux from lake water to ice bottom. In reality, the ice-water interaction is more complicated, in particular during freezing up and breakup stages. The coupled snow/ice thermodynamic model and hydrological lake model can provide deeper insights into the ice-water interaction. The local difference on solar radiation, cloud and snow condition, as well as morphology of lake are important factors generating differences of ice thermodynamics and lake heat flux between these two lakes. To quantify their impacts,long-term and high quality in situ observations on radiative fluxes, surface albedo, precipitation, snow depth, and lake limnology of under-water eddy flux, annual water temperature and bottom sediment are very important to better understand the role of lake heat flux in the growth and melting of ice. Those are planned joint studies between China and Finland for the future.
Acknowledgements
This research was supported by the Academy of Finland (Grant nos. 317999/Cheng; 333889/Leppäranta), the National Natural Science Foundation of China (Grant nos.51979024, 41876213), the Open Fund of State Key Laboratory of Coastal and Offshore Engineering(Grant no. LP2106), the Fundamental Research Funds for the Central Universities (Grant no. DUT20GJ206). We appreciate two anonymous reviewers and Guest Editor Dr. Ruibo Lei for their constructive comments and suggestions for revising the paper杂志排行
Advances in Polar Science的其它文章
- The rise of sea ice research collaboration between China and Finland
- Early glaciological and Quaternary Geology cooperation
- Physics of Arctic landfast sea ice and implications on the cryosphere: an overview
- An overview of Antarctic polynyas: sea ice production,forcing mechanisms, temporal variability and water mass formation
- Observation and modelling of snow and sea ice mass balance and its sensitivity to atmospheric forcing during spring and summer 2007 in the Central Arctic
- An observational study of precipitation types in the Alaskan Arctic
