Variation of Antarctic marginal ice zone extent(1989-2019)
2021-08-19WANGMiaojiangLIUTingtingYANGZijianWUBingZHUXueming
WANG Miaojiang, LIU Tingting, YANG Zijian, WU Bing &ZHU Xueming
1 Changzhou Xinbei Natural Resources and Planning Technical Support Center, Changzhou 213001, China;
2 Chinese Antarctic Center of Surveying and Mapping, Wuhan University, Wuhan 430072, China
Abstract The Antarctic marginal ice zone (MIZ) is the transition region between open water and consolidated pack ice,which is defined as an area with 15%-80% sea ice concentration. The MIZ represents the outer circle of Antarctic sea ice and the biological activity circle of Antarctic organisms, which provides a direct indication of the extent of Antarctic sea ice. In this study, the joint total variation and nonnegative constrained least square algorithm are applied to retrieve the Antarctic MIZ extent based on passive microwave data sets from 1989 to 2019. The spatial and temporal variations of the Antarctic MIZ extent and five regions are analyzed. The results show that the Antarctic MIZ extent follows a strong monthly variation pattern,decreasing from November to February and increasing from March to October. The annual MIZ extent is largest in the Weddell Sea and smallest in the Western Pacific Ocean. The edge of the sea ice begins to form a closed ring in May, which eventually closes near the Antarctic Peninsula. The ring width variation is large in summer, but generally stabilizes between 350 and 370 km in winter. The average latitude of the Antarctic MIZ is relatively stable in summer, but changes substantially in winter with a difference of approximately 3°. In October, the lowest mean latitude of the MIZ can reach 64.35°S. The sea surface pressure, 2-m temperature, and 10-m wind speed are negatively correlated with the MIZ extent variation, among which the second-order partial correlation coefficient of the sea surface pressure and MIZ extent is -0.8773 in the Western Pacific Ocean.
Keywords Antarctic marginal ice zone, passive microwave data, retrieval algorithm, correlation analysis,variation
1 Introduction
Antarctic sea ice has not dramatically changed since the first satellite data recordings, except for a record low in 2017 (Comiso et al., 2017; Parkinson, 2019). However, very few observational studies of the Antarctic marginal ice zone(MIZ) have been reported (Paul et al., 2021). The MIZ is defined as the sea ice cover near the open water (OW)boundary, extends from the OW to the dense floating ice zone, and is vulnerable to waves (Wadhams, 1986). The MIZ is a highly dynamic area of sea ice cover located in the transition region between the OW and consolidated pack ice(Stroeve et al., 2016). Most studies have used a range of 15%-80% sea ice concentration (SIC) to distinguish the MIZ (Strong et al., 2013; Aksenov et al., 2017; Rolph et al.,2020). For example, Strong and Rigor (2013) assessed MIZ changes in the Arctic using the SIC defined as 15%-80%,and matched the results with the upper SIC limit of the Arctic MIZ map drawn by the National Ice Center (NIC).Stroeve et al. (2016) used passive microwave data from 1979 to 2014 to assess the changes and trends in the Antarctic MIZ, pack ice, and coastal polynyas, and their effects on the breeding of Antarctic snow petrels.Nonetheless, higher-precision data of the MIZ extent are required. The MIZ is a mixture of sea ice and OW owing to its unique sea ice ratio. Previous studies have shown that in low-SIC regions, the accuracy of SIC algorithms (e.g.Bootstrap, NT, NT2) that rely only on the brightness temperature information of passive microwave data can be further improved (Knuth and Ackley, 2006; Ivanova et al.,2014; Beitsch et al., 2015).
The Antarctic MIZ is particularly sensitive to changes of the atmosphere and oceans. In the Antarctic, wave action can penetrate into the floating ice over distances of hundreds of kilometers, and the cracks caused by waves can lead to the formation of small circular floating ice (Kohout et al., 2014). The MIZ therefore generally consists of thin ice spread over a wide area (i.e., hundreds of km) and small isolated pockets of thicker floating ice in a stationary state.Under the influence of strong ice surface winds and wave activities, the MIZ tends to squeeze together and shrink into a compact ice edge. Smaller ice floes are associated with more fluid, and the ice conditions in the MIZ vary acutely with changes of the wind and ocean conditions because strong downdraft winds tend to flow down the Antarctic Plateau. Newly formed sea ice is constantly pushed away from the Antarctic continent, which also affects the outer edge of the MIZ, thus leading to an increase in the overall sea ice extent (SIE) in specific areas around the Antarctic continent (Morales Maqueda et al., 2004).
The study of the Antarctic MIZ is of great scientific value and research significance. The location of the MIZ provides a physical buffer to the dense interior sea ice area and largely protects it from the impact of waves (Squire, 2020). The breadth and variability of the MIZ are important driving forces for the marine habitat selection of diverse biota (Post et al.,2013; Williams et al., 2014), such as the Antarctic minke whale(Williams et al., 2014). Changes in the MIZ can also affect human activities; for example, the crushed ice of the MIZ is more navigable than dense internal floating ice (Stephenson et al., 2011; Schmale et al., 2013; Rogers et al., 2013).
In this study, MIZ information is obtained using the joint total variation with the nonnegative constrained least square algorithm (NCLS-TV), which contains the spatial and brightness temperature information of the sea ice and OW. The temporal and spatial variations of the MIZ extent in Antarctic and five regions were analyzed using passive microwave data sets from 1989 to 2019. Correlation analysis was performed between the MIZ and external environmental parameters, including the sea surface pressure, 2-m air temperature, and wind field data.
2 Data and methods
2.1 Satellite data, reanalysis data, and study area
Considering the temporal coverage and spatial resolution of the available data, this study selected the Special Sensor Microwave/Imager (SSM/I) and Special Sensor Microwave Imager Sounder (SSMIS) data from January 1989 to December 2019, the Advanced Microwave Scanning Radiometer for the Earth Observing System (AMSR-E)data from June 2002 to October 2011, and the Advanced Microwave Scanning Radiometer 2 (AMSR2) data from July 2012 to December 2019. All of the data are of L3-level brightness temperature provided by the National Snow and Ice Data Center (NSIDC), which were projected onto the Antarctic polar stereographic grid. Pixel-area grids provided by the NSIDC were also used to calculate the Antarctic MIZ extent.
The sea surface pressure, 2-m temperature, and 10-m wind speed data were measured using ERA5 data from the European Centre for Medium-Range Weather Forecasts’global reanalysis product. The ERA5 reanalysis data combine model and observational data from around the world through data assimilation, using the laws of physics to form a globally complete and consistent data set. The three kinds of reanalysis data were resampled with the same spatial resolution as the MIZ results, projected onto the Antarctic polar stereographic grid, and translated into monthly data from 1989 to 2019.
The study area was divided into five regions: the Indian Ocean (20°E-90°E); Western Pacific Ocean(90°E-160°E); Ross Sea (160°E-130°W), Amundsen Sea(130°W-120°W); and Weddell Sea (120°W-20°E)(Cavalieri and Parkinson, 2008). The five specific regions of the Antarctic are shown in Figure 1.
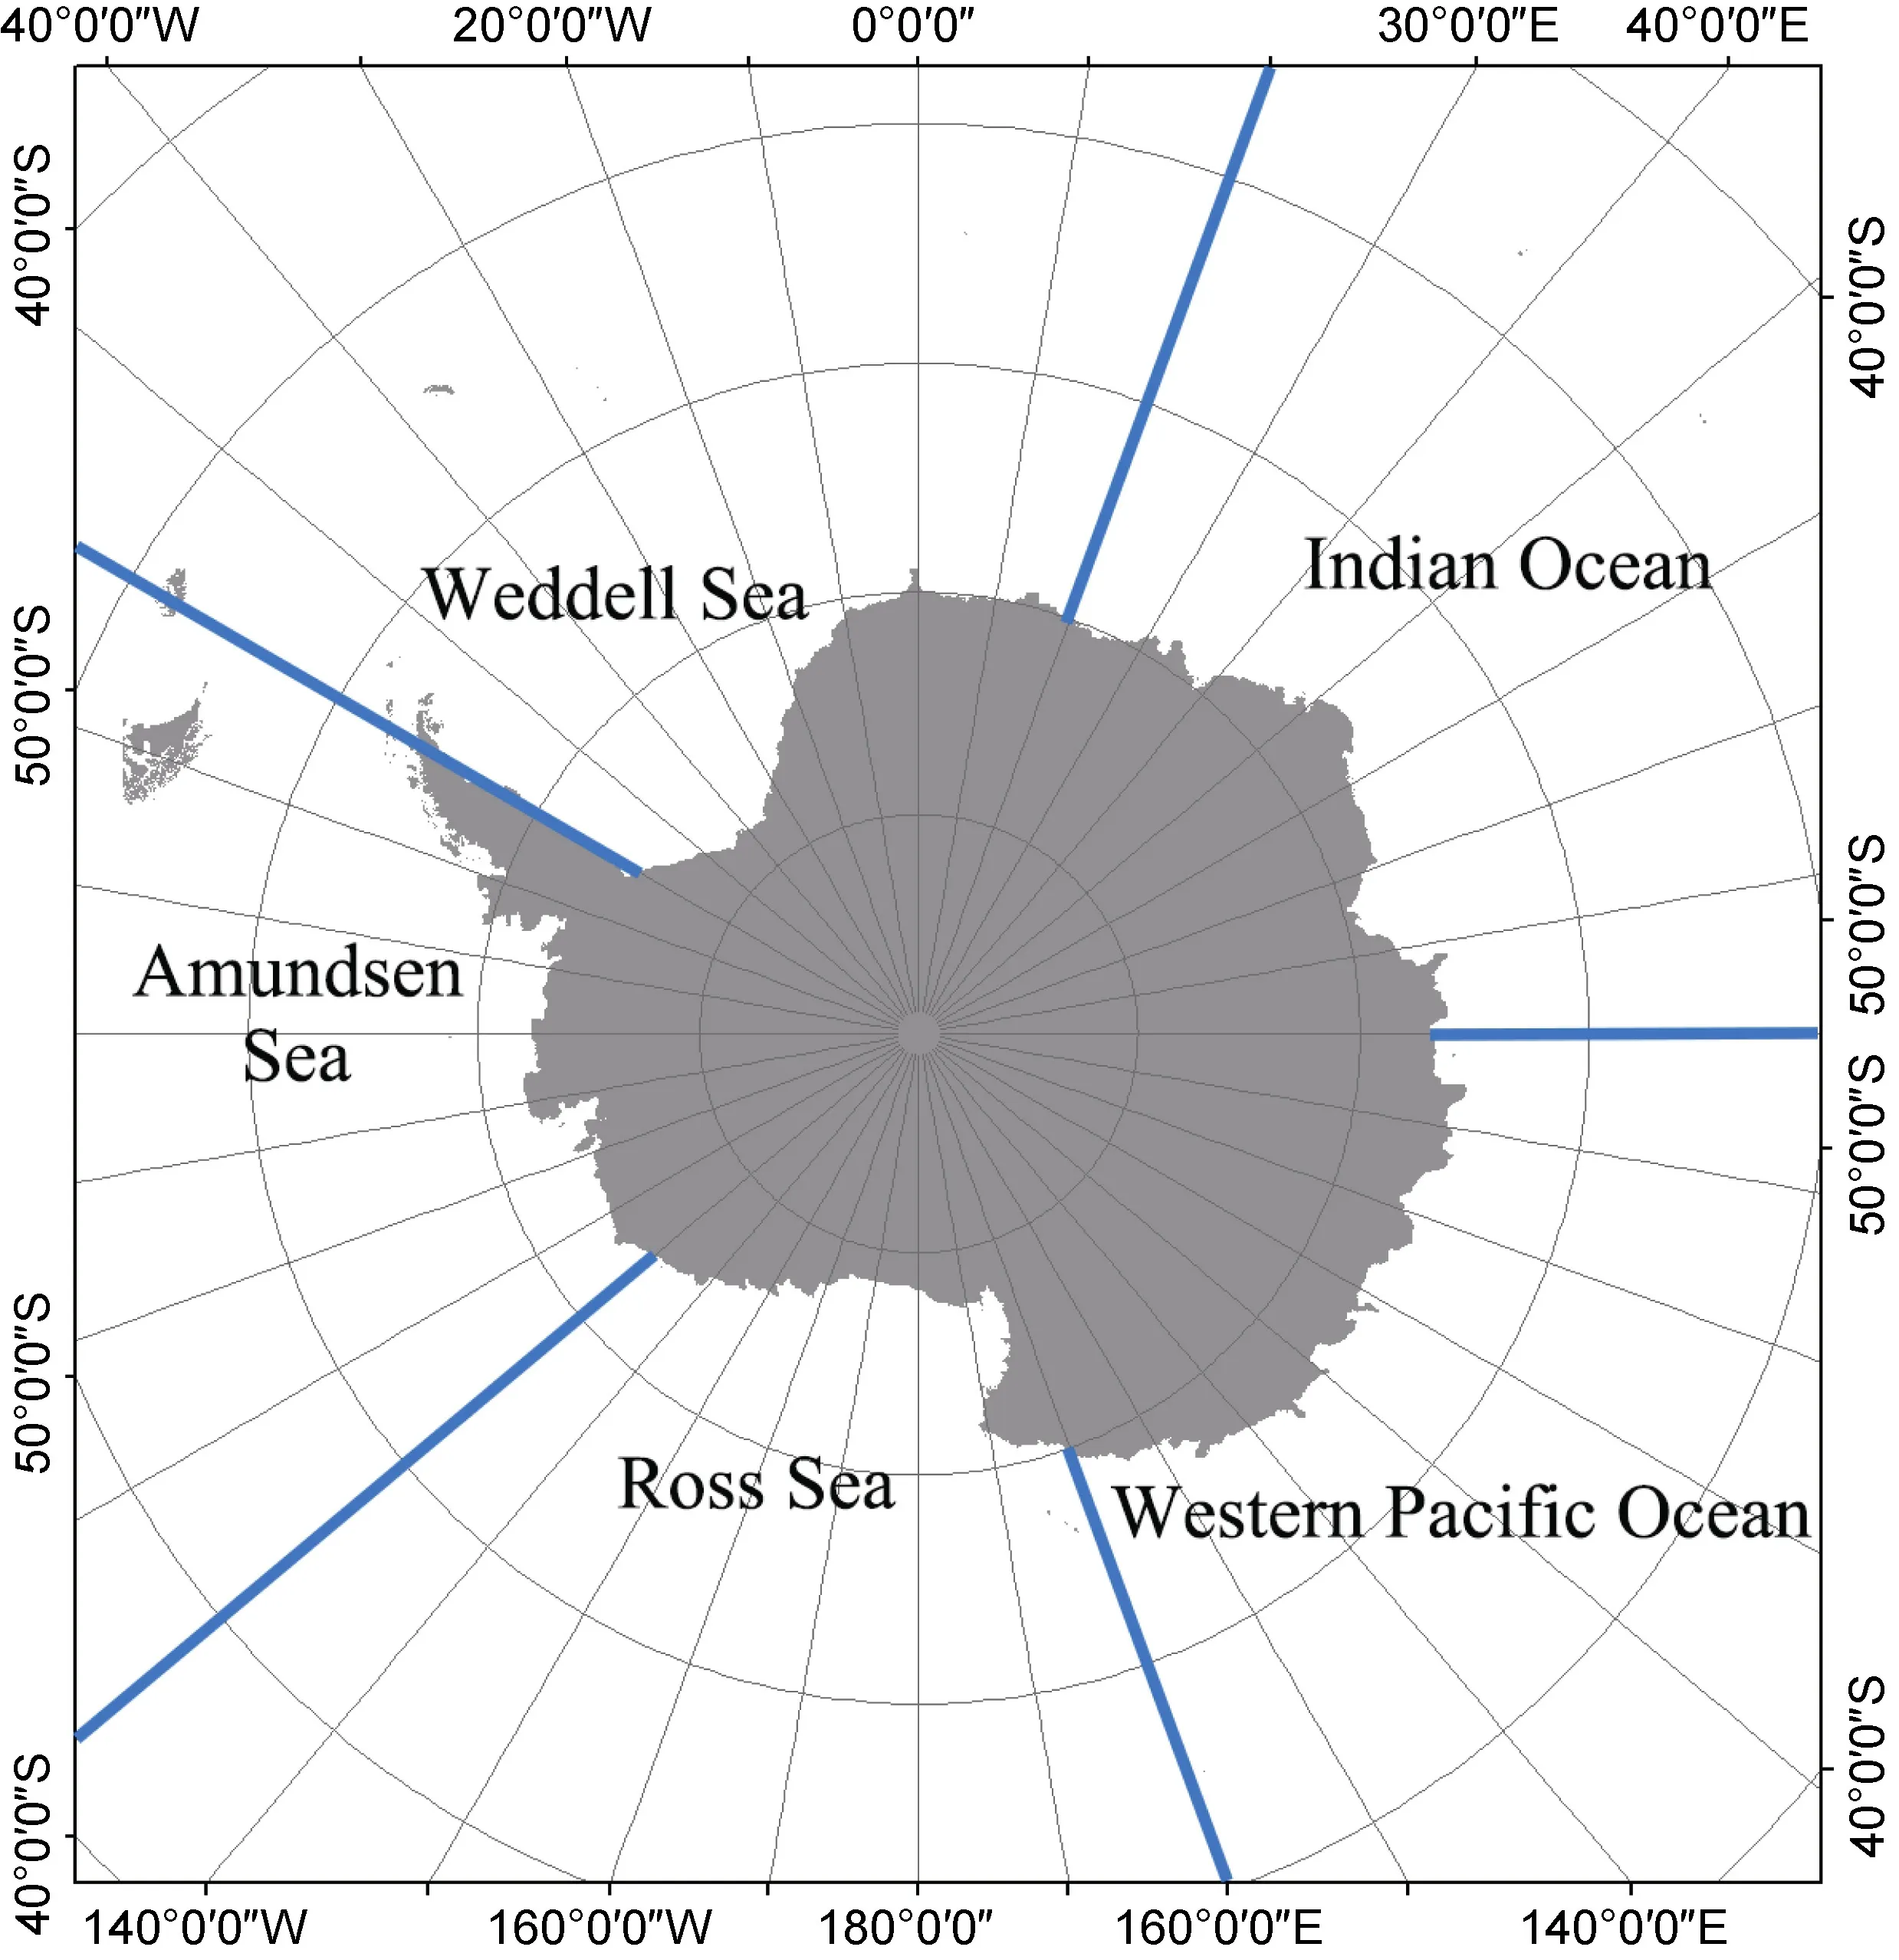
Figure 1 Distribution map of the five investigated regions in the Antarctic.
2.2 MIZ retrieval method
The NCLS-TV algorithm transforms the calculation of a single pixel into an optimization solution process of neighborhood pixel combinations during the SIC retrieval process. Differing from other SIC algorithms that only rely on the brightness temperature difference between the sea ice and OW in various bands of passive microwave data to solve the SIC, the NCLS-TV promotes smooth piecewise transitions for the SIC of adjacent pixels to strengthen the spatial relationship between the sea ice and OW in homogeneous regions (Iordache et al., 2012). The effectiveness on the SIC retrieval was improved by Liu et al.(2021). The NCLS-TV algorithm model is given as:

A
represents the tie points,Y
is the passive microwave data,X
is the SIC results, andTV
(X
) and λrepresent theTV
regularizer and its weight, respectively.The NCLS-TV algorithm can then be solved by variable separation and the augmented Lagrange method (Eckstein and Bertsekas, 1992; Iordache et al., 2012).The daily SIC results for the past 30 years were obtained using the NCLS-TV algorithm based on the passive microwave data from 1989 to 2019. A MIZ threshold of 15%-80% was used to determine the daily MIZ distribution. It is worth noting that the MIZ should be on the periphery of the overall sea ice distribution, but 15%-80% of the SIC may also be on the interior of the sea ice distribution, such as the inner polynya (Aksenov et al.,2017). Normal distribution statistics of the latitude were therefore carried out for the initial MIZ, and the scattered distribution points with higher dimensions were removed.
The average daily and monthly extents of the Antarctic MIZ from 1989 to 2019 were calculated using the corresponding Antarctic pixel-area grids based on the MIZ results without the inner polynya. The calculation formula is given as:

MIZ
represents the SIE of the MIZ,C
represents the SIC of thei
pixel, andPA
represents the field area of the corresponding pixel, which varies from pixel to pixel owing to projection deformation.2.3 Correlation analysis method of the MIZ and reanalysis data
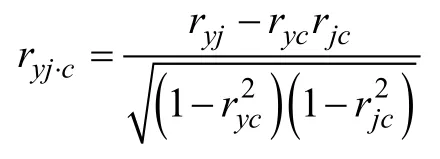
Simple correlation analysis and the second-order partial correlation coefficient method were applied to analyze the correlation between the MIZ results and three environmental factors. Simple correlation analysis refers to the influence of a single factor on the MIZ using the Pearson correlation coefficient calculation method. The correlation coefficients ofX
andY
can be calculated according to:


3 Temporal and spatial variation of Antarctic MIZ
This section analyzes the temporal and spatial variation of the Antarctic MIZ extent. Different passive microwave data were used in the temporal analysis to increase the time continuity, but the differences between the various data are not discussed in great detail. The annual growth and ablation of the MIZ in the Antarctic were analyzed from a spatial perspective, and the variations of the longitude and latitude of the MIZ were also analyzed at different times.
3.1 Analysis of temporal variation of Antarctic MIZ
The average daily, monthly, and annual MIZ extents from 1989 to 2019 were obtained according to the passive microwave data from 1989 to 2019 and the MIZ retrieval method. The annual variation of the entire Antarctic MIZ extent from 1989 to 2019 is shown in Figure 2.
Figure 2 shows that the overall change trend of the Antarctic MIZ extent slowly increased and in a wave-like manner from 1989 to 1998. However, the MIZ extent changed little from 1998 to 2008. It began to increase from 2008 to 2012, decreased over the following two years until 2013, and then continued to grow until 2017, after which the trend then began to slow again. The MIZ extent results of the AMSR2 data are consistent with those of the SSMIS data,and the MIZ extent followed an initially increasing and then decreasing trend from 2012 to 2019. The AMSR-E data are only available until October 2011, thus the monthly average MIZ results of the AMSR-E data slightly differ from those of the SSMIS data. In other years, the monthly average MIZ results of the AMSR-E data are consistent with the SSMIS data, and the monthly average MIZ extent shows an increasing trend from 2002 to 2011. From 1989 to 2019, the maximum monthly average extent of the Antarctic MIZ was 5.45 × 10kmin October 2011, and the minimum was 0.58 ×10kmin February 2017. The spatial resolutions of the SSM/I and SSMIS data and AMSR-E and AMSR2 data in Figure 2 are 25 and 12.5 km, respectively. The different imaging modes and parameters between the different sensors may therefore lead to differences in the MIZ results.
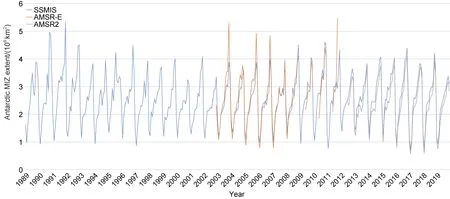
Figure 2 Annual variation of the Antarctic MIZ extent from 1989 to 2019. The blue, orange, and gray curves represent the SSM/I and SSMIS MIZ results, AMSR-E MIZ results, and AMSR2 MIZ results, respectively.
The Antarctic MIZ extent variation shows a notable seasonal effect, as indicated in Figure 2. The Antarctic sea ice melts and grows, and its extent shrinks and expands throughout a single year. The Antarctic summer is generally divided into November-March, whereas the sea ice growth continues in winter from April to November(Kern et al., 2019). The Antarctic MIZ extent also exhibits increasing and decreasing changes over a single year. To specifically analyze the monthly changes of the Antarctic MIZ, the monthly average extent of the Antarctic MIZ from 1989 to 2019 was calculated and divided into the five regions. The detailed changes and MIZ extent results are listed in Table 1.
Table 1 shows the monthly average MIZ extent from 1989 to 2019 and calculates the monthly average MIZ extent over the entire Antarctic and five regions. From January to February, the MIZ extent in the entire Antarctic,Weddell Sea, Ross Sea, Indian Ocean, and Amundsen Sea all decreased, whereas that in the Western Pacific Ocean remained unchanged (Table 1). The whole Antarctic MIZ extent decreased by 0.56 × 10km, whereas the Indian Ocean area decreased by 0.02 × 10km. From March to November, the MIZ range continued to increase, reaching a maximum of 3.77 × 10kmin November. The growth rate of the MIZ extent was larger from February to April,smaller from April to October, and larger again from October to November. The MIZ range remained unchanged in December. However, the changes of the other five regions differed from March to December. The specific changes are more directly shown in Figure 3.
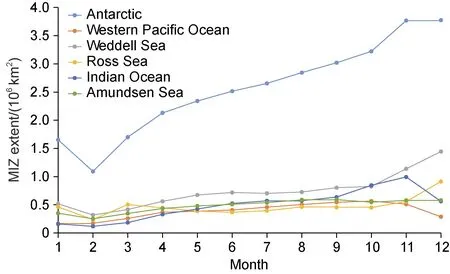
Figure 3 Monthly average MIZ extent variation of the entire Antarctic and five regions from 1989 to 2019.
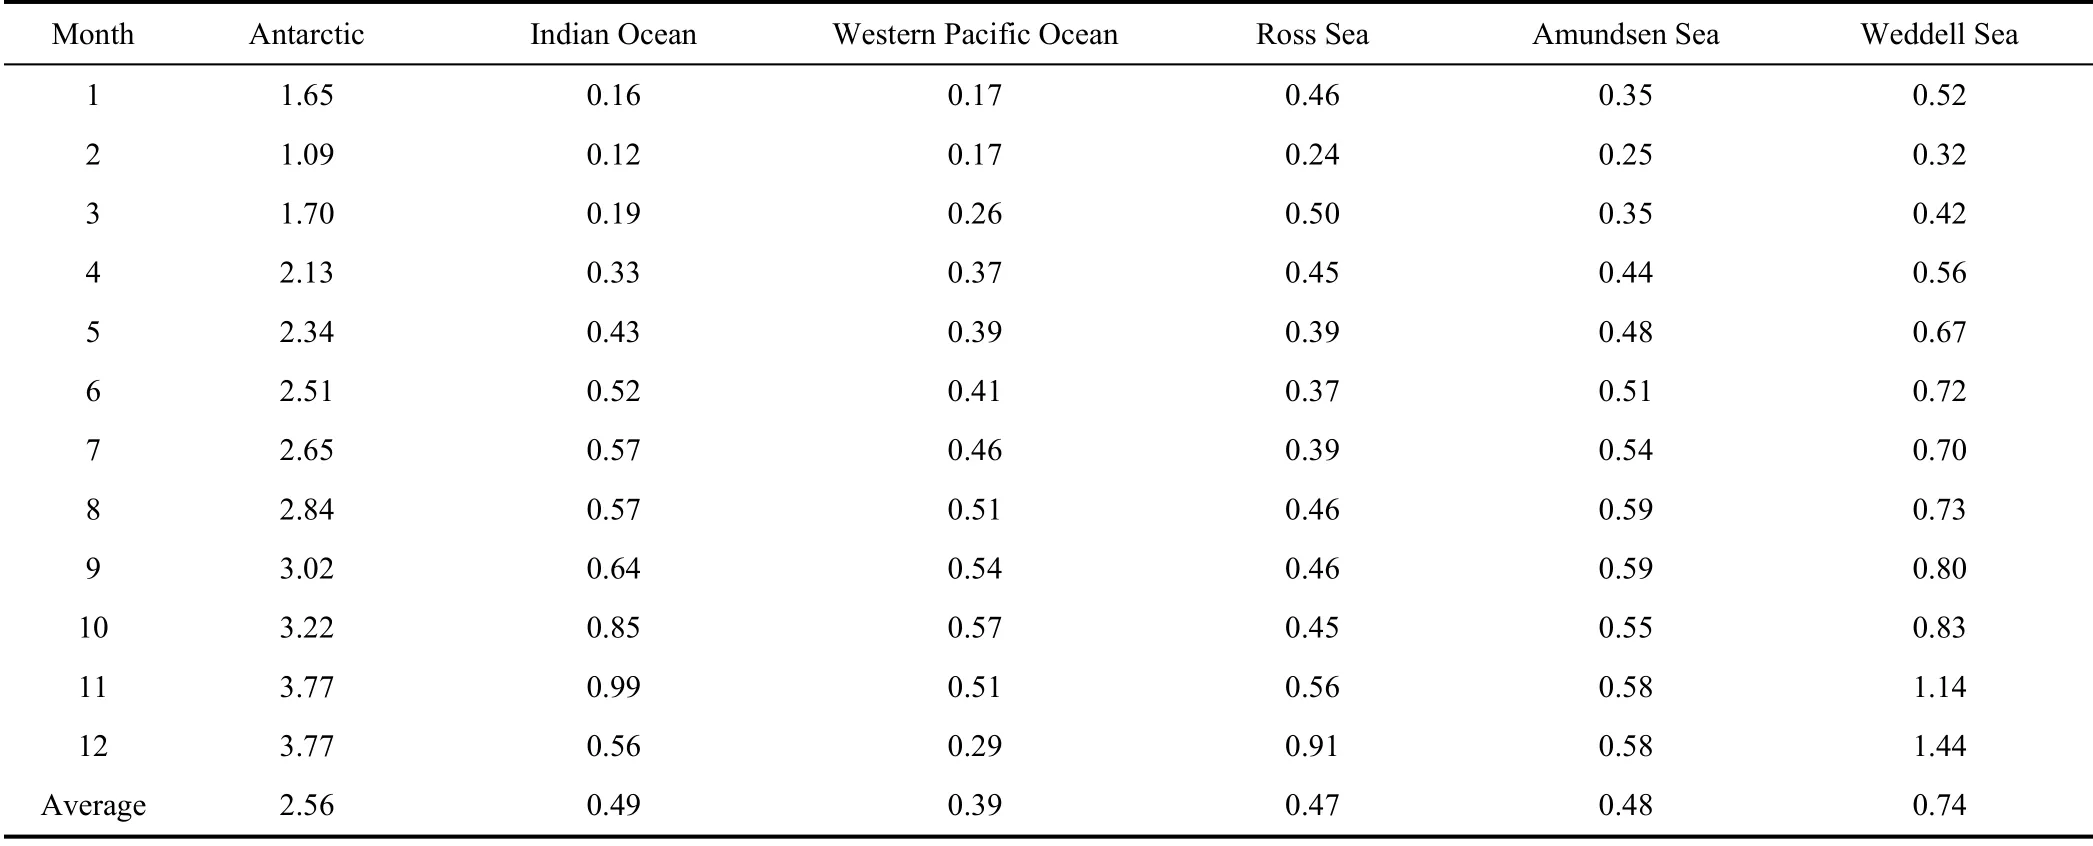
Table 1 Monthly average MIZ extent of the Antarctic and five investigated regions from 1989 to 2019 (unit: 106 km2)
Figure 3 shows that the MIZ extent in the Western Pacific Ocean increased from February to 0.57 × 10kmin October, with a fast growth rate from February to April,whereas the extent decreased from October to December.The growth rate of the Weddell Sea MIZ extent gradually slowed in March, April, May, and June. In July, the MIZ extent decreased by 0.02 × 10km, then began to grow again until December, increasing rapidly in October and November. In the Ross Sea, the MIZ extent increased by 0.26 × 10kmfrom February to March, gradually decreased to 0.37 × 10kmin June, and then increased for two months, decreased for two months, and then increased again from October to December. The MIZ change in the Indian Ocean is relatively simple. The MIZ extent increased from March to November, during which the growth rate was fast from September to November and strongly decreased from November to December to 0.43 × 10km.The variation of the MIZ extent in the Amundsen Sea was relatively small, with a slow increase from March to September, a decline from September to October, and a gradual increase from October to December. The Weddell Sea showed the largest annual average MIZ extent among the entire Antarctic and five regions, with an annual mean of 0.74 × 10km. The Western Pacific Ocean had the smallest result (0.39 × 10km), and the remaining regions did not show substantial differences.
In summary, the Antarctic MIZ extent generally reaches its lowest value in February and tends to increase from March to October. However, the Antarctic sea ice reaches its lowest value in March and maximum value in October. It is therefore possible that when the Antarctic sea ice reaches its maximum, the Antarctic sea ice begins to melt and the hard inner sea ice turns into MIZ, resulting in a continuous increase of the MIZ extent. When the MIZ melts to its minimum extent, further melting of Antarctic sea ice causes more sea ice to convert to the MIZ, resulting in growth of the MIZ extent already in March.
The effects of the ocean wind field and wave impacts differ between the different geographical locations. The growth of the MIZ extent is slightly different, but the overall trend is still increasing. In October-December, the Antarctic sea ice begins to melt and the MIZ extent begins to decrease, whereas the starting time of the MIZ extent decrease differs in each sea area.
3.2 Analysis of the spatial variation of the Antarctic MIZ
A separate discussion of the five regions of the Southern Ocean allows the MIZ variation to be roughly obtained in the different regions. However, the MIZ variation within each sea area also requires further analysis. The Antarctic MIZ extent exhibits notable growth and decline stages throughout the year, as shown in the analysis in section 3.1.The distribution maps of the MIZ in the Antarctic in February, May, September, and November during the MIZ growth process are therefore selected, as shown in Figure 4.
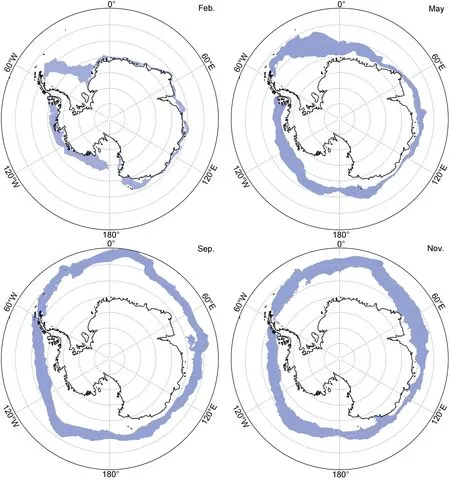
Figure 4 Monthly average Antarctic MIZ extent distribution maps of February, May, September, and November. Blue represents the distribution of the Antarctic MIZ and black is the Antarctic continental coastline.
As shown in Figure 4, the MIZ extent reached its lowest value in February, and the MIZ was mainly distributed in the Weddell Sea, Ross Sea, and Amundsen Sea, which are near the Antarctic continent. From a perspective above the South Pole, 80% of MIZ is distributed in the interval between 20°W counterclockwise to 160°E. During the sea ice growth season, the MIZ variation in February, May, and September gradually diffused outward and formed a closed ring to enclose the Antarctic continent and high-SIC sea ice in the interior. In May, the MIZ of the other sea areas was far from the Antarctic continent except that the MIZ of the Antarctic Peninsula did not completely close and the latitude of the MIZ extent in the Ross Sea reached ~73°S. The latitude of the MIZ range reached 60°S in September when the sea ice growth reached its maximum, and the MIZ extent in the Weddell Sea expanded to approximately 55°S.
November is the Antarctic sea ice melting season, and the latitude of the entire MIZ decreased compared with that in September. The MIZ extent basically shrunk to within 60°S in the Indian Ocean and Western Pacific Ocean.However, the MIZ extent was 0.75 × 10kmlarger than that in September owing to the sea ice melting period.Although the Antarctic sea ice begins to shrink to the Antarctic continent, the melting of the sea ice also leads to more sea ice areas with high SIC turning into MIZ. During the melting season, the MIZ extent initially shrinks from the Antarctic Peninsula, Western Pacific Ocean, and Indian Ocean, and such melting continues until March of the following year. From March to April, the Antarctic sea ice begins to grow and the extent of the sea ice expands outward, but the MIZ extent may decrease. This is because sea ice growth leads to more MIZ regions becoming high-SIC regions.
(1) Analysis of longitude variation of Antarctic MIZ extent
The above analysis indicates a strong difference of the longitude and latitude variation in the Antarctic MIZ, which can be more intuitively shown using statistical analysis. The latitude and longitude variation of the Antarctic MIZ extent is therefore analyzed in detail.
The variation of the MIZ extent with longitude in Figure 5 can be obtained by quantifying the MIZ extent at each longitude. The longitude distributions of the monthly average MIZ in February, May, September, and November are analyzed as examples in Figure 5.

Figure 5 Monthly average Antarctic MIZ extent variation with longitude in February, May, September, and November. The black line shows the position of the Antarctic continent. The pink region indicates the magnitude of the MIZ extent in the longitude direction.
Figure 5 shows that the distribution of the MIZ extent was uneven in February when the MIZ extent reached the annual low, whereas the MIZ extent in the Ross Sea,Amundsen Sea, and Weddell Sea was large. In May, the MIZ extent in the Indian Ocean and Western Pacific Ocean began to increase, and the MIZ began to form a closed ring around the Antarctic continent. Sea ice growth also gradually stabilized the entire rim width of the sea ice. In particular, the average MIZ extent per longitude reached 9894.62 kmin September when the sea ice growth was nearing its end, representing an increase of 2431.24 kmcompared with that in February (7463.38 km). The Antarctic MIZ extent continued to increase after November when the Antarctic sea ice began to melt. However, the variance of the MIZ extent with longitude increased, which was manifested by the uneven MIZ extent distribution with longitude in the melting season.
To obtain a more direct understanding of the unbalanced Antarctic MIZ extent distribution with longitude,the width of the Antarctic MIZ ring was analyzed and line charts were calculated for the monthly average Antarctic MIZ width change with longitude over a 12-month period,as illustrated in Figure 6.
Figure 6 shows that the MIZ width was relatively stable in the Antarctic winter, but varied greatly with longitude in summer. During the first four months of a given year, the MIZ width in the direction of 60°W-0° was larger than that of the rest, with an average width of 500 km.The maximum MIZ widths in February, May, September,and November were also within this longitude range,yielding 1681.79, 999.30, 1082.44, and 1068.17 km,respectively, which are located in the Weddell Sea. In May and June, the difference of the MIZ width in each longitude direction gradually decreased by average values of 365.40 and 373.01 km, respectively, and continued to stabilize to 356.29, 357.83, and 374.40 km in July, August, and September, respectively. In October, there was a certain increase in the MIZ width between 60°E-90°E possibly owing to the passage of sea ice from the Amery ice shelf to the Indian Ocean. During the same period, the MIZ width decreased at 60°W longitude, which is closer to the land of the Antarctic Peninsula. The MIZ width in the Weddell Sea in November was larger than that in October, while the MIZ width in the other longitude directions changed little,indicating that the sea ice in the Weddell Sea begins to melt first. In December, the MIZ width in the longitude direction significantly increased except for the 60°W and 90°E-160°E areas. The MIZ width in the Western Pacific Ocean (90°E-160°E) was relatively small and stable throughout the year, indicating a lower sea ice distribution in this region.
(2) Analysis of latitude variation of Antarctic MIZ extent
The longitude variation of the Antarctic MIZ represents the difference in the natural environmental state of each sea area, whereas the latitude variation represents the sea ice growth and melting process. The monthly average latitude of the Antarctic MIZ region from 1989 to 2019 was calculated. Owing to the strong geographical characteristics of the MIZ distribution that roughly cover the same latitude, the distribution results of MIZ were obtained according to the SIC results from the passive microwave data of each month and the latitude distribution was statistically analyzed. The results show a normal MIZ latitude distribution, especially in winter. The MIZ width in winter was smaller and more stable than that in the sea ice melting season. The error values beyond 3σ
of the normal latitude distribution of the MIZ may represent interglacial lakes and OW near the Antarctic continent and were therefore excluded. The MIZ latitude distribution was then averaged after removing the polynyas to obtain the monthly average Antarctic MIZ latitude variation from 1989 to 2019,as shown in Figure 7.

Figure 6 Variation of the monthly average width of the Antarctic MIZ with longitude. The monthly average MIZ width graphs of the 12 months have the same axes with abscissa at -180° to 180°, where the negative symbol “-” represents west longitude (“W”). The ordinate is the MIZ width (km). The blue curves show the variation trends of the Antarctic MIZ width with longitude.
Figure 7 shows that the average Antarctic MIZ latitude is comparatively stable over time. However, the average MIZ latitude substantially changed from 1989 to 1991. The maximum and minimum average MIZ latitudes were 69.73°S in February 1989 and 62.55°S in October 1989,indicating that the outer expansion and inner contraction of the MIZ were quite drastic in 1989. From 1992 to 1995, the average MIZ latitude was higher than that of previous years,indicating that the distribution of the entire Antarctic MIZ shrank toward the South Pole in these three years, and that the MIZ extent may be decreasing, which is consistent with the change of MIZ extent in 1992-1995 shown in Figure 2.In the following years, the maximum average MIZ latitude in September 2012 was 65.22°S, which was lower than that in September of the other years. This indicates that the maximum SIE value in September was smaller than that in other years and that the overall SIE was also smaller.

Figure 7 Variation of the monthly average Antarctic MIZ latitude from 1989 to 2019. The abscissa represents the year date, and the ordinate represents the south latitude (°S).
The average Antarctic MIZ latitude also shows a notable variation trend over a given year, generally decreasing with extension of the MIZ extent and increasing when it shrinks. Specifically, the average MIZ latitude increased from January to February and decreased with increasing MIZ extent from March to October. The average MIZ latitude began to increase again in November and December. There are also individual years in which the mean latitude continued to decrease to November. For example, the MIZ in 2005 expanded by 0.09°S to a low latitude from October to November.
The average Antarctic MIZ latitude varied in different months, which is related to the growth and melting of sea ice. The monthly average latitude variation chart of each month over 31 years was calculated (Figure 8) to more clearly compare the inter-annual variation of the average Antarctic MIZ latitude in the different months from 1989 to 2019.
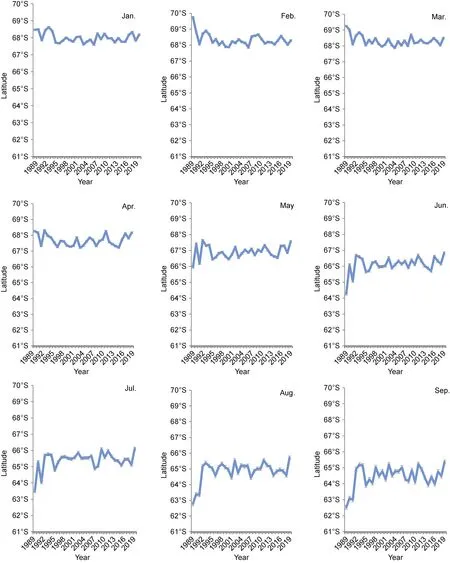

Figure 8 Monthly average latitude variations of the Antarctic MIZ from 1989 to 2019. The monthly graph of the change of each average latitude is unified with the maximum ordinate value. The unit is south latitude (°S), the abscissa is the year, and the blue curves represent the average latitude changes.
The monthly average MIZ latitude between 1989 and 2019 varied greatly, as shown in Figure 8. Except for November, December, and January, the average latitude fluctuation of almost every month in the first two years was higher than that of the other years, which is consistent with the results shown in Figure 7 when the average latitude fluctuation in the first two years was also large. It can be concluded that from January to December, the average MIZ latitude in the Antarctic initially increased, then decreased,and then increased again, as shown by the average position of the blue curves in each month. This also confirms that the Antarctic MIZ extent underwent a decrease-increasedecrease trend. The average latitude in November,December, January, and February was 64.82°S, 66.39°S,68.01°S, and 68.34°S, respectively, which indicates an increase of the mean MIZ latitude. During these months, the average position of the MIZ moves closer to the Antarctic continent, the SIE shrinks, and the Antarctic sea ice melts.The average MIZ latitude in the remaining months decreased from February until reaching the lowest value of 64.35°S in October, and the MIZ extent stopped expanding.
The inter-annual variation of the mean MIZ latitude varies in the different months. During the Antarctic summer of November-March, the sea ice undergoes a melting stage but the mean MIZ latitude is relatively stable. This indicates that the MIZ latitude distribution is more concentrated and the distribution variance is smaller during the melting season. In other months during the sea ice growth stage, the MIZ extent expands and the annual Antarctic climate and ocean movement conditions are different, leading to a large change in the MIZ latitude distribution. The difference of the average latitude in June-October therefore reaches approximately 3° (Figure 8). The average MIZ latitude slowly increases with progressive years in October and November, when the Antarctic MIZ reaches its maximum value.
4 Influence of sea surface pressure,temperature, and wind field on the Antarctic MIZ extent variation
The variation of Antarctic MIZ extent is sensitive to both atmospheric and oceanic forcing (Stroeve et al., 2016), and is the result of a combination of multiple environmental factors. In this section, the monthly mean Antarctic sea surface pressure, 2-m air temperature, and 10-m wind speed data from 1989 to 2019 were used to conduct simple correlation analysis and second-order partial correlation coefficient analysis on the Antarctic MIZ.
4.1 Simple correlation analysis
Figure 9 shows the monthly sea surface pressure, 2-m temperature, and 10-m wind speed of the Antarctic, Western Pacific Ocean, Weddell Sea, Ross Sea, Indian Ocean, and Amundsen Sea from 1989 to 2019. The lowest sea surface pressure in the Antarctic was 979.25 hPa in October 1999,the highest pressure was 996.66 hPa in April 2007, and the average was 988.03 hPa. Among the five investigated regions, the maximum monthly sea surface pressure was 1006.39 hPa in the Amundsen Sea in May 2002 and the minimum was 970.64 hPa in the Weddell Sea in June 2015.Only the Indian Ocean showed an upward trend with a slope of 0.01 hPa·month. The Weddell Sea had the lowest monthly 2-m temperature of -5.89℃, and the Amundsen Sea had the highest monthly 2-m temperature of -0.56℃.The lowest 2-m temperature was -15.25℃ in the Weddell Sea in July 1994. The 10-m wind speed data were calculated from the eastward and northward components of the 10-m wind speed. The overall average 10-m wind speed in the Antarctic was 4.75 m·s, and the average of the four sea areas was approximately 5.0 m·s, excluding the value of 3.9 m·sin the Weddell Sea. The maximum monthly 10-m wind speed reached 8.26 m·s, which occurred in the Amundsen Sea.

Figure 9 Monthly sea surface pressure, 2-m temperature, and 10-m wind speed of the Antarctic and five regions (Western Pacific Ocean,Weddell Sea, Ross Sea, Indian Ocean, and Amundsen Sea) from 1989 to 2019. a, Sea surface pressure; b, 2-m temperature; c, 10-m wind speed. The abscissa is the year, the ordinate is the value of each factor, and the different colored lines represent the different study areas.
The analysis of Antarctic sea surface pressure, 2-m temperature, and 10-m wind speed from 1989 to 2019 used these data to calculate the correlation coefficient with the SIC. The result is shown in Figure 10, which demonstrates that the 2-m temperature and SIC distribution have an notable negative correlation, whereas the correlations of the sea surface pressure and 10-m wind speed with SIC are weak.
The correlation coefficient analysis of the SIC and three environmental factors in summer (November-March)and winter (April-October) is illustrated in Figure 10. The correlation coefficient between the sea surface pressure and SIC in winter is larger than that in summer, which is approximately 0.1. There is a strong negative correlation between the 2-m temperature and SIC distribution in both summer and winter, which is approximately 0.8 and passes a significance level test ofα
= 0.05. Near the Antarctic Peninsula, the correlation between the 2-m temperature and SIC is weak likely owing to the proximity to the continent interior and the influence of the sea surface wind speed. The correlation coefficient between the sea surface pressure and wind speed and SIC in winter is approximately 0.3 around the Antarctic Peninsula. This also directly affects the closure time of the MIZ ring near the Antarctic Peninsula.
Figure 10 Correlation coefficient distribution of the Antarctic SIC and sea surface pressure, 2-m temperature, and 10-m wind speed in summer and winter. a and b show the correlation coefficients between the sea surface pressure and SIC in summer and winter, respectively;c and d show the correlation coefficients between the 2-m temperature and SIC in summer and winter, respectively; e and f show the correlation coefficients between the 10-m wind speed and SIC in summer and winter, respectively.
4.2 Second-order partial correlation coefficient analysis
To further analyze the correlation between the MIZ extent and single environmental factors, the second-order partial correlation coefficient method was adopted to exclude the influence of other factors. The second-order partial correlation coefficient of the MIZ and sea surface pressure,2-m temperature, and 10-m wind speed in the Antarctic and five investigated regions are listed in Table 2.
The sea surface pressure and 2-m temperature in the Antarctic are strongly correlated with the MIZ extent with a second-order partial correlation coefficient of approximately -0.6 (Table 2). The second-order partial correlation coefficient of the 10-m wind speed and MIZ extent is -0.4231. The MIZ variation is therefore the joint action of many factors. Temperatures rise and the 10-m wind speeds increase in the areas of high sea surface pressure, which leads to more MIZ dilution and conversion to OW.

Table 2 Second-order partial correlation coefficient of the MIZ and sea surface pressure, 2-m temperature, and 10-m wind speed in Antarctic and the five investigated regions from 1989 to 2019
The MIZ extent of the Amundsen Sea has a weak correlation with the 10-m wind speed, for which the second-order partial correlation coefficient is -0.2244. The MIZ extent of the Weddell Sea has the lowest correlation with sea surface pressure and 2-m temperature, and a stronger correlation with the 10-m wind speed. The MIZ extent variation in the Western Pacific Ocean is most closely related to the sea surface pressure and 2-m temperature with negative correlations reaching -0.8773 and -0.7344, respectively.
5 Conclusions
In this study, the Antarctic MIZ extent was extracted using the Antarctic SIC results from 1989 to 2019 retrieved by the NCLS-TV algorithm and passive microwave data. The division of five Antarctic regions allows the temporal and spatial variations of the MIZ extent to be analyzed across the entire Antarctic and different sea areas. The results show that the overall extent of the Antarctic MIZ does not fluctuate substantially, but there are notable monthly variation patterns. The Antarctic MIZ extent decreases from November to February and increases from March to October. The annual average extent of the MIZ is the largest in the Weddell Sea and the smallest in the Western Pacific Ocean, and the specific changes of the MIZ differ in each sea area.
To further study the MIZ distribution variation in the different geographical locations, the monthly average MIZ distribution of four months was enumerated and the temporal longitude and latitude variations of the Antarctic MIZ were analyzed. The variation of the MIZ ring width was also statistically analyzed. The results show that the MIZ extent in the Weddell Sea and Antarctic Peninsula substantially differ, and the MIZ extent in the Western Pacific Ocean is smaller and more stable than that in the other sea areas.
The MIZ begins to form a closed ring in May, which basically stabilizes in September when the variance of the ring width is the lowest. The MIZ ring closes near the Antarctic Peninsula. The MIZ ring width changes differently in the different months. In summer, the MIZ ring width variance change is large, whereas in winter, its width is stable between 350 and 370 km. The average latitude of the Antarctic MIZ increases upon sea ice melting and decreases with the expansion of the MIZ. The average latitude of the Antarctic MIZ is relatively stable in summer and changes considerably in winter, reaching a difference of 3°. In October, the lowest value of the average MIZ latitude reached 64.35°S.
The sea surface pressure, 2-m temperature, and 10-m wind speed are negatively correlated with the MIZ extent variation. The influence of the sea surface pressure and 2-m temperature on the MIZ extent variation is greater than that of the 10-m wind speed. Among these, the sea surface pressure of the Western Pacific Ocean showed the strongest correlation with the MIZ extent, and its second-order partial correlation coefficient reached -0.8773.
Acknowledgments
This study was supported by the National Natural Science Foundation of China (Grant no. 41941010), the National Key Research and Development Program of China (Grant no.2018YFC1406102) and the Funds for the Distinguished Young Scientists of Hubei Province (China) (Grant no. 2019CFA057). Two anonymous reviewers and Guest Editor Dr. Bin Cheng are deeply thanked for their constructive comments and suggestions for revising the paper.杂志排行
Advances in Polar Science的其它文章
- The rise of sea ice research collaboration between China and Finland
- Early glaciological and Quaternary Geology cooperation
- Physics of Arctic landfast sea ice and implications on the cryosphere: an overview
- An overview of Antarctic polynyas: sea ice production,forcing mechanisms, temporal variability and water mass formation
- Observation and modelling of snow and sea ice mass balance and its sensitivity to atmospheric forcing during spring and summer 2007 in the Central Arctic
- An observational study of precipitation types in the Alaskan Arctic
