An observational study of precipitation types in the Alaskan Arctic
2021-08-19YUEHandongDOUTingfengLIShutongLIChuanjinDINGMinghuXIAOCunde
YUE Handong, DOU Tingfeng*, LI Shutong,, LI Chuanjin,DING Minghu & XIAO Cunde
1 College of Resources and Environment, University of Chinese Academy of Sciences, Beijing 100049, China;
2 State Key Laboratory of Cryospheric Science, Northwest Institute of Eco-Environment and Resources, Chinese Academy of Sciences, Lanzhou 730000, China;
3 State Key Laboratory of Severe Weather and Institute of Tibetan Plateau & Polar Meteorology, Chinese Academy of Meteorological Sciences, Beijing 100081, China;
4 State Key Laboratory of Earth Surface Processes and Resource Ecology, Beijing Normal University, Beijing 100875, China
Abstract The effects of various precipitation types, such as snow, rain, sleet, hail and freezing rain, on regional hydrology,ecology, snow and ice surfaces differ significantly. Due to limited observations, however, few studies into precipitation types have been conducted in the Arctic. Based on the high-resolution precipitation records from an OTT Parsivel2 disdrometer in Utqiaġvik, Alaska, this study analysed variations in precipitation types in the Alaskan Arctic from 15 May to 16 October, 2019.Results show that rain and snow were the dominant precipitation types during the measurement period, accounting for 92% of the total precipitation. In addition, freezing rain, sleet, and hail were also observed (2, 4 and 11 times, respectively), accounting for the rest part of the total precipitation. The records from a neighbouring U.S. Climate Reference Network (USCRN) station equipped with T-200B rain gauges support the results of disdrometer. Further analysis revealed that Global Precipitation Measurement (GPM) satellite data could well characterise the observed precipitation changes in Utqiaġvik. Combined with satellite data and station observations, the spatiotemporal variations in precipitation were verified in various reanalysis datasets,and the results indicated that ECMWF Reanalysis v5 (ERA5) could better describe the observed precipitation time series in Utqiaġvik and the spatial distribution of data in the Alaskan Arctic. Modern-Era Retrospective analysis for Research and Applications, Version 2 (MERRA-2) overestimated the amount and frequency of precipitation. Japanese 55-year Reanalysis(JRA-55) could better simulate heavy precipitation events and the spatial distribution of the precipitation phase,but it overestimated summer snowfall.
Keywords disdrometer, precipitation types, reanalysis datasets, data comparison
1 Introduction
The Arctic environment is extremely sensitive to global climate change (Flato and Brown, 1996; Jaskólski, 2017).Over the past three decades, the Arctic region has warmed by more than twice the global mean (Bekryaev et al., 2010;Screen and Simmonds, 2010; Cohen et al., 2014). As a result, spring precipitation in the Arctic has shown a trend of transitioning from solid to liquid (Han et al., 2018; Dou et al., 2021). Precipitation phase changes significantly affect the surface energy budget, regional water cycle and ecological environment in the Arctic (Barnett et al., 2005;Ye, 2008; Berghuijs et al., 2014). Polar underlying surfaces are mainly covered by snow, ice and frozen soil, thus the freezing-thawing process is highly sensitive to changes in the precipitation phase. Rainfall can promote the melting of snow and ice by reducing the albedo and releasing latent heat (Rennert et al., 2009; Dou et al., 2019). In contrast,snowfall positively contributes to the mass balance of ice and snow, and can delay their melting (Perovich and Polashenski, 2012; Perovich et al., 2017). Winter rains freeze into ice on the ground, preventing reindeer from feeding and thus causing large numbers of deaths (Cohen et al., 2015; Forbes et al., 2016; Berger et al., 2018).
As precipitation observations in the Arctic are limited,previous studies have paid more attention to changes in the precipitation phase and their effects (Cohen et al., 2015;Crawford et al., 2019; Pan et al., 2020). It has been suggested that precipitation in the Arctic will mainly occur in the liquid form by the end of the 21st century (Bintanja and Andry, 2017). Other precipitation types (such as hail,sleet and freezing rain) have rarely been studied, however(Stewart et al., 2015). These precipitation types have a catastrophic impact on local infrastructure and residents’lives (Kochtubajda et al., 2017; Tobin et al., 2021).Therefore, it is of great significance to study spatiotemporal variations in precipitation types in the Arctic under the background of climate warming.
At present, precipitation types can only be studied based on ground measurements. Precipitation types in the Arctic region are rarely observed, and only a small portion of data from existing stations distinguishes between liquid and solid precipitation. In addition, these data have poor temporal resolution, which seriously restricts the study of precipitation types in the Arctic and their impacts. Using an OTT Parsiveldisdrometer, here detailed measurements of the types and amounts of precipitation were performed and minute-level observation data of 16 types of precipitation were obtained during May and October, 2019.
These observational data were used to analyse the precipitation types and their variations in Utqiaġvik, Alaska during the Arctic Warm Period (late spring-autumn). The disdrometer observations were also verified using data from a nearby U.S. Climate Reference Network (USCRN) station.Based on these observations, remote sensing precipitation products in the Alaskan Arctic were verified, and the applicability of various reanalysis datasets in this region were evaluated.
2 Data and methods
2.1 Study area
Utqiaġvik (71°18′N, 156°46′W) is located at the northernmost tip of Alaska, USA. It has an average annual temperature of approximately -12℃ and an average annual cumulative precipitation of ~106 mm·a(Shiklomanov et al., 2010). The area features many cryospheric elements,such as sea ice, frozen soil, snow and lake ice, is therefore an ideal place to study the environments of high latitude regions and carry out climate change monitoring research in the Arctic. In order to monitor the precipitation type in the area, a disdrometer was installed on the roof of the Barrow Arctic Research Center (BARC) with a sustainable power supply (71°19′N, 156°40′W). The underlying surface was flat,and the surrounding area was unobstructed, making this location an ideal place to continuously monitor the precipitation (Figure 1).

Figure 1 Study area and precipitation measurement sites (the red point is the disdrometer site and the blue point is the USCRN observation station).
2.2 Station observations
This study employed the OTT Parsiveldisdrometer, which was produced in Germany. This automatic optical disdrometer has the advantages of conducting unattended,automatic recording, and of being operational in all weather conditions (Battaglia et al., 2010). Disdrometers use the principle of light extinction to determine different types of precipitation by measuring the particle size and falling speed of precipitation particles. The OTT Parsivelis an updated version of OTT Parsivel; it uses a new sensing device and an algorithm designed to consider the particle deformation of falling precipitation (Figure 2). Compared to the previous version, its measurement accuracy regarding precipitation value and particle size is significantly improved (Tokay et al., 2014). The OTT Parsivelrecords precipitation data at a one-minute resolution, and can distinguish 16 types of precipitation.Here, it was used to record these data from 15 May to 16 October, 2019. The recording format of precipitation type was SYNOP wawa4680 weather code developed by the World Meteorological Organization (WMO; hereafter 4680 code); detailed information was presented in Table 1.This paper focuses on five types of precipitation: rain,snow, sleet, freezing rain and hail. The merger relationships between the measured and statistical precipitation types were shown in Table 2; for statistical analysis, light rain (4680 code: 51-53, 57, 58) and rain(4680 code: 61-63) were combined into rain, snow of three intensities (4680 code: 71-73) and snow gain (4680 code: 77) were combined into snow, freezing rain of two intensities (4680 code: 67, 68) were combined into freezing rain and soft hail (4680 code: 87, 88) and hail(4680 code: 89) were combined into hail.
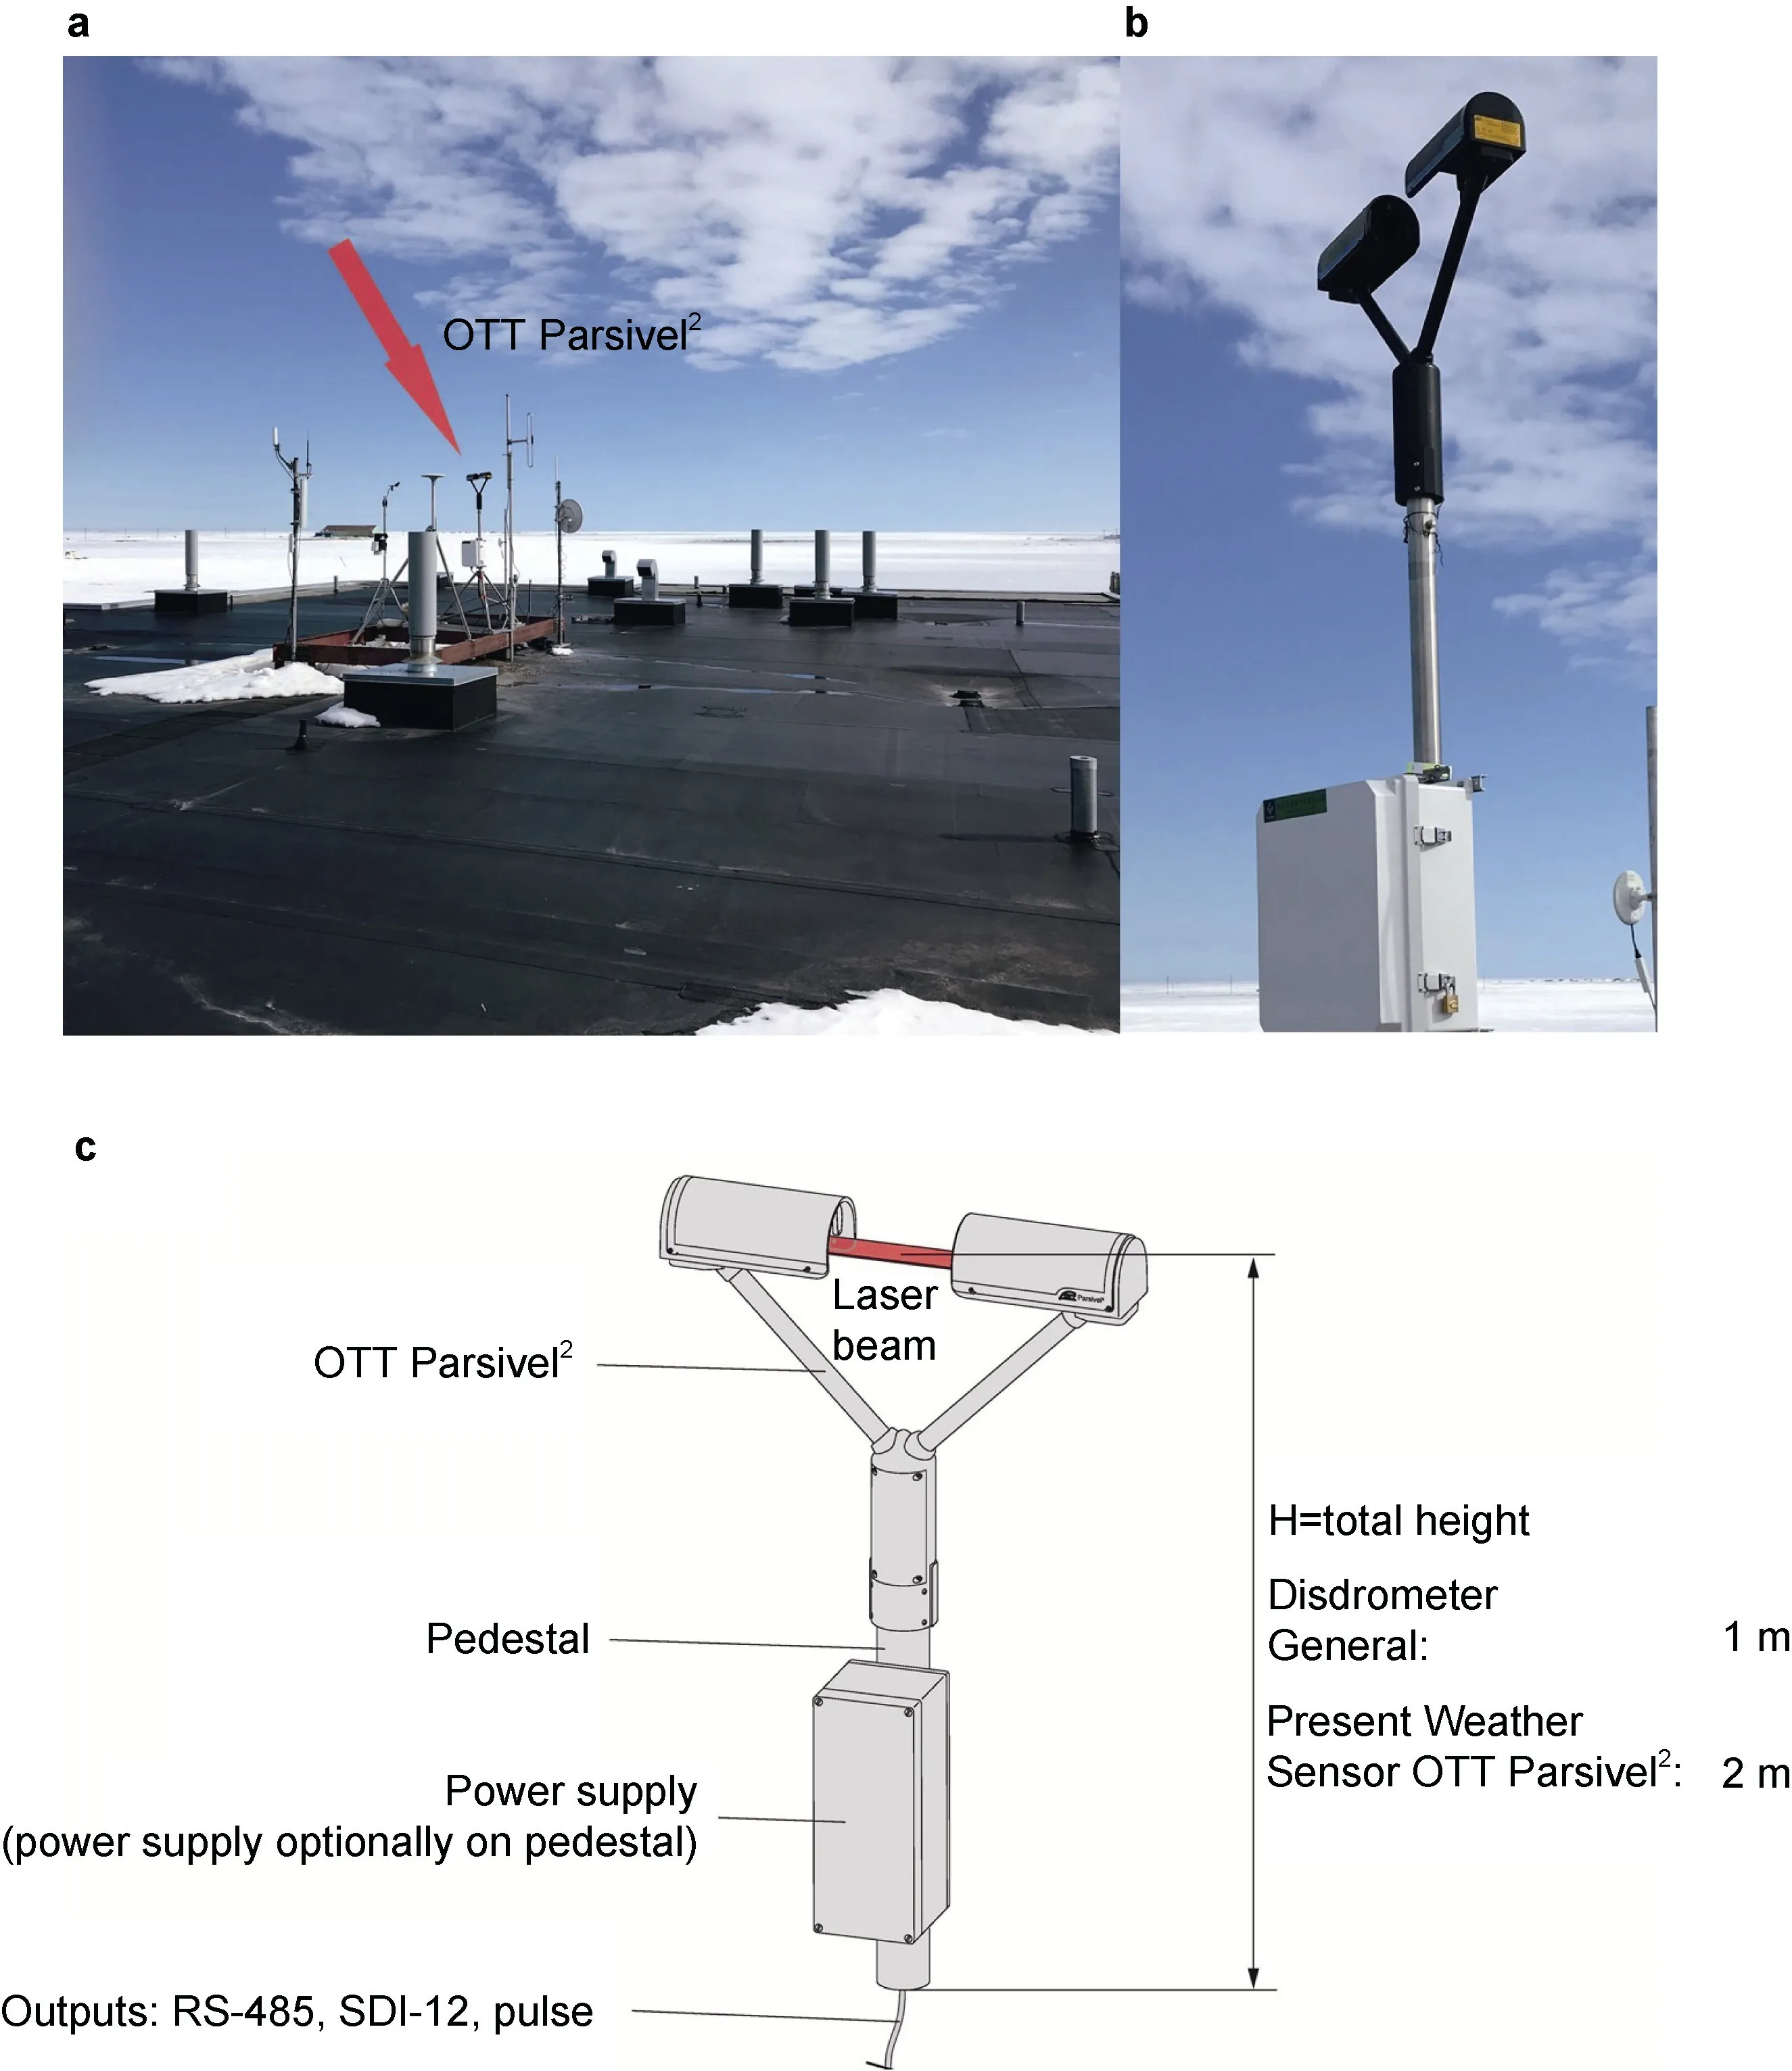
Figure 2 a, Field environment (The roof of BARC); b, OTT Parsivel2 disdrometer; c, structural diagram of OTT Parsivel2 disdrometer.
The USCRN mainly uses T-200B rain gauges for precipitation measurements (Diamond et al., 2013), which can provide precipitation observation data with a time resolution of 5 min. As a USCRN station (71°17′N,156°45′W) was relatively close (1.5 km) to the disdrometer site (at BARC), this station’s data were used to validate the records of the disdrometer.
In addition, this study also selected automated surface observing systems (ASOS) data to evaluate the spatial distribution of seasonal precipitation in the Alaskan Arctic given by various reanalysis datasets. ASOS is the leading surface weather observation network in America and is mainly used for weather forecasting and aviation purposes(Grim and Pinto, 2011; Landolt et al., 2020). ASOS observation stations can identify three precipitation types:rain, snow and freezing rain. Three ASOS stations in Alaska(Table 3) were selected to calculate the snowfall to total precipitation ratio (SPR) during the disdrometer observation period. Based on this, the SPR spatial distributions of different reanalysis datasets were verified. The SPR value was the ratio of snowfall to total precipitation variable in different reanalysis datasets.

Table 1 Technical parameters of OTT Parsivel2 disdrometer
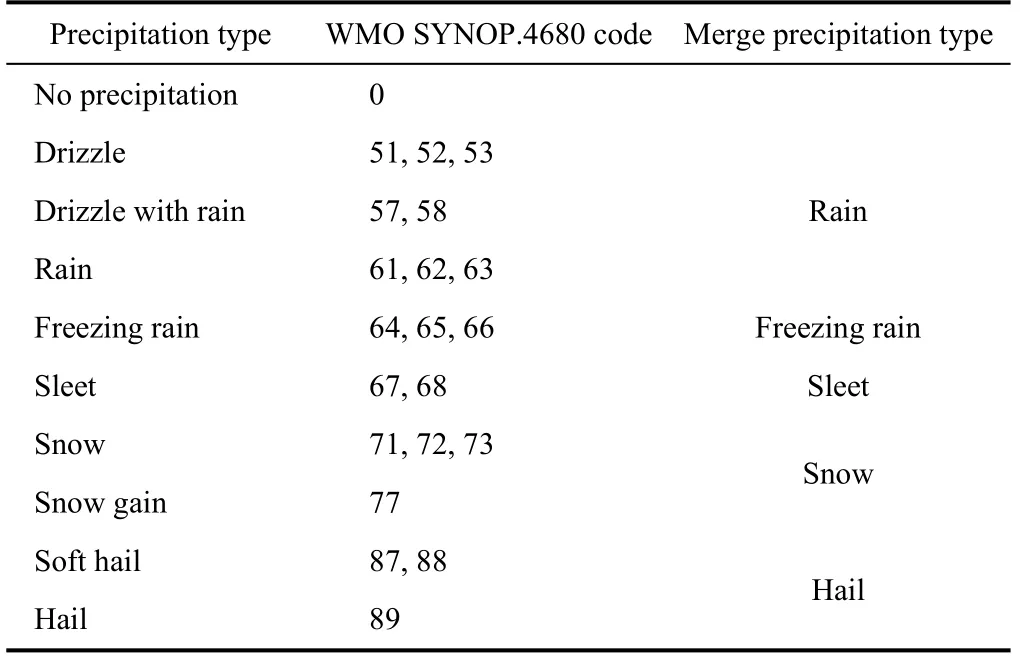
Table 2 WMO SYNOP 4680 weather code and merger relationship between measured and statistical precipitation types (Merenti-Välimäki and Laininen,2004)

Table 3 ASOS stations in Alaska selected for comparison with reanalysis datasets
2.3 Satellite data
The Global Precipitation Measurement (GPM) satellite is a new generation of the Global Precipitation Observation Program. It consists of a GPM satellite cluster and a GPM core observation platform. The GPM core platform GPM Core Observatory (GPMCO) is equipped with a GPM Microwave Imager (GMI) and a dual-frequency precipitation radar (DPR). It can obtain information (such as size and shape) of precipitation particles in clouds, and improves the ability to capture weak precipitation and solid precipitation, which is of great significance for the accurate detection and research of precipitation in middle and high latitudes (Smith et al., 2007; Skofronick-Jackson et al.,2017). GPM IMERG V06 is a relatively reliable global remote sensing precipitation product that integrates multiple microwave sensors and infrared sensor data sources on the GPM core observation platform and partner satellites (Tan et al., 2019). This study used the final precipitation product of GPM IMERG V06, which has a daily time resolution and a spatial resolution of 0.1° × 0.1°. The spatial range of solid precipitation data in this product is 70°N-70°S, which does not cover the OTT Parsiveldisdrometer observation area,so this product was instead used to compare total precipitation and precipitation frequency. The daily 3GPROF V5 product was selected to provide a comparison for the observed snowfall at the ground station. This product was obtained through the fusion of multiple microwave sensors sensitive to solid-liquid precipitation; it has a spatial resolution of 0.25° × 0.25°.
2.4 Reanalysis datasets
The total precipitation and snowfall data from ERA5(Hersbach et al., 2020), JRA-55 (Kobayashi et al., 2015)and MERRA-2 (Gelaro et al., 2017) were selected for this study. ERA5 is a fifth-generation reanalysis from the European Centre for Medium-Range Weather Forecasts(ECMWF). It provides several improvements compared to ERA-I, as detailed by Hersbach and Dee (2016). The analysis was performed at a 1-hourly time step using a significantly more advanced four-dimensional variational(4D-Var) assimilation scheme with a horizontal resolution of ~30 km. JRA-55 spans the longest record of the atmospheric global reanalysis datasets evaluated here; it covers a period extending back to 1958. It is based on the TL319 (55 km × 55 km) spectral resolution version, with a linear Gaussian grid, of the JMA Global Spectral Model(GSM) with 4D-Var and incorporates TIROS Operational Vertical Sounder (TOVS) and Special sensor microwave/imager (SSM/I) satellite data. MERRA-2 is the second generation of Modern-Era Retrospective analysis for Research and Applications (MERRA) produced by National Aeronautics and Space Administration (NASA) and uses a three-dimensional (3D)-Var assimilation system with an incremental analysis update (IAU), with a spatial resolution of 0.25°. There is no direct assimilation of precipitation data in the Arctic for all reanalysis datasets (Dee et al., 2011;Reichle et al., 2017; Dou et al., 2021). Daily precipitation data were used for these comparisons.
2.5 Methods
If the duration of a specific type of precipitation exceeded 30 min, it was recorded as a precipitation event of that type.In order to facilitate the statistical analysis of data on a monthly scale, also the precipitation type changes in this seasonal transition period were diverse. The statistical period was selected from the observation start date (15 May)to 16 October, spanning five months. Among them, the first month (from 15 May to 15 June) was named Mon1, and the remaining months were defined in the same manner (Mon2:from 16 June to 15 July; Mon3: from 16 July to 15 August;Mon4: from 16 August to 15 September; Mon5: from 16 September to 16 October). The grid point values that covered the disdrometer site in the satellite and reanalysis data were selected to allow comparison with the records of the disdrometer. The bilinear interpolation method was used to find the value corresponding to disdrometer site in various spatial data.
The 95th percentile (12.42 mm) of daily precipitation data from the disdrometer was used to recognize heavy precipitation events, referring to previous methods (Crossett et al., 2020). Two heavy precipitation events were identified during the measurement period (1 August: 16.52 mm,8 August: 12.50 mm). The SPR was used to characterise the changes in precipitation phase. Considering that the reanalysis data overestimate trace precipitation (Dai, 2006;Boisvert et al., 2018), precipitation events were only designated when the precipitation was greater than 1 mm.Sleet is classified as rain when the surface temperature is above 2℃ , and as snow when the surface temperature is below 2℃ in disdrometer data comparison.
3 Results
3.1 Precipitation types observed in Utqiaġvik
During the measurement period in Utqiaġvik, daily total precipitation varied from 0 to 16.52 mm. Precipitation was generally lower in late spring and early autumn than that in summer, and the maximum daily precipitation (16.52 mm)was observed in summer (31 July 2019). The precipitation data measured by USCRN were highly consistent with those measured by the disdrometer (Figure 3). GPM precipitation data were able to capture the observed precipitation events, except for a slight underestimation from 1 June to 13 June and an overestimation from 28 August to 13 September. This bias may have been caused by the coarse spatial resolution of remote sensing data and the limited revisit period (Xie and Arkin, 1997).

Figure 3 Comparison of observed precipitation amount (mm) based on GPM remote sensing, the disdrometer and the USCRN station in Utqiaġvik, Alaska, from 15 May to 16 Oct, 2019. The correlations (R), average (Mean) and standard deviation (Std) values of various data were marked under the legends.
As shown in Table 4, rain events were the most frequent and the main precipitation form at Utqiagvik between May-October 2019. From 15 May to 16 Oct, 2019,a total of 74 rain events were recorded, with a cumulative amount of 174.3 mm. These events accounted for 78.6% of the total precipitation during the measurement period, and the mean intensity of these rain events was 2.4 mm. The accumulative amounts of the 27 snow events and 11 hail events were 2.1 mm and 4.6 mm, accounting for 5.3% and 13.4% of the total precipitation, respectively. The average intensity of hail and snow was 1.1 mm; sleet and freezing rain occurred at low frequencies. Sleet occurred four times,with a cumulative amount of 2.3 mm; this accounted for 1.3% of the total precipitation. Freezing rain occurred twice,with a cumulative amount of 1.6 mm; this accounted for 1.4% of the total precipitation. Monthly cumulative precipitation peaked in the middle of summer and mostly occurred as rainfall. Precipitation was relatively low in late spring and early summer (Mon1), and late summer and early autumn (Mon5), while the mixedprecipitation types (freezing rain, sleet and hail) occurred frequently during this period. Freezing rain only occurred in late spring and early summer (Mon1) (Figure 4).
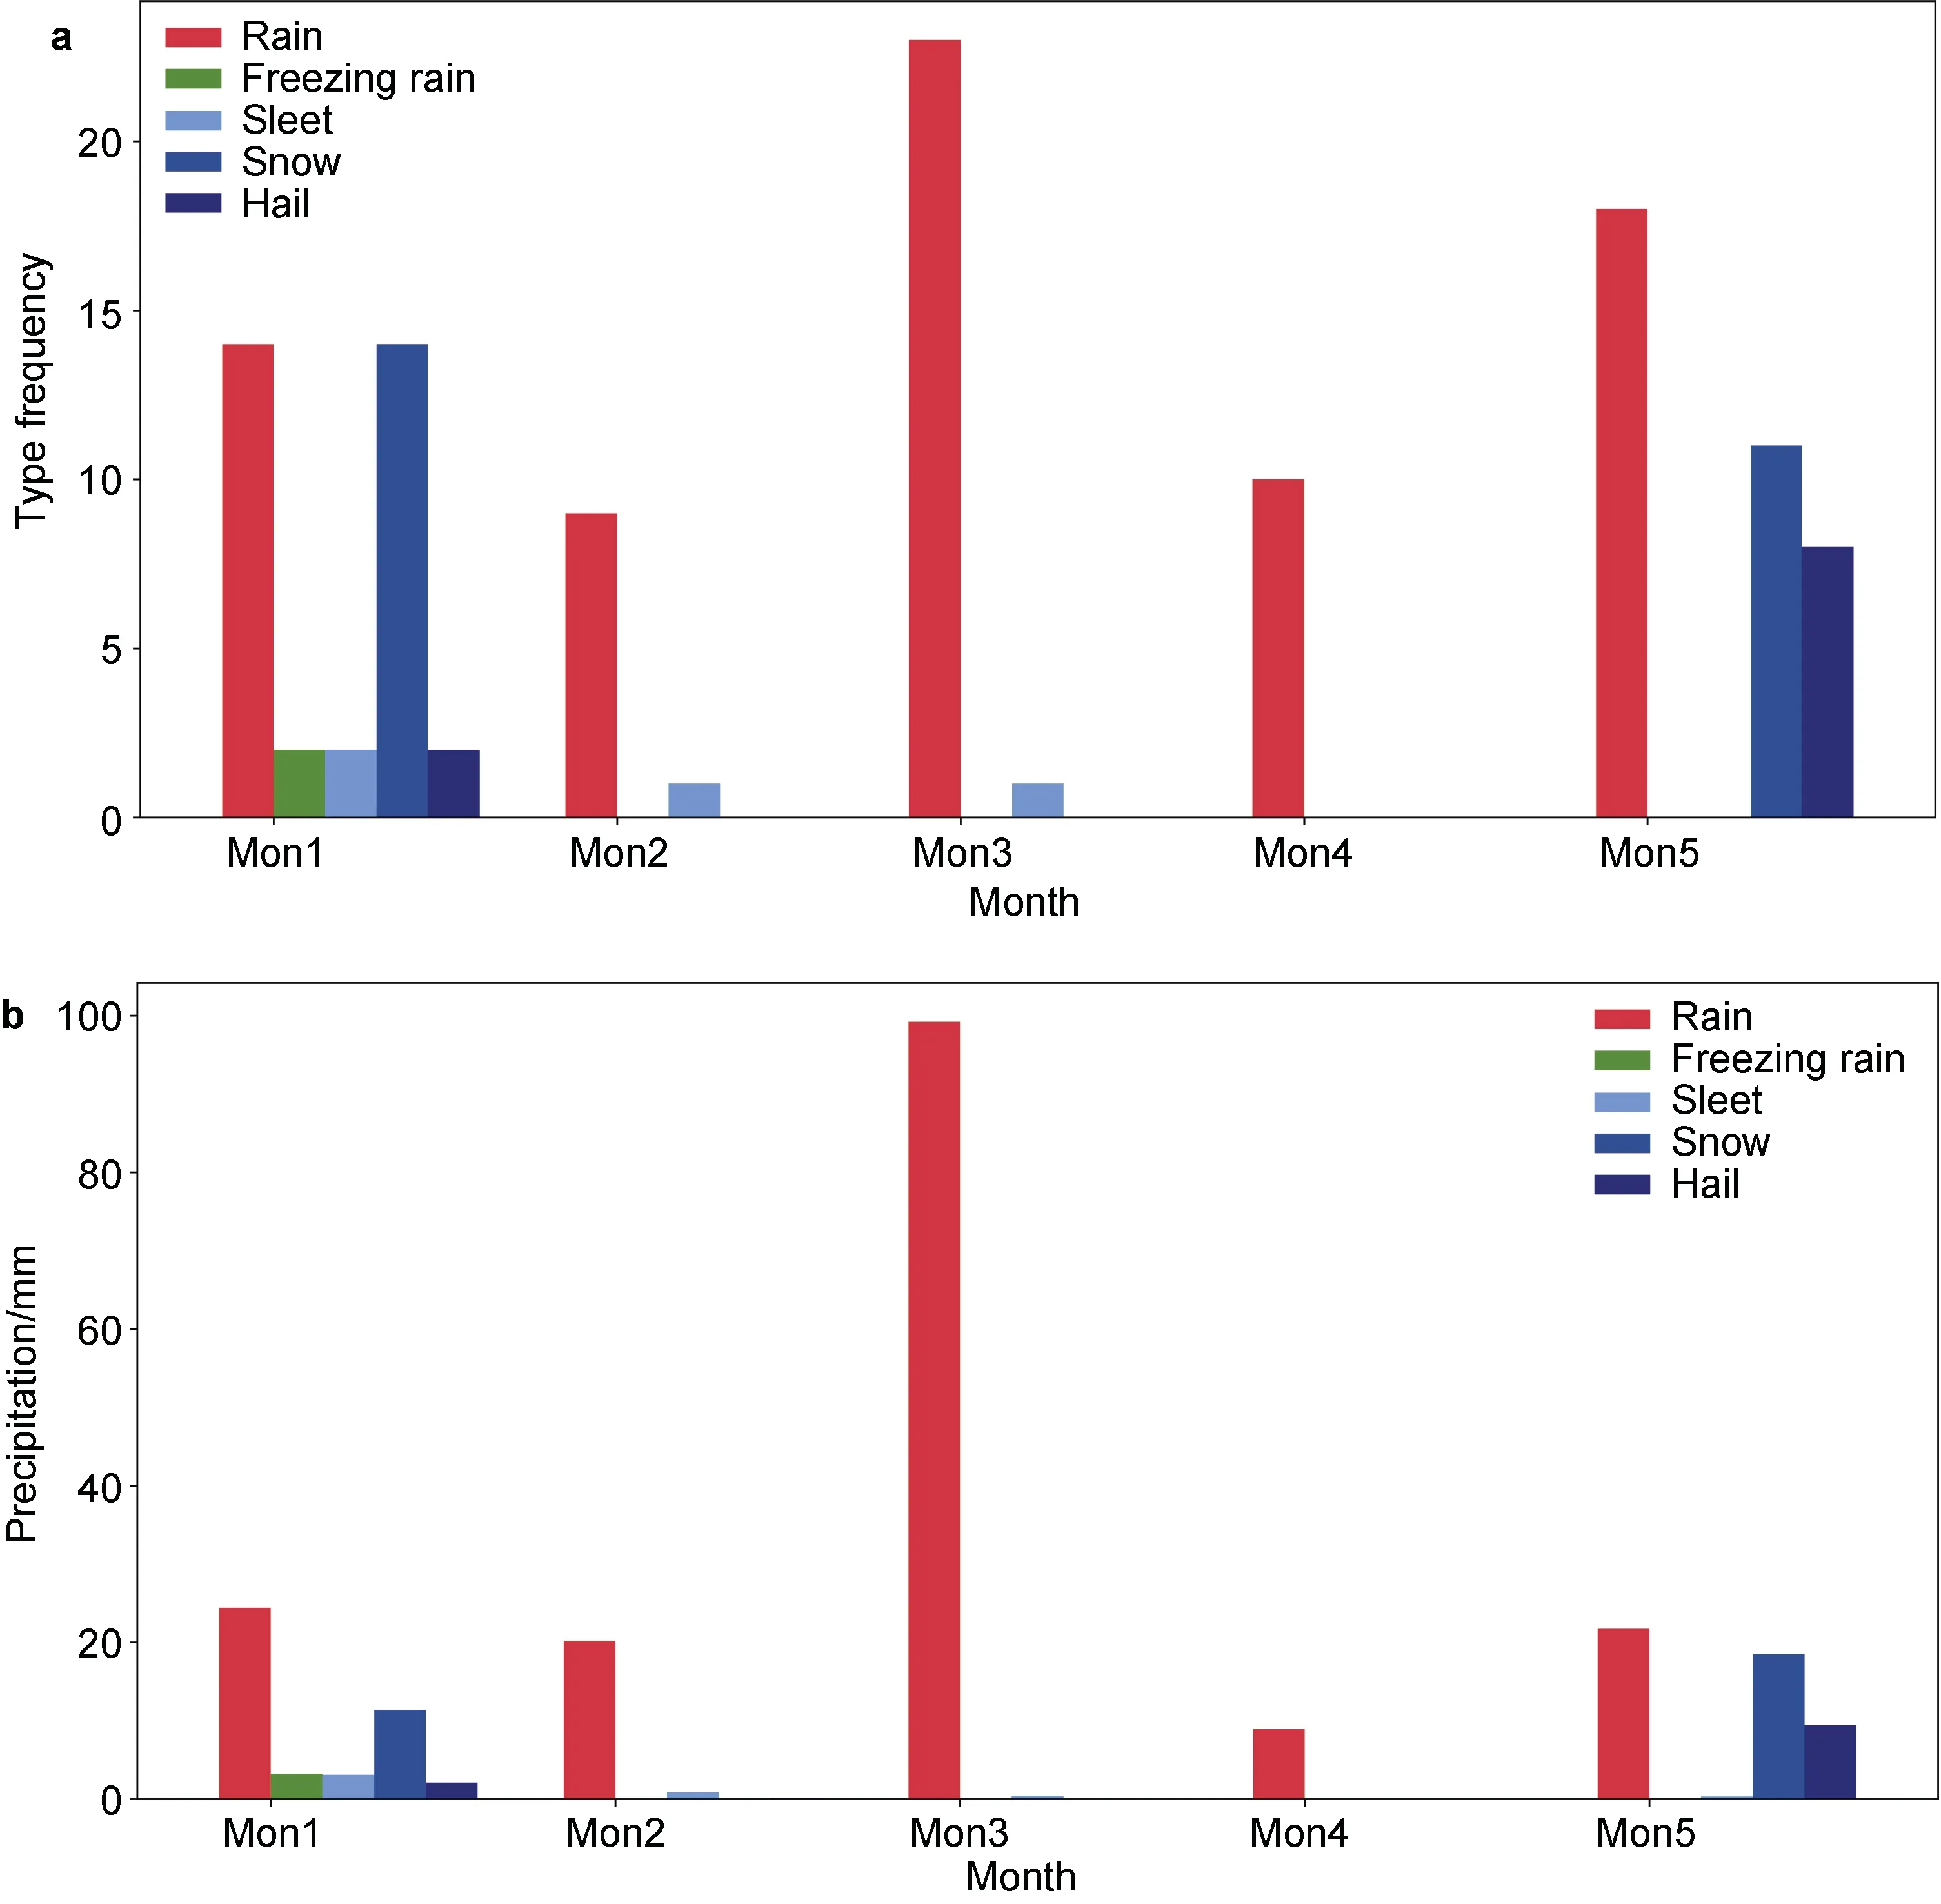
Figure 4 Observed frequencies (a), and accumulated precipitation amounts (b) of various precipitation types from the disdrometer in Utqiaġvik during 15 May through 16 Oct, 2019.

Table 4 The frequencies, cumulative precipitation amounts and intensities of different precipitation types observed by the disdrometer in Utqiaġvik from 15 May to 16 Oct, 2019
3.2 Validation of satellite data and reanalysis datasets in the Utqiaġvik
There were large differences in precipitation in Utqiaġvik among the various reanalysis datasets. Compared with the GPM data, MERRA-2 overestimated the total precipitation.ERA5 had the smallest deviation value for the cumulative total precipitation deviation between ERA5 and the disdrometer during the observation period was 31.6 mm.The cumulative deviation value between JRA-55 and the disdrometer during the observation period was 70 mm(Figure 5, Tables 5-7). Compare to disdrometer,correlations were best in MERRA-2 but it had the highest mean and standard deviation; JRA-55’s mean value is closest to disdrometer, but its correlations was poor; ERA5 had reasonable statistical values. In terms of snowfall, GPM generally underestimated snowfall, especially in the late spring, early summer and autumn (5-15 October, 2019).The reanalysis data produced a significant overestimation of snowfall in late spring and early summer, and an apparent underestimation of snowfall in early autumn. JRA-55 clearly overestimated snowfall; it misjudged snowfall in July-September, 2019. ERA5 displayed the best estimation of snowfall among the three datasets (Figure 6).

Table 5 Comparison of monthly cumulative total precipitation deviations between each dataset and disdrometer observations. The ratio of the monthly deviation of each dataset to the monthly cumulative total precipitation measured by disdrometer is shown in parentheses

Table 6 Deviations of monthly cumulative snowfall amounts for each data source from disdrometer records in Utqiaġvik, Alaska, from 15 May to 16 Oct, 2019. The ratio of monthly deviation in each data source to the monthly measured value of the disdrometer is shown in parentheses

Table 7 Comparison of monthly SPR calculated from disdrometer data (OTT) and various datasets in Utqiaġvik, Alaska, from 15 May to 16 Oct, 2019

Figure 5 Comparison of total precipitation amounts from disdrometer and MERRA-2, JRA-55 and ERA5 reanalysis datasets in Utqiaġvik,Alaska, from 15 May to 16 Oct, 2019. The correlations (R), average (Mean) and standard deviation (Std) values of various data were marked under the legends.
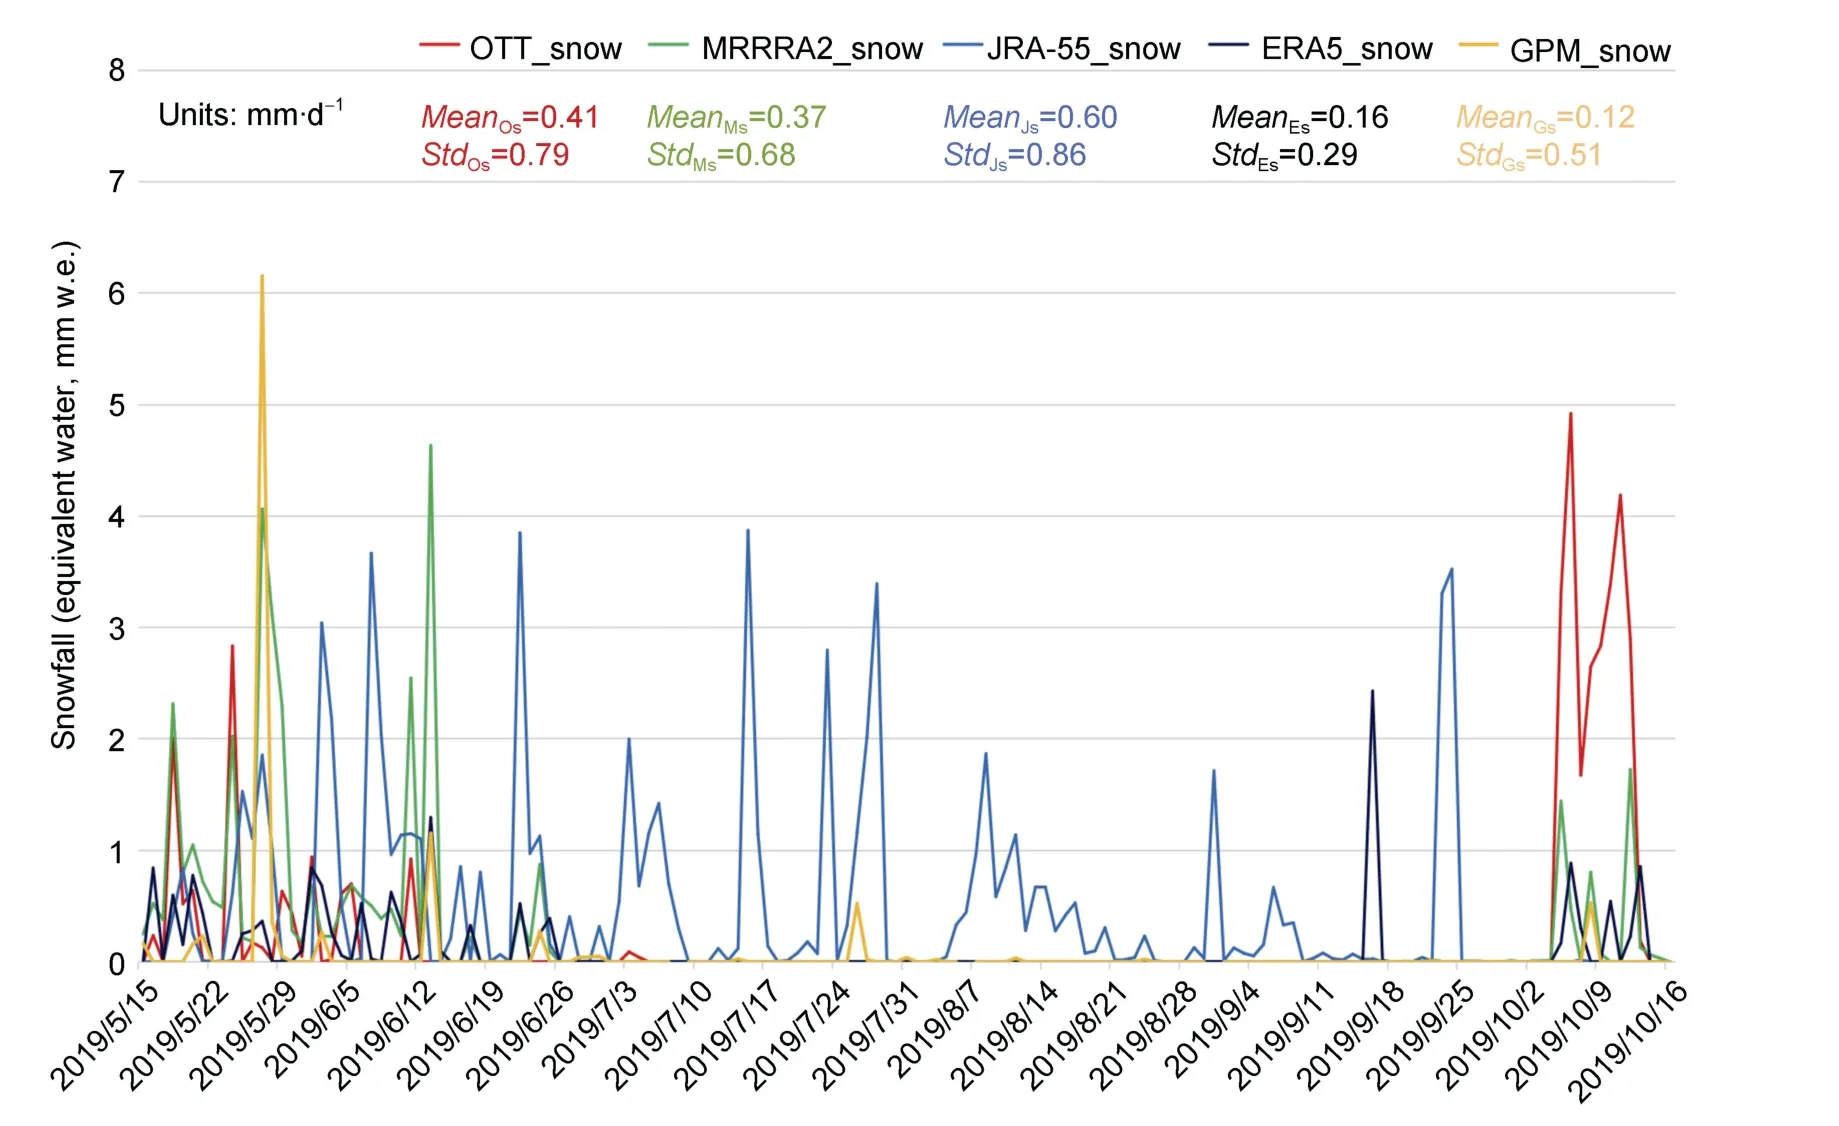
Figure 6 Comparison of snowfall amounts between observations from disdrometer and remote sensing, and three reanalysis datasets in Utqiaġvik, Alaska, from 15 May to 16 Oct, 2019. The average (Mean) and standard deviation (Std) values of various data were marked under the legends.
For the two heavy precipitation events (Table 8),data, while MERRA-2 and ERA5 exhibited significant JRA-55 showed a good performance compared with stationoverestimations.

Table 8 Daily total precipitation amounts from disdrometer, MERRA-2, JRA-55 and ERA5 for heavy precipitation events
3.3 Spatiotemporal variations of precipitation in the Alaskan Arctic
The total precipitation in GPM, ERA5, JRA-55 and MERRA-2 from June 2019 to November 2019 were selected to calculate the summer (June, July and August;JJA) and autumn (September, October and November; SON)seasonal average total precipitation results in the Alaskan Arctic (Figures 7 and 8). In terms of seasonal variations, all data showed that precipitation was higher in summer than in autumn. Regarding the seasonal variations in the diversity between land and sea, each data point was consistent; in summer, precipitation was higher on land than over the ocean, while in autumn, the precipitation on the ocean(Chukchi Sea) was higher than that on land. The ERA5,JRA-55 and GPM data had the most similar spatial distributions in the seasons. For the quantitative differences,GPM exhibited the lowest total precipitation. The average summer precipitation over land was 2-4 mm·d, and the average autumn precipitation in the Chukchi Sea was 1.5-3 mm·d. The spatial distributions and magnitude of JRA-55, ERA5, and MERRA-2 were similar, the land value in summer was 4-5 mm·d, and the value over the Chukchi Sea was 2-3 mm·d.
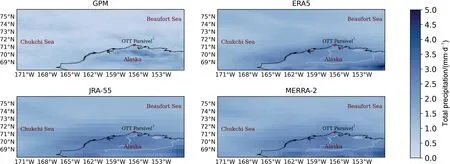
Figure 7 Comparison of summer (JJA) average precipitation values from GPM, ERA5, JRA-55 and MERRA-2 data in the Alaskan Arctic.
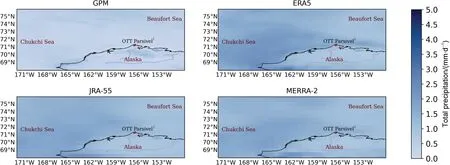
Figure 8 Comparison of autumn (SON) average precipitation values from GPM, ERA5, JRA-55 and MERRA-2 data in the Alaskan Arctic.
Each reanalysis data could well catch the seasonal variation characteristics of the precipitation phase. The spatial distributions of SPR values were significantly different in the different data sources. Based on the SPR statistical results from the ASOS stations, JRA-55 best described the spatial distribution during the precipitation phase. In summer, JRA-55 and MERRA-2 had similar spatial distributions to SPR, but the SPR values of MERRA-2 were lower in autumn (Figure 9); this may have been caused by the overestimation of total precipitation in MERRA-2. The spatial distribution of ERA5 was different to those of the other two datasets: it was low in the north but high in the south. Compared with JRA-55, the SPR values in ERA5 were higher south of 72°N and were lower north of 72°N (this was more evident in autumn).
The results showed that the total precipitation frequency in autumn (Figure 10) was higher than that in summer (Figure 11) in all data sources. GPM data showed noticeable seasonal differences; in summer, the frequency of land precipitation (30-40 times) was higher than that of the ocean (10-20 times) and the frequency of autumn land precipitation (10-15 times) was lower than that over the ocean (20-30 times). Compared with the precipitation frequency in the GPM data, the results of ERA5 were more consistent, JRA-55 and MERRA-2 were similar and all higher than ERA5.
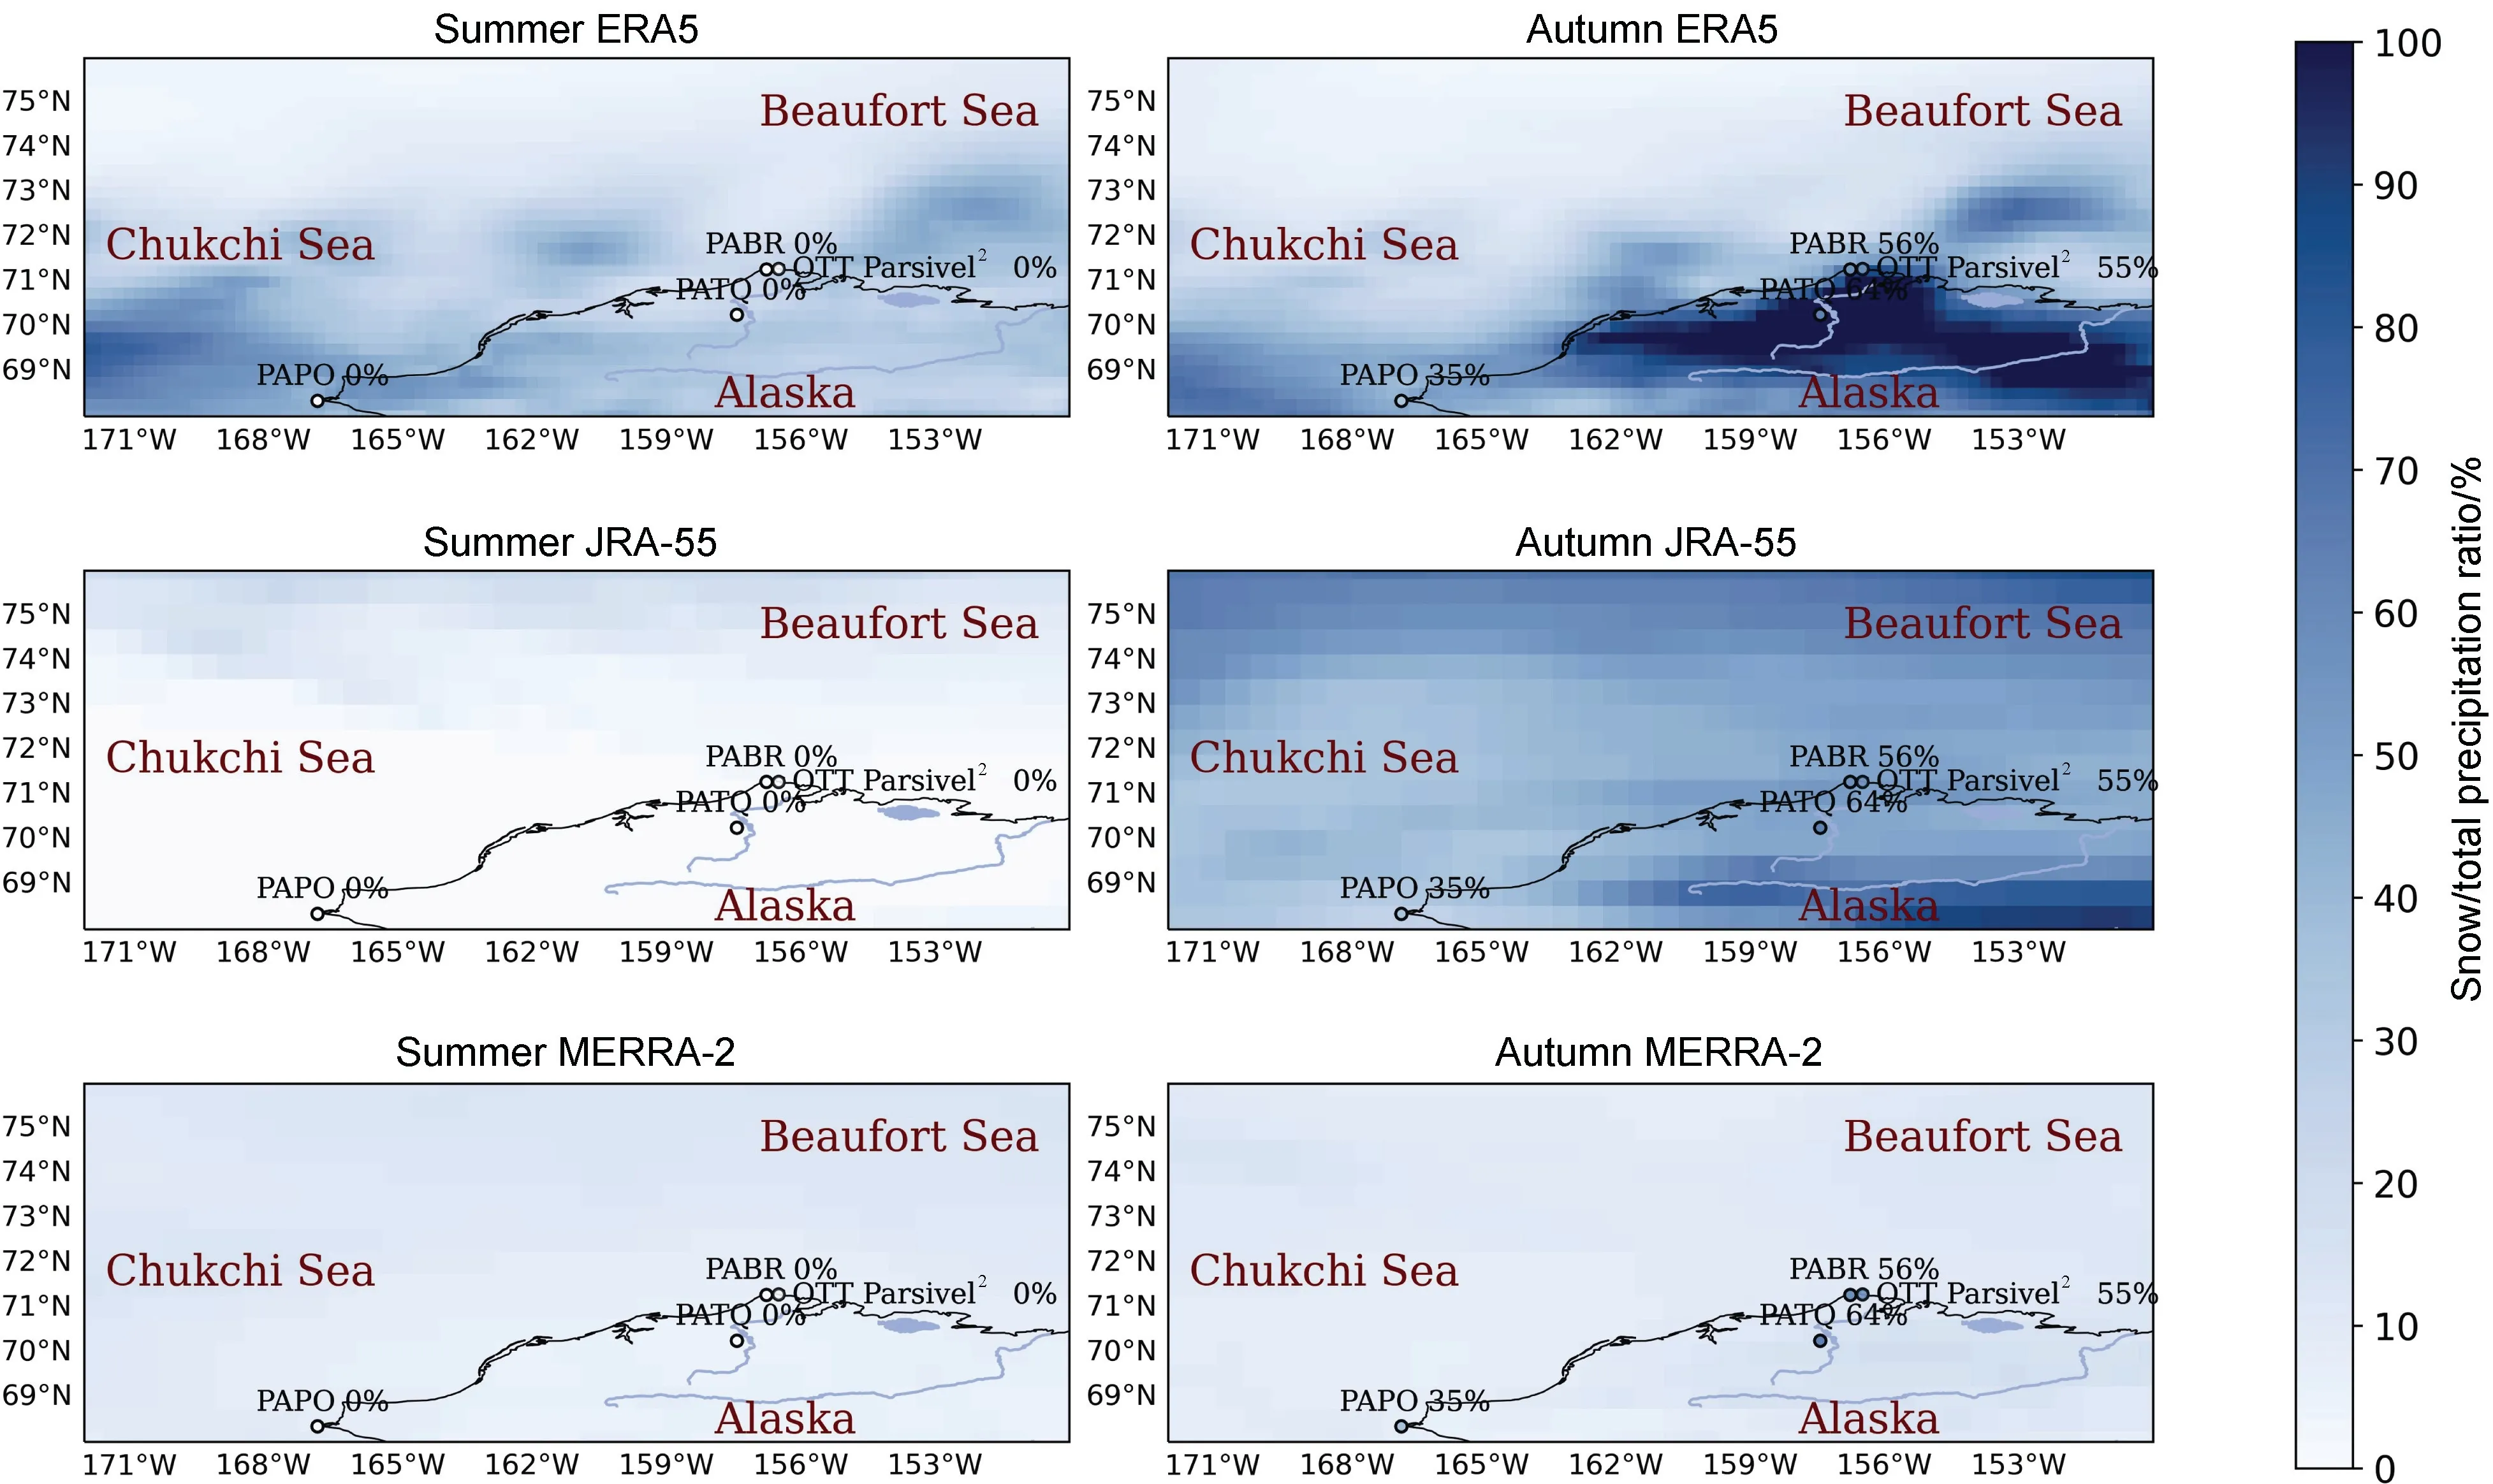
Figure 9 Comparison of SPRs among different reanalysis datasets over the Alaskan Arctic in summer (JJA) and autumn (SON).
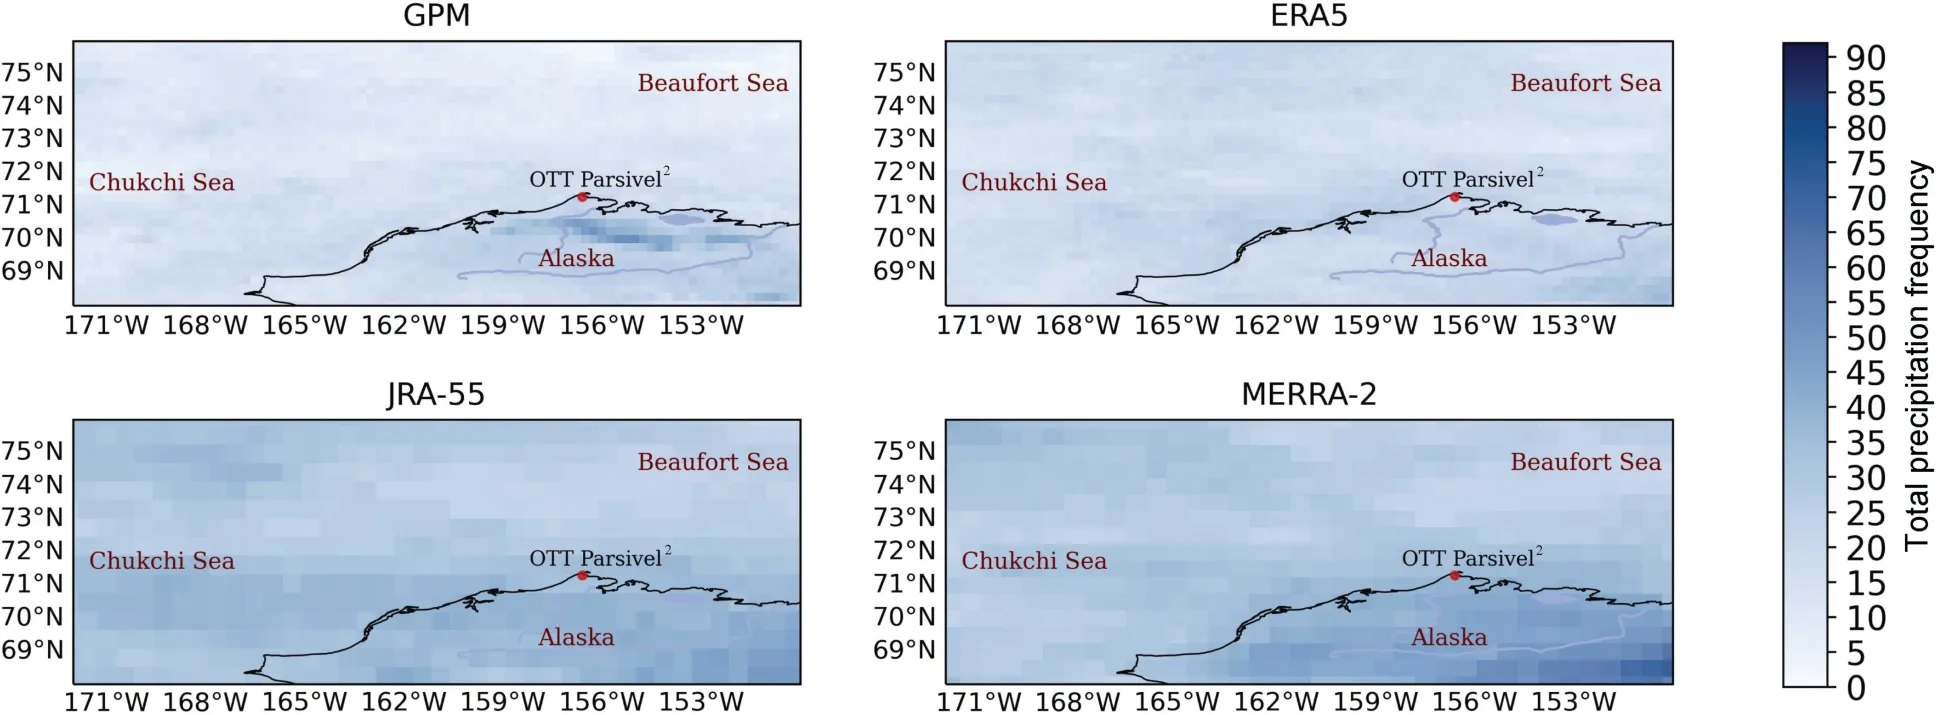
Figure 10 Spatial distribution of autumn (SON) total precipitation frequencies from GPM, ERA5, JRA-55 and MERRA-2 data.
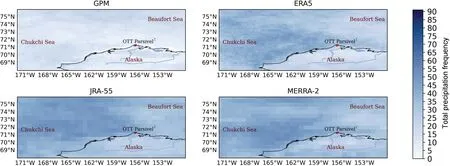
Figure 11 Spatial distribution of summer (JJA) total precipitation frequencies from GPM, ERA5, JRA-55 and MERRA-2 data.
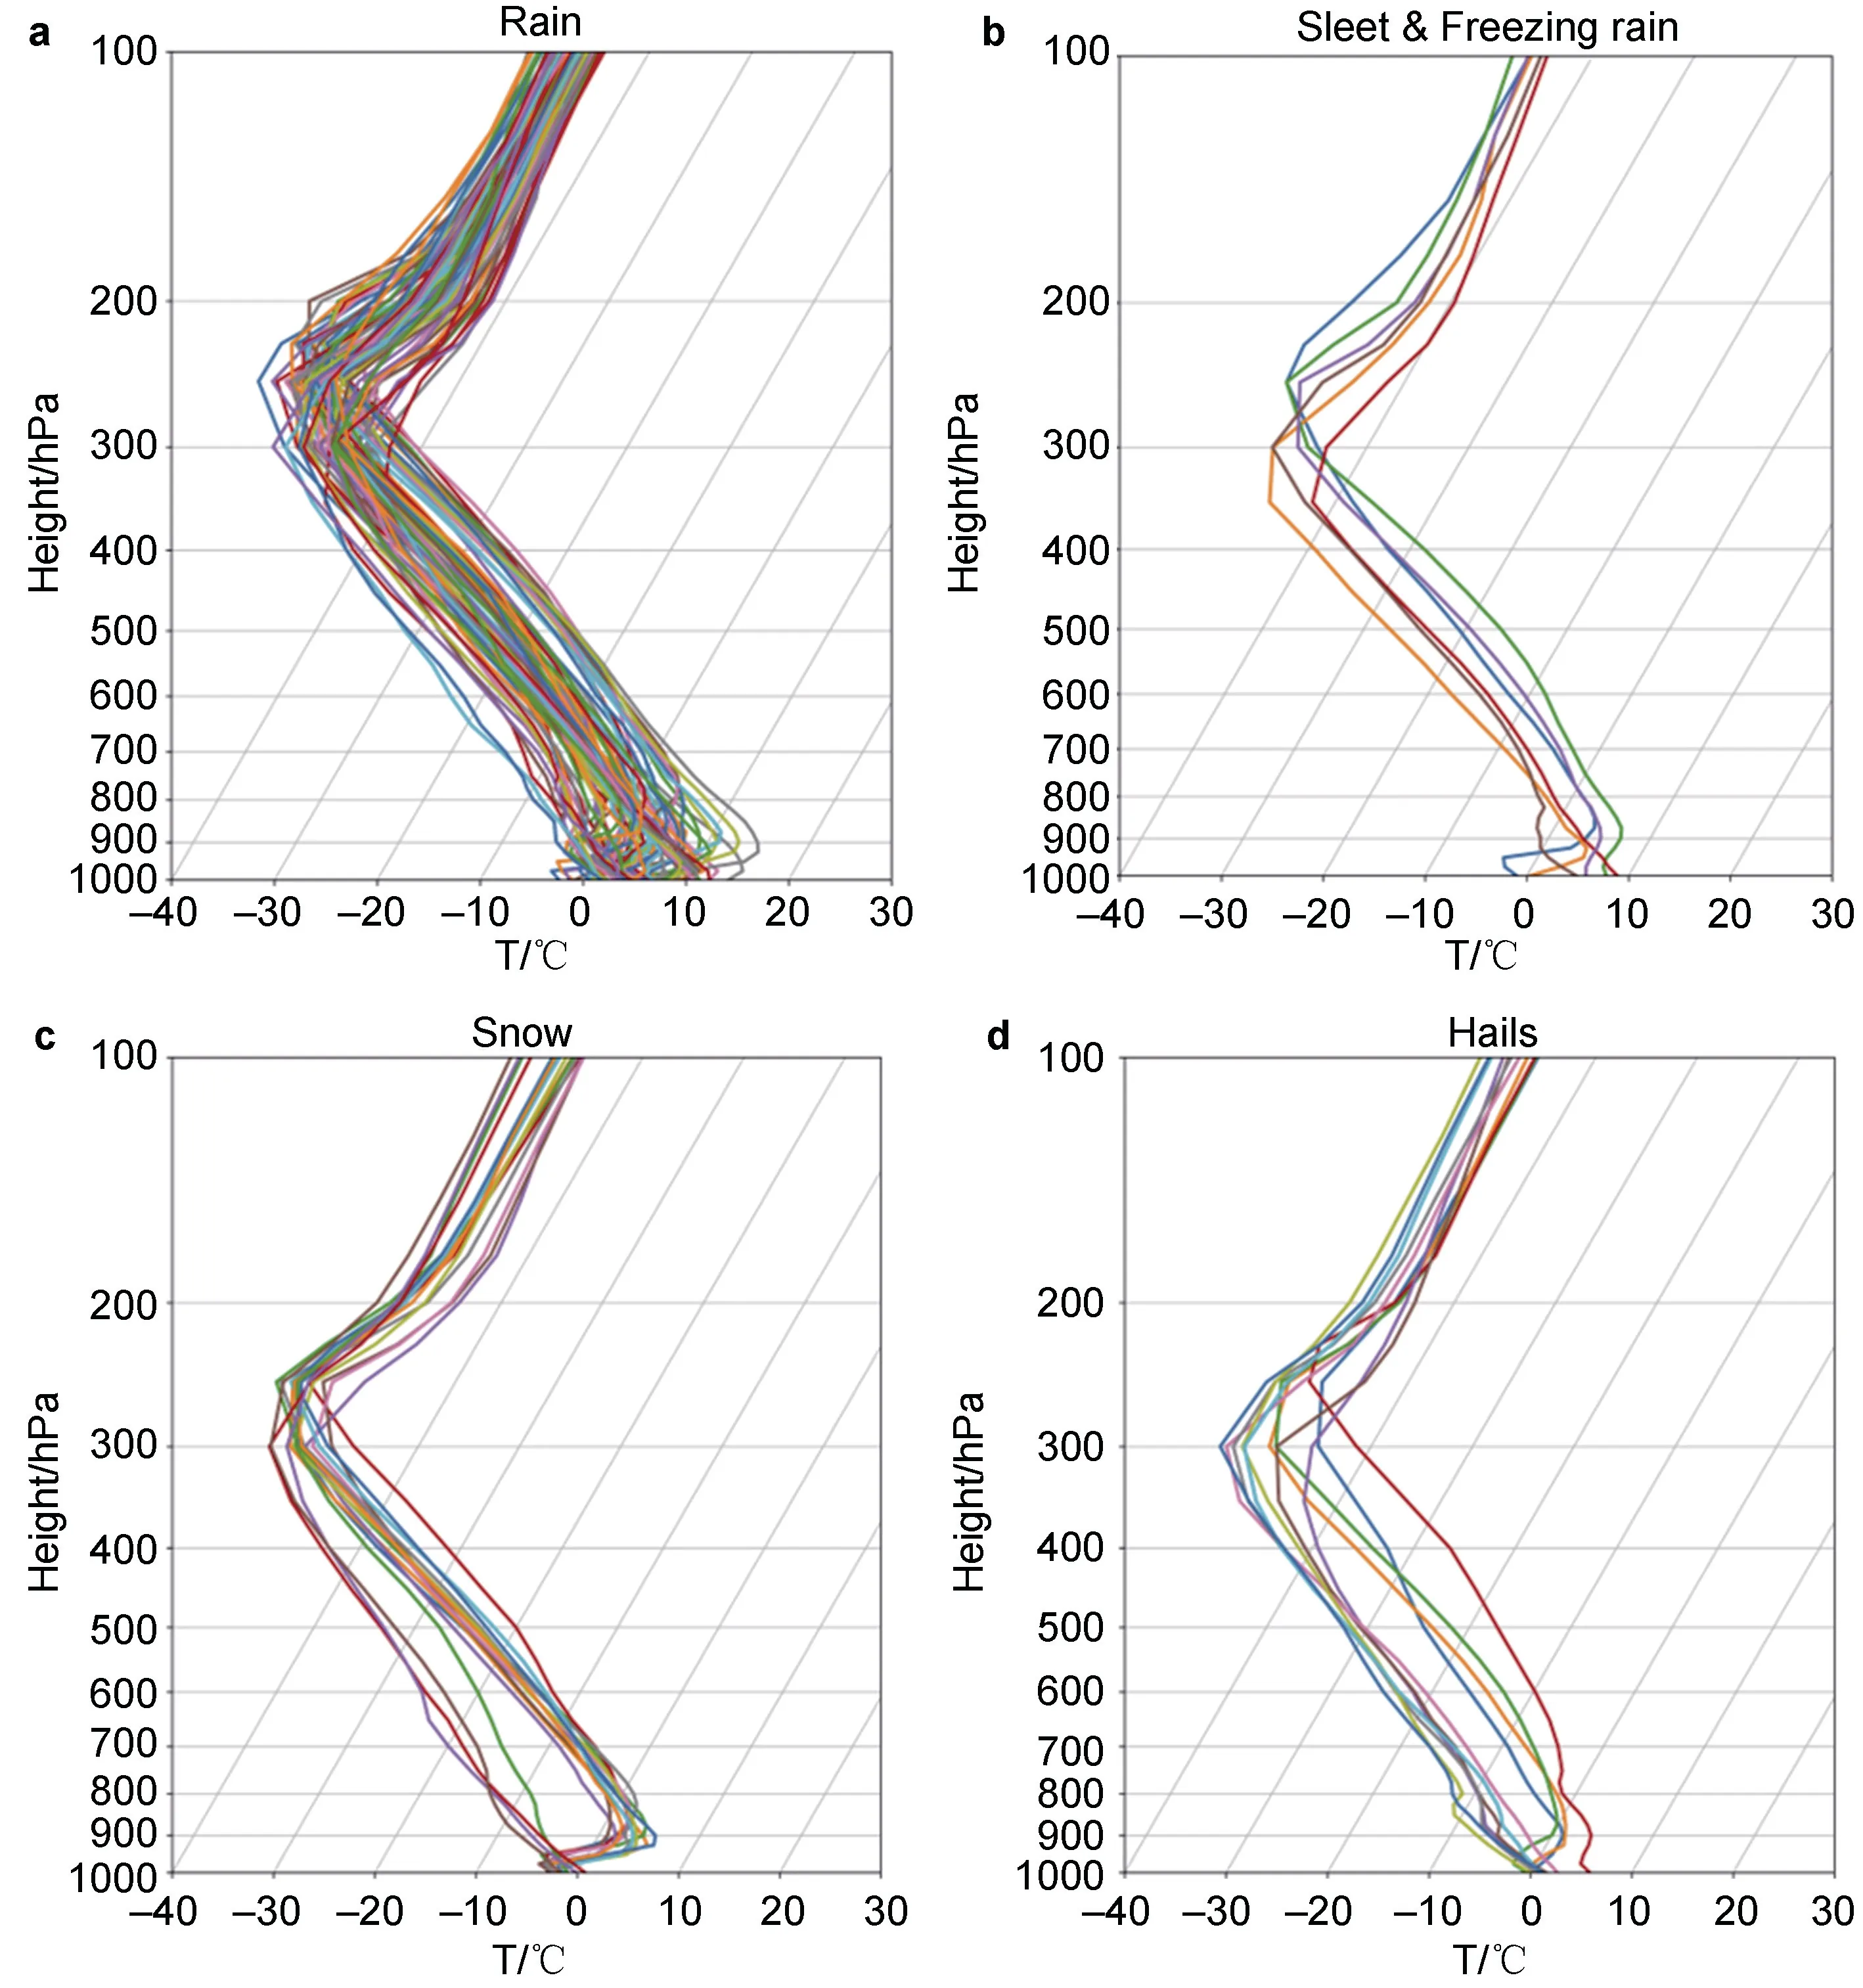
Figure 12 Daily average vertical temperature profile for four different precipitation types during the period of disdrometer observations:a, Rain; b, Sleet & Freezing rain; c, Snow; d, Hails.
4 Discussion and conclusions
This study used high-resolution measurement data from the OTT Parsiveldisdrometer to conduct detailed analysis of the types of regional precipitation in Utqiaġvik. During the observation period (155 d from 15 May to 16 Oct, 2019),74 rain events occurred, the cumulative value of which was 174.3 mm. These events accounted for 78.6% of the total precipitation, and the average intensity of each rain event
was 2.4 mm·time. The cumulative values of 27 snow events and 11 hailstorm events were 2.1 and 4.6 mm,respectively, accounting for 5.3% and 13.4% of the total precipitation, respectively. The average intensities of hail and snow were equivalent to 1.1 mm·time, and the frequencies and accumulated amounts of sleet and freezing rain were low. Sleet occurred four times, totalling a cumulative amount of 2.3 mm; this accounted for 1.3% of the total precipitation. Freezing rain occurred twice,totalling a cumulative amount of 1.6 mm and accounting for 1.4% of the total precipitation. The observation results of the disdrometer were consistent with the measured values from a USCRN station 1.5 km away from the BARC site.This indicates that the records of the disdrometer were reliable. There are errors in distinguishing the precipitation type and precipitation measurement, such as the overestimation of the diameters of larger precipitation particles and the cumulative precipitation of heavy precipitation events (Liu et al., 2019). It has been argued that environmental wind and particle deformation can cause errors (Angulo-Martínez et al., 2018). Owing to the particularity of the Arctic environment, it is recommended to set up multiple types of precipitation observation instruments to correct the measurement errors of the disdrometer, and to obtain continuous high quality observation data.
The types of precipitation are determined by specific atmospheric conditions that include thermal and moisture distributions, vertical motion, cloud, and ice nuclei distributions (Bourgouin, 2000; Stewart et al., 2015).However, the vertical temperature profile is of prime importance in earlier studies (Bocchieri, 1980; Czys et al.,1996). We validated the daily average vertical temperature profiles of the four different precipitation types (Rain, Sleet& Freezing rain, Snow and Hails) in ERA5 by using the disdrometer’s observations. The results (Figure 12) showed that when hails occurred, there were no particular characteristics in vertical temperature profile, but most time the surface temperature was close to 0℃ . In most cases of freezing rain and sleet, there was a temperature inversion layer near the ground, but some cases when sleet occurred,the vertical temperature profile was similar to the profile of rain. In some situations, a temperature variation of only 1 ℃is sufficient to induce a transition between different phases,for example between freezing rain and rain or between snow and rain (Bourgouin, 2000), so we can’t completely distinguish different types of precipitation only by vertical temperature profile. But it’s clear that when rainfall occurred, the near-surface temperature was higher than 0℃,when snow occurred, the near-ground temperature was lower than 0℃.
GPM, ERA5, JRA-55 and MERRA-2 data could all identify precipitation events in Utqiaġvik and could reasonably describe the seasonal variations in precipitation characteristics. In terms of total precipitation, ERA5 and JRA-55 were similar, while MERRA-2 significantly overestimated this variable. JRA-55 could better describe the occurrence and magnitude of heavy precipitation events,but appeared to overestimate snowfall. However, it accurately described the seasonal spatial distribution of the precipitation phase. ERA5 and GPM were the most similar in terms of the quantity and spatial distribution of precipitation frequencies, whereas MERRA-2 exhibited a higher precipitation frequency. From the perspective of seasonal variation, the total frequency of precipitation was higher in autumn than in summer. In contrast, the mean precipitation was lower in autumn than in summer,indicating that the average intensity of precipitation in summer in Arctic Alaska was higher than that in autumn.
The results of this study showed the differences of precipitation products in various reanalysis datasets(precipitation frequency, amount and phase state) in the Alaskan Arctic ( Lindsay et al., 2014; Barrett et al., 2020).The occurrence process of precipitation is relatively complex, and the precipitation amount is affected by water vapour, condensation nuclei, phase of cloud, air temperature and humidity, convective intensity and other factors(Boisvert et al., 2018). Due to the lack of in-depth understanding of polar precipitation mechanism and the precipitation observation data with high spatial and temporal coverage for assimilation and initiation,precipitation is of great uncertainty in reanalysis data(Serreze et al., 2012; Boisvert et al., 2018; Rustemeier et al.,2019). The difference of magnitude and frequency is due to the various setting in surface and boundary layer processes(e.g., the air humidity and temperature driven/initiate cloud process (Jakobson et al., 2012; Tjernström et al., 2012).)cloud and microphysical schemes, and idealized assumptions (e.g., the assumptions of particle size distribution and shape, mass diameter, particle fall speed,and other processes such as collision and coalescence (Han et al., 2013).) of different models (Klaus et al., 2016; Taylor et al., 2018). Many reanalysis data does’t have independent parameterization schemes for the Arctic region (Jakobson et al., 2012; Wesslén et al., 2014). The difference of precipitation phase states is due to the vertical temperature profile and surface temperature and humidity conditions in models, improving the accuracy of these atmospheric variables and use more reasonable methods to simulate the change process of precipitation phase would improve the accuracy of the phase of the precipitation (Bourgouin, 2000;Graham et al., 2019). These differences and reasons need to be further explored in future work.
Acknowledgements
This study is funded by the National Key Research and Development Program of China (Grant no. 2018YFC1406103), and the National Nature Science Foundation of China (Grant no. NSFC 41971084). We really appreciate two anonymous reviewers, and Associate Editor Dr. Michiel van den Broeke, for their valuable suggestions and comments that improved this article.杂志排行
Advances in Polar Science的其它文章
- The rise of sea ice research collaboration between China and Finland
- Early glaciological and Quaternary Geology cooperation
- Physics of Arctic landfast sea ice and implications on the cryosphere: an overview
- An overview of Antarctic polynyas: sea ice production,forcing mechanisms, temporal variability and water mass formation
- Observation and modelling of snow and sea ice mass balance and its sensitivity to atmospheric forcing during spring and summer 2007 in the Central Arctic
- Variation of Antarctic marginal ice zone extent(1989-2019)
