Earthworm functional groups are related to denitrifier activity in riparian soils
2021-07-16ChenCHENLeanneEJACKMartinCHNIERandJoannWHALEN
Chen CHEN,Leanne EJACK,Martin R.CHÉNIER and Joann K.WHALEN
1 State Environmental Protection Key Laborator y of Urban Ecological Environment Simulation and Protection,South China Institute of Environmental Sciences,Ministr y of Ecology and Environment of China,Guangzhou 510535(China)
2 Department of Natural Resource Sciences,Macdonald Campus,McGill University,21111 Lakeshore Road,Ste-Anne-de-Bellevue,Quebec H9X 3V9(Canada)
3 Department of Food Science and Agricultural Chemistr y and Depar tment of Animal Science,Macdonald Campus,McGill University,21111 Lakeshore Road,Ste-Anne-de-Bellevue,Quebec H9X 3V9(Canada)
(Received August 12,2020;revised September 5,2020)
ABSTRACT Riparian buffers,located in the transition zone between terrestrial and aquatic ecosystems,are a hotspot for nitrogen(N)removal through denitrification.Earthworms are abundant in riparian buffers and may enhance denitrification.This study investigated earthworm demographics of three earthworm functional groups(anecic,epigeic,and endogeic)and denitrifier activity in temporarily flooded and non-flooded riparian soils from April to October 2012 in southern Quebec,Canada.Nine earthworm species,mostly endogeic,were found in the temporarily flooded soil,while only six earthworm species were found in the non-flooded soil.On average,there were 11.7 times more earthworms with 12.4 times greater biomass(P<0.05)found in the temporarily flooded soil than in the non-flooded soil.The denitrification enzyme activity(DEA)was of similar magnitude in temporarily flooded and non-flooded soils,with temporal variation associated with rainfall patterns.Endogeic earthworm biomass was positively correlated(P<0.05)with DEA,while epigeic earthworm biomass was positively correlated(P<0.05)with 16S rRNA gene copies and nosZ gene copies from bacteria,indicating an association between earthworm functional groups and denitrifier activity in riparian soils.Stepwise multiple regressions showed that DEA in riparian soils could be predicted using soil moisture,inorganic N concentration,and earthworm functional groups,suggesting that endogeic and epigeic earthworms contributed to denitrifier activity in riparian soils.
Key Words: endogeic earthworms,epigeic earthworms,riparian areas,riparian buffer,macrofauna,seasonal change,denitrification enzyme activity,denitrifier gene copy
INTRODUCTION
Riparian buffers are a transition zone between terrestrial and aquatic ecosystems that filter water and capture nutrients from surface runoff,making them a desirable component of agricultural landscapes(Wallet al.,2001).In contrast to the relatively static water patterns in nearby upland agricultural soils,the seasonal flooding and drying cycles in riparian soils cause more pronounced fluctuations in soil redox and support more microbial-mediated nitrification and denitrification(Groffmanet al.,1992).Riparian soils also receive sediments,organic residues,and dissolved materials transported from upland agricultural soilsviaoverland flow,resulting in high nutrient loading of particulate and dissolved nitrogen(N)compounds(the latter being predominantly nitrate,NO-3).In addition,lateral and vertical water movements deposit sediments and organic residues within the riparian area(Stein and Ambrose,2001;Steigeret al.,2005).Owing to favorable moisture conditions and plentiful substrates such as NO-3and labile carbon(C)for denitrifying microorganisms(Groffmanet al.,1992),riparian buffers are often a hotspot of denitrification in agricultural landscapes(McClainet al.,2003;Manderet al.,2008).Temperate riparian buffers can produce 0.4—8.2 mg nitrous oxide(N2O)-Nm-2d-1(Heftinget al.,2003;Dhondtet al.,2004;van den Heuvelet al.,2009),which is about 10—100 times greater than that in other temperate ecosystems.For example,it has been shown that grasslands produce 0.06 mg N2O-N m-2d-1(Huanget al.,2003),pastures produce 0.06 mg N2O-N m-2d-1(Stehfest and Bouwman,2006),and forests produce 0.16 mg N2O-N m-2d-1(Pilegaardet al.,2006).
Riparian areas are also a hotspot of soil biodiversity,especially for earthworms that are well adapted to moist soils,and are expected to support larger earthworm populations.More microhabitats are available in riparian soils,and the resources and energy available to riparian soil food webs can support a wider variety of feeding strategies than those in upland agricultural soils(Naimanet al.,2005).Higher levels of moisture in riparian soils are favorable for supporting a high number and diversity of earthworm species(Reynolds,1977).The earthworm population in temperate riparian soils that experience seasonal flooding is as large as 1 912 individuals m-2,with a fresh biomass of up to 276 g m-2(González and Zou,1999;Dechaineet al.,2005;Zornet al.,2005;Huertaet al.,2007;Bradleyet al.,2011).In contrast,well-drained agricultural soils in temperate regions typically support earthworms of 285 individuals m-2and a fresh biomass of 139 g m-2(Whalen and Fox,2007).
If earthworms are more abundant and diverse in riparian soils,their contribution to decomposition and N cycling,including denitrification,is expected to be greater in these soils than in upland soils.There is evidence of an earthworminduced priming effect of denitrifying organisms in the drilosphere.This priming effect may be from directly enhancing the denitrifiers within the earthworm gut(Drake and Horn,2006)or indirectly altering the soil structure and creating biostructures,such as casts,middens,and burrows,that contain microsites for denitrifiers(Rizhiyaet al.,2007;Speratti and Whalen,2008;Lubberset al.,2013b).In a laboratorysimulated riparian buffer,earthworm-worked soils had four times higher denitrification rates than earthworm-free soils,and riparian hydrologic dynamics controlled N fluxes and N forms lost,including gaseous N forms(N2and N2O)and dissolved NO-3(Costello and Lamberti,2008,2009).However,simulated riparian buffers do not necessarily represent earthworm-denitrifier interactions in natural riparian soils because i)earthworm populations are affected by precipitation events and the heterogeneous environment of a riparian buffer(Zornet al.,2005),which alters the direct relationship between earthworms and soil denitrifiers;ii)riparian soils can support multiple species in different earthworm functional groups and their feeding and burrowing behaviors can affect the soil denitrifiers indirectly;and iii)earthworm-denitrifier interactions also depend on soil moisture conditions,such that earthworms increase N2Oemission in oxic soils,but reduce N2O emission in anoxic soils and under fluctuating oxic-anoxic moisture conditions(Bertoraet al.,2007;Chenet al.,2014).
Our study compared earthworm functional group diversity,abundance,and biomass between the temporarily flooded and non-flooded sections of a riparian buffer in southern Quebec,Canada.Lumbricid earthworms are widespread in the riparian buffers of this region owing to human activities,such as fishing,as well as earthworm migration into the riparian area from surrounding agricultural fields(Plum,2005;Kelleret al.,2007;Bradleyet al.,2011).We hypothesized that there was greater denitrifier activity in temporarily flooded riparian buffers with large earthworm populations than in non-flooded riparian buffers.This hypothesis was tested by evaluating the relationships between denitrification enzyme activity(DEA)and number and biomass of all three earthworm functional groups(i.e.,epigeic,endogeic,and anecic groups)and other soil parameters known to affect denitrification.
MATERIALS AND METHODS
Study site and experimental setup
The riparian buffer studied was locate d between the agricultural feilds of a working farm and a nearby river,the Rivière-aux-Brochets,in southern Quebec,Canada(45°08′N,73°03′W).It was a 100-m-long riparian buffer on Suffield clay loam belonging to the brown podsolic soil group,with a pH of 7.1,62.6 g C kg-1soil,and 4.6 g N kg-1soil.Soil collected from the temporarily flooded field contained 51%sand,11%clay,and 39%silt,while soil from the nonflooded field contained 63%sand,7%clay,and 30%silt.The field experiment was set up as a randomized complete block design with two parallel plots containing either the temporarily flooded riparian soil or non-flooded riparian soil.The temporarily flooded soil was in a 20 m wide×100 m long block adjacent to the stream,and the non-flooded riparian was located further up the slope in a 30 m wide×100 m long block.The soil bulk density was 0.94 g cm-3in the temporarily flooded soils and 0.71 g cm-3in the nonflooded soils.Major vegetation in the temporarily flooded riparian block includedLaportea canadensis(Canada nettle),
Eutrochium maculatum(spotted Joe-Pye weed),Sagittaria latifolia(broadleaf arrowhead),Solidago gigantea(giant goldenrod),Bidens frondosa,andPhalaris arundinacea(reed canary grass).Dominant vegetation in the non-flooded riparian block includedPinus resinosa(red pine),Acer negundo(box elder maple),Ostr ya virginiana(American hop hornbeam),Crataegussp.(hawthorn),Geumsp.(avens),andLysimachia nummularia(creeping Jenny).
Earthworm and soil sampling
We selected the sampling schedule according to the periods when earthworms tend to be more active in temperate regions(Whalen,2004;Zornet al.,2005):There were nine sampling dates(all in 2012),two in May,one in June,one in July,one in August,two in September,and two in October(Table I).At each date,we selected four sampling points in temporarily flooded and non-flooded riparian blocks at random(no point was resampled),and at each sampling point we dug a pit(25 cm long×25 cm wide×15 cm deep),removed the soil,and hand sorted it to collect the earthworms.For the deeper-dwelling earthworms,we poured 0.5%formaldehyde solution into the bottom of each pit until it was saturated,covered the pit for approximately 20 min,and removed any emerging earthworms with forceps.We preserved earthworms from each pit in 5%formaldehyde solution for demographic analysis in the laboratory.After earthworm sampling,we sieved a soil subsample from each pit through a 4-mm mesh screen and transported it to the lab on ice.The soil was stored for<1 week at 4°C for chemical analyses or-80°C for molecular analyses.There were a total of eight soil samples and eight earthworm samples at each sampling date.
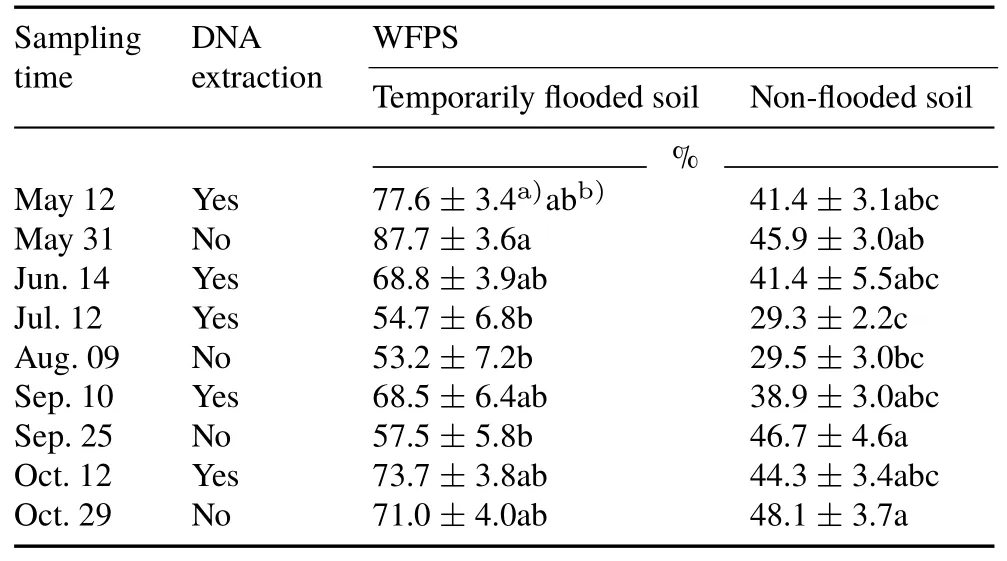
TABLE ISamples selected for DNAextraction and the water-filled pore space(WFPS)of the temporarily flooded and non-flooded riparian soils from southern Quebec,Canada at nine sampling dates from May to October 2012
Earthworm demographics
We first separated earthworms from each sampling point into fragments,juveniles,and adults and then identified adults to the species level according to Reynolds(1977).Adult earthworms were counted separately from other individuals(juveniles and fragments with an intact head).Juveniles and fragments were allocated to eitherLumbricusspp.orAporrectodeaspp.depending on the body pigmentation.The biomass of individuals in each category was the ash-free dry weight(AFDW,g),calculated by subtracting the mass of ash(500°C in a muffle furnace for 4 h)from the dry weight(60°C for 48 h).
Soil chemical analysis
Soil samples were taken at each of the nine sampling dates,and all soil properties were analyzed after each soil sampling.A 5-g subsample of each soil was extracted in 50 mL of 2 mol L-1KCl solution for the colorimetric determination of ammonia(NH+4)and NO-3concentrations using the indophenol blue technique(Simset al.,1995)on a BIO-TEK EL312 microplate reader(BIO-TEK Instruments Inc.,Winooski,USA).Soil moisture content was determined gravimetrically after drying at 60°C for 48 h,and then the soil water-filled pore space(WFPS)was calculated according to Linn and Doran(1984).Dried,ground soil was analyzed for total C and N concentrations on a Thermo Finnigan Flash EA 1112 CN analyzer(Carlo Erba,Milan,Italy).
The DEA was determined by adding C and N sources to reach the maximum denitrification rate,according to Druryet al.(2007).Briefly,25 g of soil sample was placed in a 250-mL flask,and 25 mL of solution containing 300 mg of glucose-C kg-1soil and 50 mg NO-3-N kg-1soil was added.The flask was closed with a rubber stopper,flushed with argon gas for 30 min,and 10%of the headspace(about 21.5 mL)was replaced with acetylene.The flasks were placed in a rotary shaker during gas sampling.At 1,2,3,and 5 h,9 mL of headspace gas was transferred into a 5.9-mL vacuumed exetainer(Labco,High Wycombe,UK)with an extra Teflon/silicone septum(National Scientific,Rockwood,USA).The N2O concentration was analyzed with a gas chromatograph(Model 6890,Hewlett Packard,Avondale,USA)equipped with an HP-PLOT/Q column(32.5 m×535μm×40.0μm,Agilent Technologies Inc.,Santa Clara,USA)and detected with a micro-electron capture detector at 300°C.The carrier gases were helium at 4.0 mL min-1and ultra-high-purity N at 15.0 mL min-1.The production of N2O-N from each flask at each sampling time was calculated according to Druryet al.(2007),and DEA was determined from the slope of the line of best fit calculated when plotting N2O-N production against time.
DNA extraction
Soil samples for DNA extraction were selected to represent a range of seasonal changes in soil WFPS(Table I).Soil DNA was extracted using the PowerSoil®DNA isolation kit for soil(MO BIO Laboratories,Inc.,Carlsbad,USA)according to the manufacturer’s instructions,and the DNA concentration of each extract was determined with a Nano-Drop 2000 spectrophotometer(Thermo Fisher Scientific,Marietta,USA).
Detection of bacterial genes by polymerase chain reaction(PCR)
Conventional PCR was performed to detect the bacterial 16S rRNA,nirS,andnosZgenes in soil samples.Bacterial denitrifiers(as opposed to fungal denitrifiers)were the focus of our study because denitrifying bacteria can tolerate flooded conditions,whereas fungal denitrifiers are obligate aerobes(Zhouet al.,2001)and generally catalyze some—but not all—steps in the denitrification reaction(Shounet al.,1992).Denitrifying bacteria also outcompete fungal denitrifiers in soils with near-neutral pH(Heroldet al.,2012),and our study site had a soil pH of 7.1.We did not amplifynirK,an analogous gene tonirSthat is responsible for encoding nitrite reductase,because thenirS-containing bacteria are more widespread and can reflect the denitrification potential of bacteria in various soils(Donget al.,2009;Huanget al.,2011;Nebertet al.,2011).The DNA amplification was performed with a Veriti thermocycler(Applied Biosystems,Foster City,USA).Each PCR reaction consisted of 1×PCR buffer(20 mmol L-1Tris-HCl,pH 8.4,50 mmol L-1KCl,Invitrogen/Life Technologies,Carlsbad,USA),0.2 mmol L-1deoxynucleotide(dNTP)mixture(Invitrogen/Life Technologies),1.5 mmol L-1MgCl2,0.4μmol L-1of each forward and reverse primers(AlphaDNA,Montreal,Canada)(Table II),1.25 units ofTaqDNA polymerase(Invitrogen/Life Technologies),20 ng of template DNA extracted from each soil sample,and nuclease-free water in a final volume of 25μL.The positive control for the reaction confirmed that 0.4μmol L-1was the optimal concentration for all gene primers(Table II),and a no-template negative control was run for each gene primer(Table II)to ensure no contamination.The presence of PCR inhibitors in the soil samples was tested by a serial dilution of the soil DNA extract.No inhibition was detected in any case.Each assay contained a positive control,no-template negative control,and soil DNA.
The PCR programs were based on the instructions ofTaqDNA polymerase,with modification:5 min of initial denaturation at 95°C;35 cycles of 30 s at 95°C(denaturing),40 s at the annealing temperature for the primers(annealing),and 72°Cfor 1 min(extension);and a final extension of 7 min at 72°C.The PCR products were detected and analyzed on 2%agarose gels by electrophoresis according to Chénier and Juteau(2009).
Standard curve for real-time PCR(qPCR)
The positive controls were also used to generate standards to determine the gene copies in the soil DNA samples.Each target gene was amplified by conventional PCR using the reaction mixture,programs,and thermocycler as described above.These amplicons(standards)were gel-purified using the QIAEX.2 gel extraction kit(Qiagen Inc.,Toronto,Canada).The concentration of each standard was determined with a NanoDrop 2000 spectrophotometer,and the gene copy number(copiesμL-1)of each standard was calculated according to Malornyet al.(2003).Serial 5-fold dilutions of each standard were prepared to generate an eight-point standard curve.
Quantification of bacterial genes by qPCR
All qPCR reactions were performed in triplicate on a Stratagene Mx3005P qPCR system with MxPro software version 4.10(Agilent Technologies).Reactions consisted of 1X Brilliant III Ultra-Fast SYBR Green qPCR Master Mix(Agilent Technologies)and 0.4μmol L-1of each forward and reverse primer pair,which are the same as those for the conventional PCR(Table II),20 ng of template DNA,and nuclease-free water in a final volume of 20μL.The PCR program was as follows:5 min of initial denaturation at 95°C and 40 cycles of 30 s at 95°C(denaturing),40 s at the annealing temperature for the primers(annealing),and 72°C for 1 min(extension).A dissociation curve was obtained at the end of each PCR reaction,with the protocol of 1 min at 95°C,30 s at 55°C,and 30 s at 95°C.The single peak of the dissociation curve indicated the specificity of the PCR products.Each assay contained a serial standard dilution(for the standard curve),soil DNA,and no-template negative controls.The quantification ofnosZandnirShad a lower detection limit of 100 copies per assay,and the quantification of 16S rRNA had a lower detection limit of 1 000 copies per assay.The number of copies of each target gene in soil DNA extracts was determined by comparing the cycle threshold of the samples with the standard curve using MxPro software(Agilent Technologies).
Statistical analyses
The DEA and bacterial gene copy numbers were logtransformed to satisfy the assumption of normality and homoscedasticity of the residuals.The main effects of sampling date(time)and sampling location(with or without flooding)on soil moisture,soil inorganic N concentrations,DEA,and bacterial gene copy numbers were analyzed by two-way analysis of variance(ANOVA)with a general linear model in SAS version 9.3(SAS Institute,USA).Least-squares mean values of significant(P<0.05)main effects and interactive effects were compared with a Tukey-Kramer test.Since the residuals of the earthworm population and biomass data were not normally distributed,the Wilcoxon scores(posthocWilcoxon signed-rank test)for the effects of time and flooding on earthworm population and biomass were calculated using the non-parametric NPAR1 WAY procedure.Spearman’s correlation was used to evaluate associations between earthworm communities,moisture,inorganic N,and denitrifier activities in soil.Stepwise multiple linear regression was used to determine how DEA was related to soil and earthworm variables.

TABLE IIOligonucleotide primers,annealing temperatures(AT),and positive control strains or plasmids used in conventional polymerase chain reaction(PCR)and real-time PCR for the detection of bacterial genes in the temporarily flooded and non-flooded riparian soils from southern Quebec,Canada at nine sampling dates from May to October 2012
RESULTS
Selected environmental factors
The soil moisture at individual sampling points ranged from 20%to 100%WFPS,with average values of 29%—88%WFPS in the temporarily flooded and non-flooded soils during the study(Table I).At a given sampling date,the soil moisture was always lower in the non-flooded soil than in the temporarily flooded soil(Table I).Extractable N concentrations did not vary seasonally,although the NH+4-N concentration was,on average,1.4 times lower(P=0.001)in the temporarily flooded soil than in the non-flooded soil(data not shown).
Earthworm diversity,populations and biomass
Earthworms collected from the temporarily flooded soil belonged to nine species,and most of them were endogeic species(Table III).The average earthworm population in the temporarily flooded soil was 336 individuals m-2,which was 4.6 times larger(P<0.001)than that in the non-flooded soil.There were 6.2 times more(P<0.05)epigeic species,5.8 times more(P<0.05)endogeic species,and 2.2 times more(P<0.05)anecic species in the temporarily flooded soil than in non-flooded soil(Table III).Average earthworm biomass was 5 times greater(P<0.001)in the temporarily flooded soil(11.1 g AFDW m-2)than in the non-flooded soil(2.23 g AFDWm-2)(Table IV).Compared to the nonflooded soil,there was 5.6 times more(P<0.05)biomass of epigeic species,5.6 times more(P<0.05)biomass of endogeic species,and 3.1 times more(P<0.05)biomass of anecic species in the temporarily flooded soil.
Denitrification enzyme activity and bacterial gene copy numbers
The DEA fluctuated temporally(Fig.1).The greatest DEA of 1.45μg N2O-N g soil-1h-1(P<0.001)was measured in the fall flooding season(September and October),followed by that(0.899μg N2O-Ng soil-1h-1)in the spring flooding season(May)and that(0.468μg N2O-N g soil-1h-1)in the drought season(June to August).There was no difference(P>0.05)in DEA between the temporarily flooded and non-flooded riparian soils.
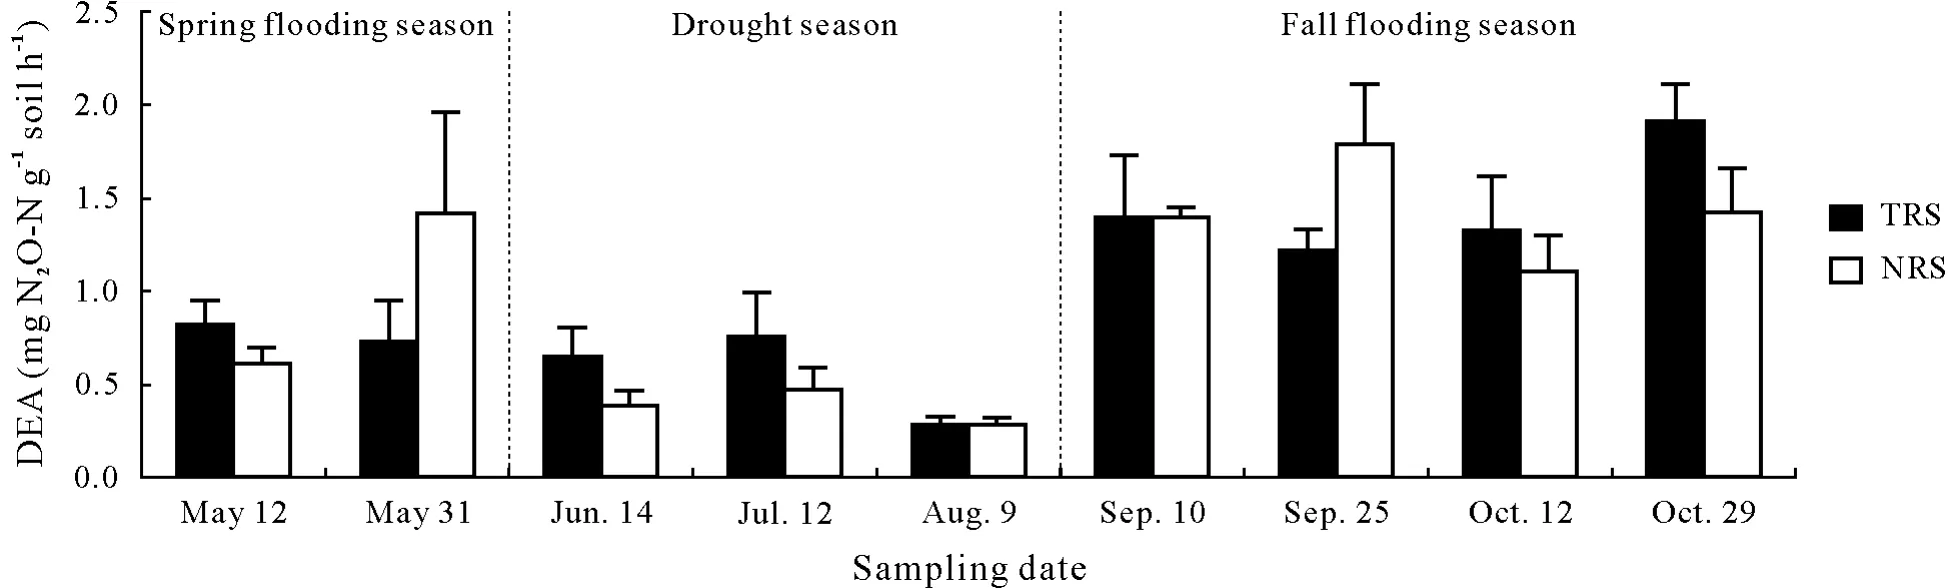
Fig.1 Denitrification enzyme activity(DEA)in the temporary flooded riparian soil(TRS)and the non-flooded riparian soil(NRS)from southern Quebec,Canada at nine sampling dates from April to October 2012.Values are means with standard errors shown by vertical bars(n=72).There were significant differences(P<0.05)between seasons(fall flooding season>spring flooding season>drought season),but there was no significant difference(P>0.05)between TRS and NRS on each sampling date,according to a post-hoc Wilcoxon signed-rank test.
Neither time nor flooding had a significant(P>0.05)influence on 16S rRNA gene copies(Fig.2).Overall,thenirSgene copy number was significantly affected by time(F=99.8,P<0.001),followed by time×flooding(F=9.95,P<0.001).At two of the five sampling dates,nirSgene copies were 2.7—3.4 times lower(P<0.05)in the temporarily flooded soil than in the non-flooded soil,andnosZgene copies varied significantly(P<0.05)with time(Fig.2).
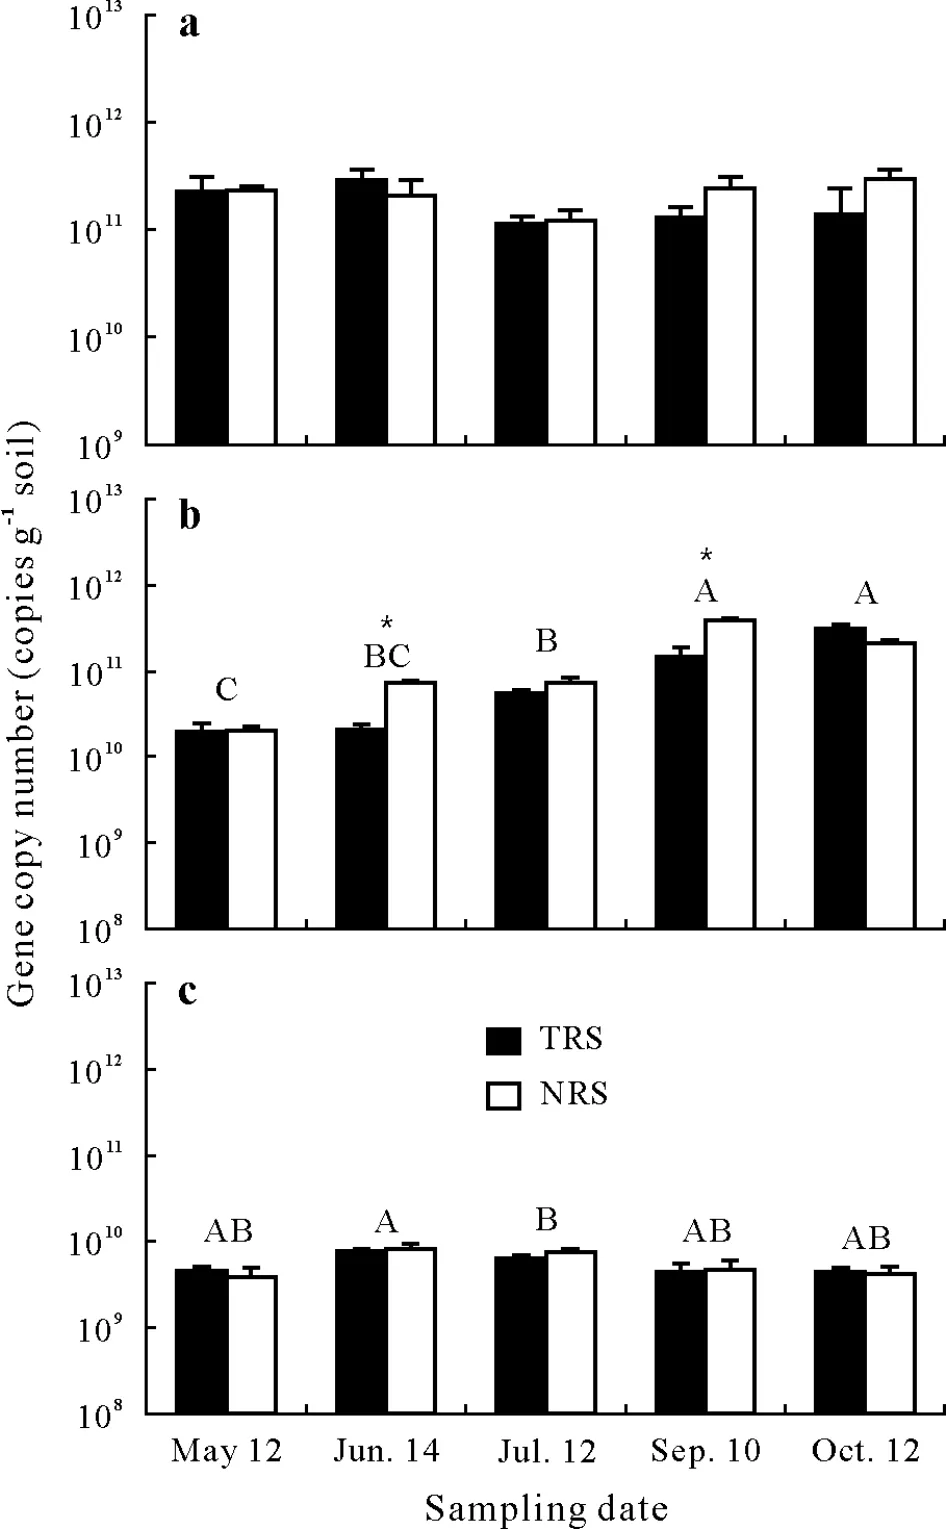
Fig.2 Bacterial 16S rRNA(a),nirS(b),and nosZ(c)gene copy numbers in the temporary flooded riparian soil(TRS)and the non-flooded riparian soil(NRS)from southern Quebec,Canada at six sampling dates from April to October 2012.Values are means with standard errors shown by vertical bars(n=72).Different capital letters indicate significant difference between sampling dates,while an asterisk(*)within each sampling date indicates significant difference between TRS and NRS,according to a post-hoc Wilcoxon signed-rank test.
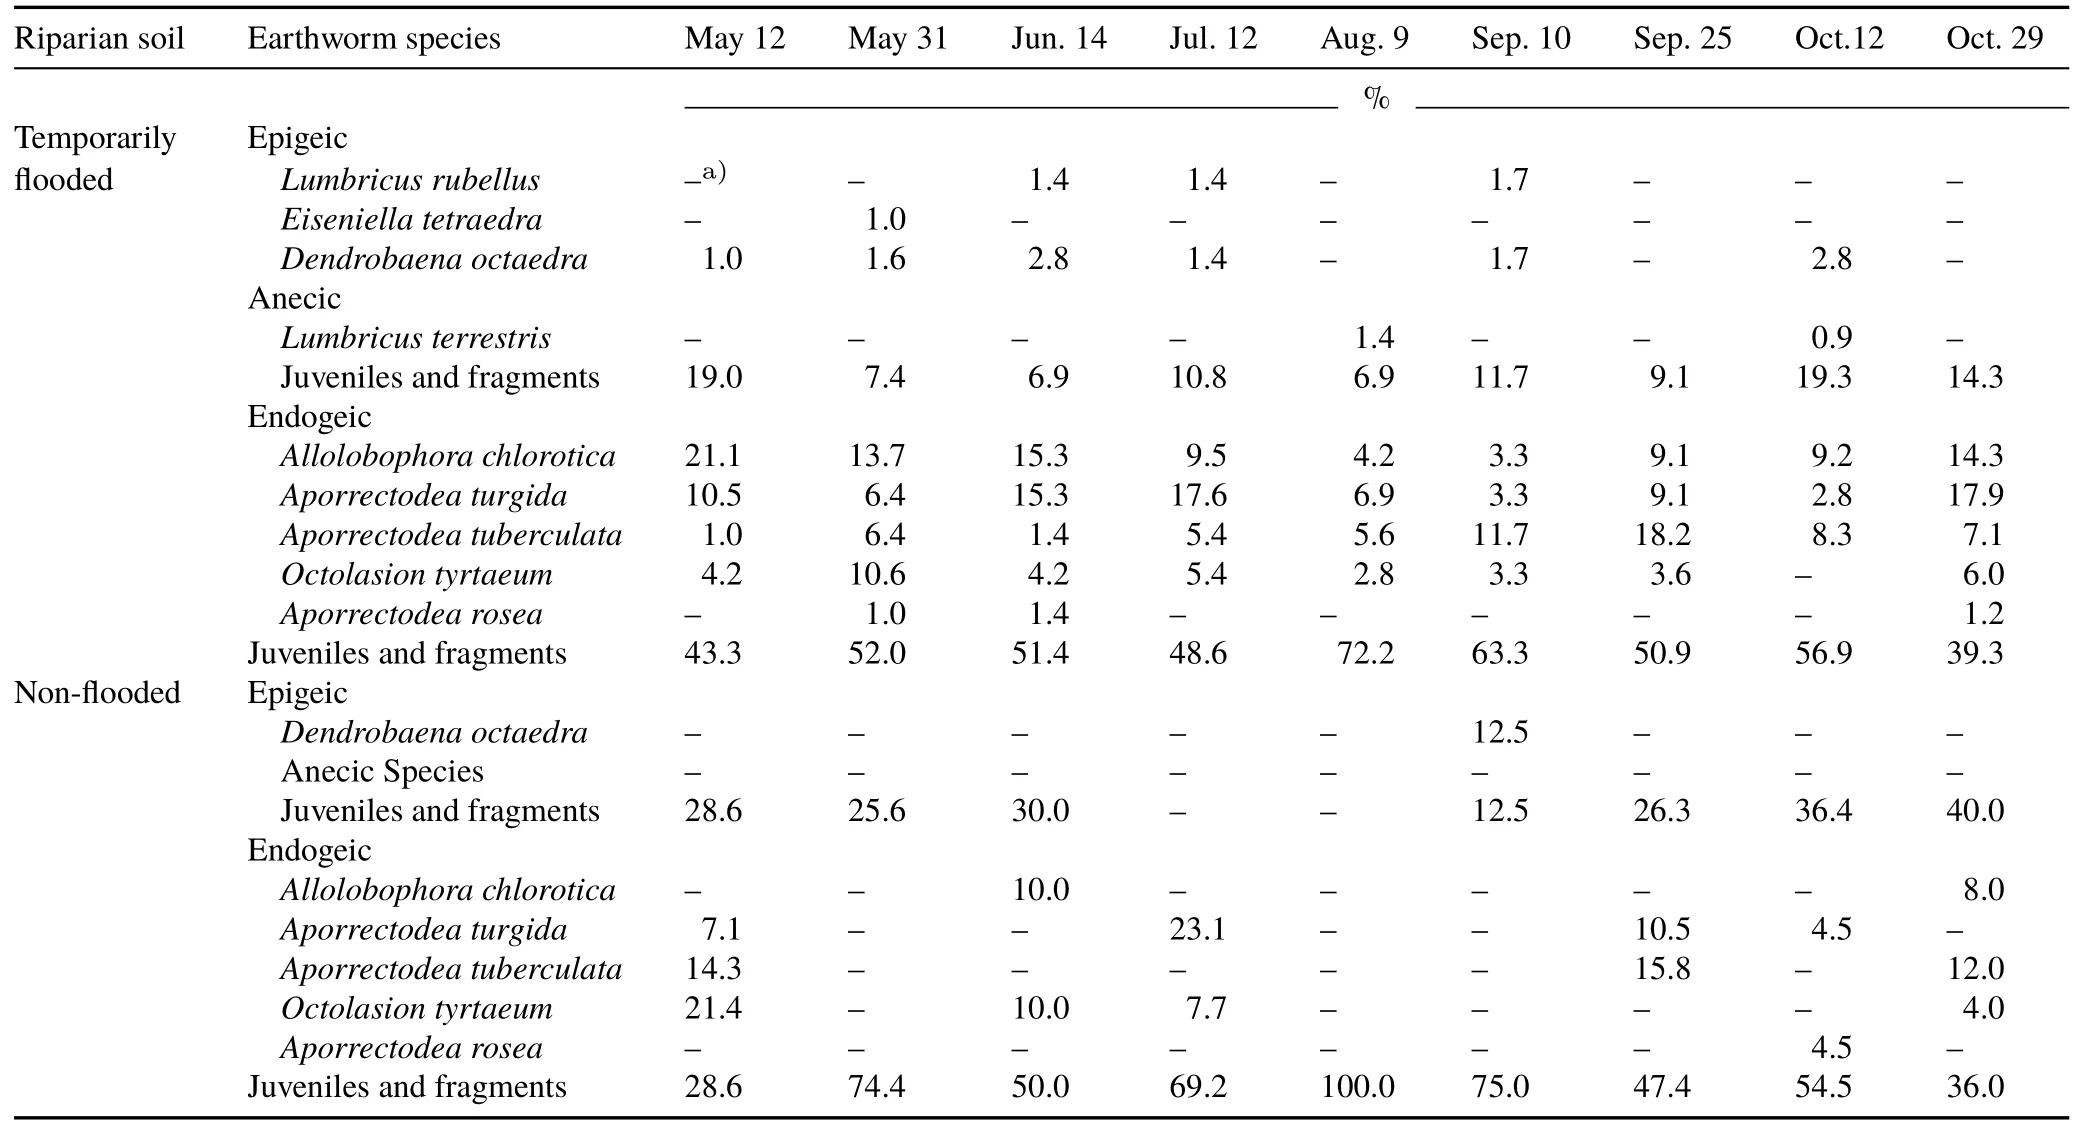
TABLE IIIPercentages of earthworm species,as well as juveniles and fragments,in the total earthworm population in each functional group(endogeic,epigeic,and anecic)in the temporarily flooded and non-flooded riparian soils from southern Quebec,Canada at nine sampling dates from May to October 2012
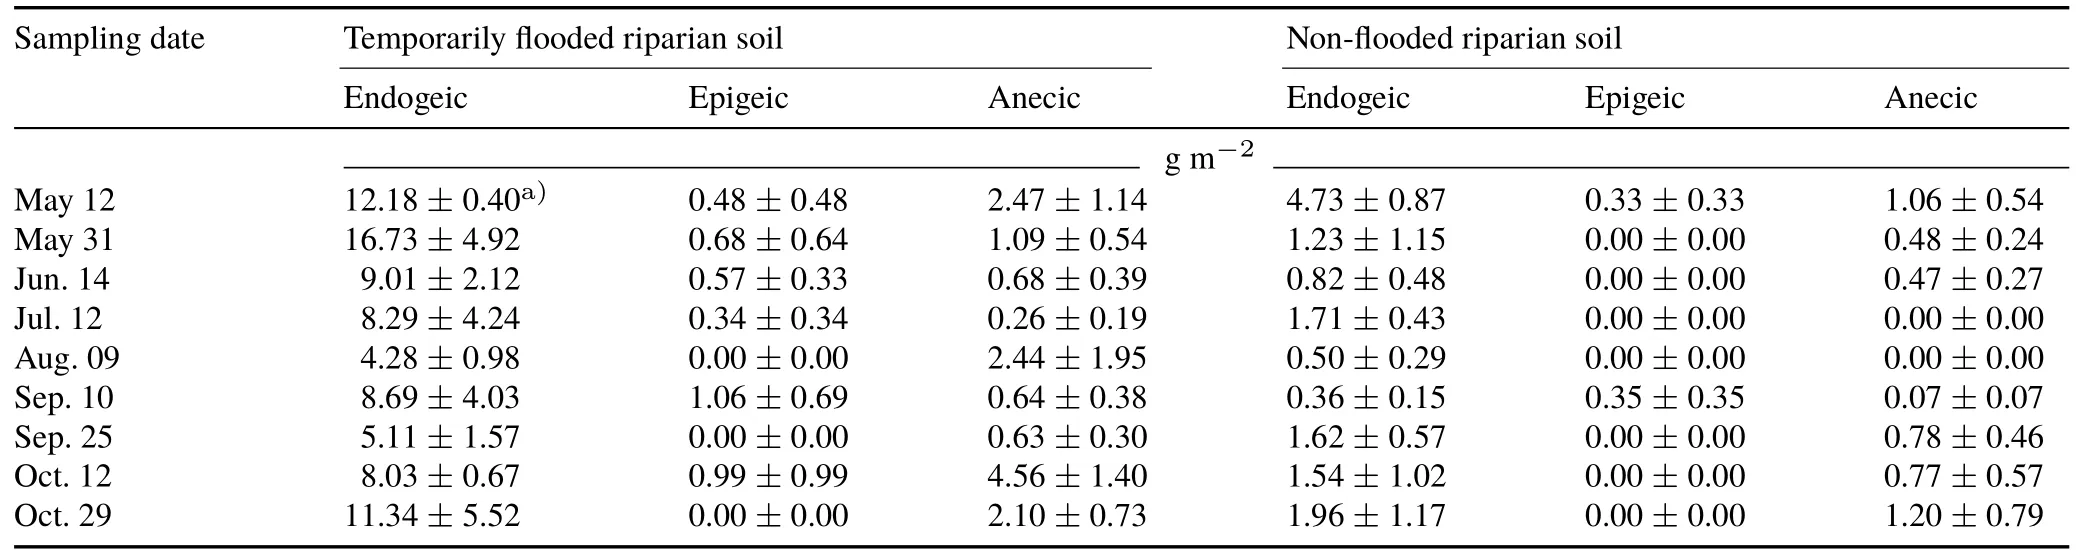
TABLE IVAverage ash-free dry weights of the three earthworm functional(endogeic,epigeic,and anecic)groups in the temporary flooded and non-flooded riparian soils from southern Quebec,Canada at nine sampling dates from May to October 2012
Relationships among environmental factors,earthworms,and denitrifying bacteria
Significant positive correlations were observed for i)DEA with WFPS,nirSgene copies,and endogeic earthworm biomass,ii)16S rRNA withnosZgene copies,iii)nosZgene copies with soil C:N ratio,iv)epigeic earthworm biomass with inorganic N(NH+4-N+NO-3-N),anecic earthworm biomass,and total earthworm biomass,and v)total earthworm biomass with inorganic N(Table V).Significant negative correlations were observed for i)DEA with 16S rRNA,ii)16S rRNA with epigeic earthworm biomass,iii)nosZgene copies with epigeic earthworm biomass,and iv)endogeic earthworm biomass with soil C:N ratio and total earthworm biomass.
A stepwise multiple linear regression procedure was used to determine the contributions of earthworm and other soil parameters to DEA of the temporarily flooded and nonflooded riparian soils during this study(P<0.05).Two of the best fit models for DEA included the soil moisture(WFPS),soil inorganic N concentration,soil C:N ratio,endogeic earthworm biomass and population and epigeic earthworm biomass and population(Eqs.1 and 2).Data were from all sampling dates(72 observations)in Eq.1(R2=0.257,P=0.003):
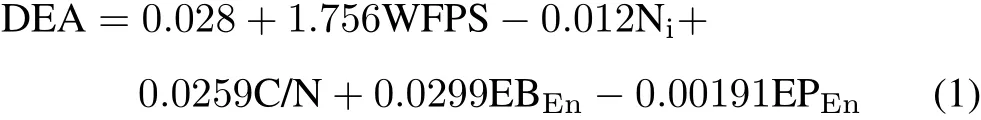
where Niis the soil inorganic Nconcentration,C/Nis the soil C:N ratio,and EBEnand EPEnare the endogeic earthworm biomass and population,respectively.Data were from five sampling dates(May 12,June 14,July 12,September 10,and October 12,2012;40 observations)in Eq.2(R2=0.664,P<0.001):
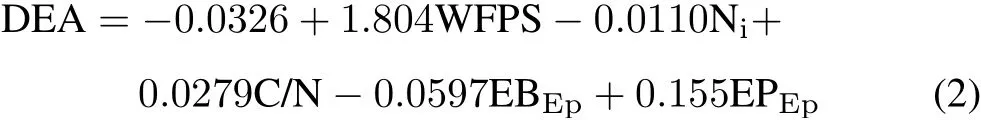
where EBEpand EPEpare the epigeic earthworm biomass and population,respectively.
We also found that bacterial gene copies could explain some of the variation in DEA in the temporarily flooded and non-flooded riparian soils at five sampling dates(May 12,June 14,July 12,September 10,and October 12,2012;40 observations)(R2=0.621,P<0.001):
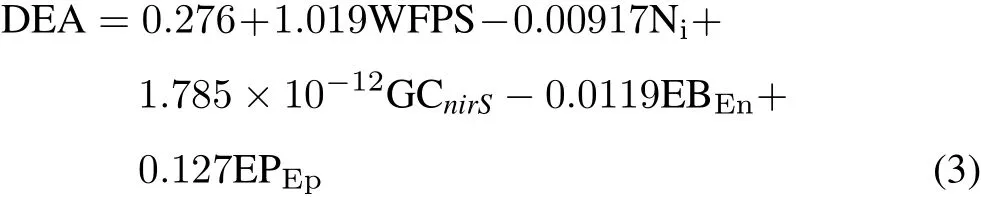
where GCnirSis thenirSgene copy number.
DISCUSSION
Earthworm populations in riparian buffers
The nine earthworm species collected in this study are among the 19 exotic lumbricid species found in Quebec,Canada(Reynolds and Reynolds,1992;Reynolds,2010).The epigeic speciesEiseniella tetraedraandLumbricus rubelluswere unique to the temporarily flooded riparian soil,probably because they thrive in moist habitats such as lake shores and stream banks(Reynolds,1977).Another moisture-loving earthworm species,Allolobophora chlorotica,an endogeic species,also reached high populations in the temporarily flooded riparian soil,accounting for 13%—56%of the total adult earthworms.However,this earthworm species was hardly found in the non-flooded riparian soil.These results are consistent with earthworm surveys along the Saint Laurence River in Quebec,Canada(Reynolds,1976;Reynolds and Reynolds,1992).
Some earthworm species found in the riparian buffer of this study,such asAporrectodea turgida,Aporrectodea tuberculata,andLumbricus terrestris,were less dependent on soil moisture for their survival,but still thrived in moist habitats.TheAporrectodeaspp.,which are in the endogeic functional group,accounted for 30%—68%of the adult earthworms in the temporarily flooded soil and 0%—100%of the adult earthworms in the non-flooded soil.The only anecicearthworm found in this study,L.terrestris,was only found in the temporarily flooded soil.These three earthworms are widespread in Quebec and are most often found in forested hills(Mooreet al.,2009),agroecosystems(Whalen,2004;Eriksen-Hamelet al.,2009),and riparian buffers(Reynolds and Reynolds,1992;Bradleyet al.,2011).The riparian buffer in this study had an upland forest component that supportedDendrobaena octaedra,an epigeic species that has been reported to be abundant in the forest ecosystems of Quebec,Canada(Reynolds,1977;Mooreet al.,2009),and this species likely migrated or was transported into the riparian buffer through runoffor overland flow.

TABLE VSpearman correlation coefficients(r)among denitrification enzyme activity(DEA),bacterial gene copy numbers,earthworm biomass,and other selected properties,water-filled pore space(WFPS),inorganic N(NH+4-N+NO-3-N),and C:N ratio,of the flooded and non-flooded riparian soils from southern Quebec,Canada at five sampling dates(May 12,June 14,July 12,September 10,and October 12,2012)a)
Earthworm populations ranged from 0 to 768 individual m-2in the riparian soils of this study.Juveniles accounted for 53%—79%in the temporarily flooded soil and 57%—100%in the non-flooded soil,which is consistent with other earthworm surveys in temperate regions(Whalenet al.,1998;Whalen,2004).Seasonal dynamics in earthworm numbers and biomass were attributed to fluctuations in soil moisture and temperature as well as natural variations in immigration,emigration,births,and deaths among the soils.The earthworm biomass and population levels peaked in May and declined during the hotter,drier summer months.These results are consistent with the observation that earthworms are often the most active in spring and fall in temperate ecosystems(Curryet al.,1995;Whalen,2004).Aside from the temporal variation in earthworm population,the sampling location in the riparian buffer strongly influenced the earthworm population(on average 346 individuals m-2in the temporarily flooded soil and 71 individuals m-2in the non-flooded soil),which could be linked to differences in soil hydrology,vegetation,and organic matter between the temporarily flooded and non-flooded riparian soils(Whalenet al.,1998;Plum,2005).In addition,there were more earthworms in the temporarily flooded riparian soil in our study(on average 386 individuals m-2in October)than in other riparian strips in this region in October(11—165 adult individuals m-2,Bradleyet al.,2011).However,the earthworm population in the non-flooded soil(on average 94 individuals m-2in October)was in accordance with the results of Bradleyet al.(2011).Our earthworm population was also smaller than that in the soil of a Dutch floodplain(on average 904 individuals m-2,Zornet al.,2005).
Earthworm functional groups are related to denitrifier activity in riparian buffers
Although we found that the whole earthworm community did not affect denitrifier activity,we observed that specific earthworm functional groups were associated with active denitrifier bacteria.The epigeic earthworm biomass was significantly and positively correlated to 16S rRNA andnosZgene copy numbers,and the endogeic earthworm biomass was positively correlated with the DEA.Stepwise multiple regression analysis confirmed that endogeic and epigeic earthworm groups were related to the DEA in the temporarily flooded and non-flooded riparian soils,along with soil moisture and inorganic N concentration.This is consistent with other studies that showed a stimulatory effect of earthworms on denitrification,leading to N2Oemission of up to 2 520μg N2O-Nd-1g-1soil in the laboratory(Rizhiyaet al.,2007;Speratti and Whalen,2008;Giannopouloset al.,2010;Nebertet al.,2011),up to four times greater denitrification rates in a simulated riparian stream(Costello and Lamberti,2008),and approximately four times greater cumulative N2O emission(up to 8.12 N2O-N m-2)in a managed grassland in fall(Lubberset al.,2013a).
To the best of our knowledge,this is the first study to highlight the association between earthworm functional groups and bacterial denitrifiers in riparian buffers under field conditions.This association may be in part because the soil conditions that trigger denitrification,such as high soil moisture,are also favorable for the reproduction and growth of these earthworm functional groups.However,there are many reasons why endogeic and epigeic earthworms are associated with higher bacterial denitrification activity in this context.For example,the earthworm gut is an anaerobic environment that supports a variety of microorganisms capable of producing N2O through denitrification(Hornet al.,2006).Abundant earthworm populations also recycle mineral Nthrough earthworm Nexcretion/secretion or earthworm death(Whalenet al.,2000),providing a source of inorganic N(available substrate)for soil denitrifiers.Endogeic and epigeic earthworms inhabit surface soil,which is where bacterial denitrifiers are more abundant and active.Additionally,endogeic earthworms have an indirect effect on the soil structure through burrowing and casting activities,which could influence water flow and create anaerobic microsites that are a preferred habitat for bacterial denitrifiers.The impacts of earthworm-created biostructures on soil structure and hydrology in relation to denitrification have been reported in laboratory incubations(Giannopouloset al.,2010)and simulated riparian streams(Costello and Lamberti,2008,2009).Lubberset al.(2013a)found a large effect of the epigeic earthwormL.rubelluson N2O under managed grassland,which was partially attributed to the restructuring of the soil environment.However,endogeic earthworms may be more influential than epigeic earthworms because of their larger body size and geophagous feeding habit that create a more extensive network of burrows and surface/subsurface casts(Whalenet al.,2004).The importance of biostructures created by endogeic earthworms for denitrifiers could be a fruitful avenue for future research,particularly under field conditions.
Temporal factors rather than spatial factors overrule denitrification in riparian soils
Stepwise multiple regression consistently showed that DEA was related to soil moisture,inorganic N concentration,and earthworm functional groups(particularly the endogeic earthworms).Soil moisture significantly affected DEA,which was also observed in the strong positive correlation between these variables throughout this study.In a managed grassland,Lubberset al.(2013a)suggested that moisture was the key factor controlling the N2O flux in fall,but in spring,the key factor was temperature.Soil inorganic N concentration and,to a lesser extent,soil C:N ratio,represent the available substrates.In the natural riparian buffer of our study,available substrates came from local vegetation and upstream N input,which was further controlled by the plantgrowing season and seasonal flooding events.Denitrifiers apparently had no substrate limitation,based on the consistency in DEA and denitrifier gene copies(nirSandnosZ),in both the temporally flooded and non-flooded riparian soils.Denitrifier bacteria,like those in earthworms,were more responsive to temporal than spatial factors in the specific riparian buffers.
CONCLUSIONS
The temporarily flooded riparian soil supported approximately 12 times greater population and biomass of earthworms than the riparian soil that was not flooded.This demonstrates the importance of seasonal fluctuations in soil moisture to the abundance and diversity of earthworms in riparian areas.Our work on the temporal dynamics of earthworm population and denitrifying activity provides compelling evidence that endogeic and epigeic earthworm functional groups are associated with DEA in temperate riparian buffers.Earthworms may contribute to denitrification through their decomposition and N cycling activities as well as by providing favorable microsites(in the gut,burrows,and casts)for denitrifiers.Consequently,the denitrification potential of riparian buffers can be attributed,in part,to interactions among earthworms and denitrifiers.
ACKNOWLEDGEMENTS
We would like to thank Mr.Andre Pion for granting permission to enter the riparian buffers on behalf of La Coopérative de Solidaritédu Bassin versant de la Rivièreaux-Brochets,Quebec,Canada.We would also like to thank Dr.Brian Driscoll for providing the bacterial isolates harboring thenirS,nirK,andnosZgenes.Mr.Hicham Benslim provided technical assistance with gas chromatography analysis,and Ms.Nadia Cavallin assisted with the plant survey.Funding for this work was provided by the Natural Sciences and Engineering Research Council of Canada(NSERC)(Grant#2383823-10).Chen CHEN was supported by postgraduate awards from the China Scholarship Council Joint Scholarship Program and Marian and Ralph Sketch Fellowship,McGill University,Canada.
杂志排行
Pedosphere的其它文章
- Preface Earthworms in soil ecology and organic waste management
- Letter to the Editor Field and laboratory investigations of Lumbricus badensis ecology and behaviour
- Strategies to mitigate the adverse effect of drought stress on crop plants—influences of soil bacteria:A review
- Advances in fungal-assisted phytoremediation of heavy metals:A review
- Study of oxidative stress cadmium(Cd)-induced in Eisenia fetida based on mathematical modeling
- Behavior and respiration responses of the earthworm Eisenia fetida to soil arsenite pollution