Line identification of extreme ultraviolet(EUV)spectra from low-Z impurity ions in EAST tokamak plasmas
2021-07-07LeiLI黎嫘LingZHANG张凌ZongXU许棕ShigeruMORITAYunxinCHENG程云鑫FenglingZHANG张丰玲WenminZHANG张文敏YanminDUAN段艳敏QingZANG臧庆ShouxinWANG王守信ShuyuDAI戴舒宇GuizhongZUO左桂忠ZhenSUN孙震LiangWANG王亮XiaobinDING丁晓彬JinpingQIAN钱金平HaiqingLIU刘海庆
Lei LI(黎嫘),Ling ZHANG(张凌),Zong XU(许棕),Shigeru MORITA,Yunxin CHENG(程云鑫),Fengling ZHANG(张丰玲),Wenmin ZHANG(张文敏),,Yanmin DUAN(段艳敏),Qing ZANG(臧庆),Shouxin WANG(王守信),Shuyu DAI(戴舒宇),Guizhong ZUO(左桂忠),Zhen SUN(孙震),Liang WANG(王亮),Xiaobin DING(丁晓彬),Jinping QIAN(钱金平),Haiqing LIU(刘海庆) and Liqun HU(胡立群)
1 Institute of Plasma Physics,Hefei Institutes of Physical Science,Chinese Academy of Sciences,Hefei 230031,People’s Republic of China
2 University of Science and Technology of China,Hefei 230026,People’s Republic of China
3 Advanced Energy Research Center,Shenzhen University,Shenzhen 518060,People’s Republic of China
4 Key Laboratory of Optoelectronic Devices and Systems of Ministry of Education and Guangdong Province,College of Optoelectronic Engineering,Shenzhen University,Shenzhen 518060,People’s Republic of China
5 National Institute for Fusion Science,Toki 509-5292,Gifu,Japan
6 Key Laboratory of Materials Modification by Laser,Ion and Electron Beams(Ministry of Education),School of Physics,Dalian University of Technology,Dalian 116024,People’s Republic of China
7 Key Laboratory of Atomic and Molecular Physics and Functional Materials of Gansu Province,College of Physics and Electronic Engineering,Northwest Normal University,Lanzhou 730070,People’s Republic of China
Abstract Extreme ultraviolet(EUV)spectra emitted from low-Z impurity ions in the wavelength range of 10–500 Å were observed in Experimental Advanced Superconducting Tokamak(EAST)discharges.Several spectral lines from K- and L-shell partially ionized ions were successfully observed with sufficient spectral intensities and resolutions for helium,lithium,boron,carbon,oxygen,neon,silicon and argon using two fast-time-response EUV spectrometers of which the spectral intensities are absolutely calibrated based on the intensity comparison method between visible and EUV bremsstrahlung continua.The wavelength is carefully calibrated using wellknown spectra.The lithium,boron and silicon are individually introduced for the wall coating of the EAST vacuum vessel to suppress mainly the hydrogen and oxygen influxes from the vacuum wall,while the carbon and oxygen intrinsically exist in the plasma.The helium is frequently used as the working gas as well as the deuterium.The neon and argon are also often used for the radiation cooling of edge plasma to reduce the heat flux onto the divertor plate.The measured spectra were analyzed mainly based on the database of National Institute of Standards and Technology.As a result,spectral lines of He II,Li II–III,B IV–V,C III–VI,O III–VIII,Ne II–X,Si V–XII,and Ar X–XVI are identified in EAST plasmas of which the central electron temperature and chord-averaged electron density range in Te0=0.6–2.8 keV and ne=(0.5–6.0)×1019 m-3,respectively.The wavelengths and transitions of EUV lines identified here are summarized and listed in a table for each impurity species as the database for EUV spectroscopy using fusion plasmas.
Keywords:line identification,EUV spectroscopy,EUV spectra,impurity line emissions,tokamak plasmas
1.Introduction
Magnetic-confinement fusion plasma always contains multiple kinds of impurities due to sputtering[1,2]and desorption[3]processes in the interaction between the edge plasma and material surface.The presence of impurity ions in a fusion plasma normally enhances radiation power loss and reduces the ion density of the bulk plasma,resulting in a reduction in the fusion reactivity.Spectroscopic measurements of line emissions from impurity ions are crucially important to monitor the behavior of impurities and to minimize the effects of impurities on plasma performance.In Experimental Advanced Superconducting Tokamak(EAST),molybdenum tiles have been used for the first wall since 2012,and the upper divertor has been upgraded to W/Cu monoblock since 2014,while the lower divertor is covered by graphite tiles with a SiC coating[4].The graphite guide limiter of the lower hybrid wave(LHW)antenna has consisted of tungsten since 2018.Therefore,multiple low- and high-Zimpurities exist intrinsically in EAST plasma,e.g.carbon(C,Z=6),oxygen(O,Z=8),iron(Fe,Z=26),copper(Cu,Z=28),molybdenum(Mo,Z=42)and tungsten(W,Z=74).
Wall conditioning in EAST operation is necessary to remove the residual gases,reduce edge particle recycling,minimize the low-Zimpurity content,and sustain good plasma performance.In recent years,several wall conditioning techniques in EAST plasma have been developed[5],including baking,glow discharge cleaning(GDC)/ICRF discharge cleaning using deuterium(D2)and helium(He)gases and surface coating such as boronization,siliconization and lithium coating[6].It has been proven that lithium coating is the most effective technique to reduce the hydrogen and oxygen contents and particle recycling[6,7].Although lithium coating has been performed routinely in recent studies,boronization and siliconization were previously attempted for comparison.Furthermore,ELM suppression using boron granule injection has been recently attempted in EAST[8]for comparison with the use of lithium granules[9].
The presence of impurities in plasma also has some beneficial effects,the greatest of which is volumetric power loss,which occurs either in the scrape-off layer(SOL)or near the periphery of the main plasma.Nitrogen,neon and argon,due to their short mean free path and high radiative loss rate under the divertor plasma parameters in tokamaks,are therefore widely used to dispel the heat flux prior to the divertor targets in so-called radiative divertor experiments[10–12].Recently,feedback control of neon and argon seeding has been attempted via supermolecular beam injection(SMBI)into EAST plasma to enhance the radiation power in the SOL and to realize steady-state divertor detachment[13,14].During these experiments,neon and argon are externally introduced impurities in the EAST plasma,and diagnostics of these impurities with high temporal resolution are therefore crucially important for the evaluation of their content and minimization of their effects on plasma performance.On the other hand,neon and argon transport studies can be carried out with a combination of experiments and simulations.For this purpose,the emission lines from silicon,neon and argon in similar wavelength ranges were analyzed in HL-2A[15]and LHD[16].
To monitor the impurity behavior and study the impurity transport in EAST plasma,several extreme ultraviolet(EUV)spectrometers were used to observe line emissions and profiles from highly ionized impurity ions[17,18].Two fasttime-response EUV spectrometers were used to observe the line emissions from all the low-and high-Zimpurities.It was found in previous work that the line emissions from high-Zimpurities are widely distributed in the EUV spectra,especially in the tungsten spectra.Several tungsten unresolved transition arrays(W-UTA)composed of W24+–W45+were observed at shorter wavelength ranges of 20–40 Å,45–70 Å,and 75–83 Å[18,19].Therefore,good identification of emission lines from low-Zimpurities in these wavelength ranges is expected to be very helpful for improving the accuracy of tungsten line identification.In this work,line analysis of the emission lines from He,Li,B,C,O,Ne,Si and Ar was carried out systematically.
The remainder of this paper is organized as follows:section 2 describes the characteristics of the two fast-timeresponse EUV spectrometers.Section 3 presents the results of the line analysis of EUV spectra with line emissions from He,Li,B,C,O,Ne,Si and Ar.Finally,the paper is summarized in section 4.
2.Experimental setup
All magnetic coils for the confinement of high-temperature plasmas in EAST are made of superconductor materials,so called full-superconducting tokamak,for a long sustainment of the discharge,e.g.a few minutes.Then,the tokamak discharge can be operated at a relatively high toroidal magnetic field ofBt=2.0–3.5 T,which leads to production of the high-performance toroidal plasma at high plasma current ofIp=1 MA.The toroidal plasma in EAST tokamak has a major radius ofR=1.85 m and a minor radius ofa=0.45 m.The EAST plasma performance can be increased by additional heating power input of LHW,neutral beam injection,ion-cyclotron resonance heating and electroncyclotron resonance heating[20].At present,the electron temperature and density of EAST plasmas can be varied in ranges of 0.5keV≤Te≤10 keV and 0.5×10¹⁹m-3≤ne≤7.0×10¹⁹m-3,respectively.
Recently,two fast-time-response EUV spectrometers called ‘EUV_Short’ and ‘EUV_Long’ working at 10–130 Å and 20–500 Å,respectively,were developed on EAST to observe the EUV spectra emitted from impurity ions[15–17].The line of sight(LOS)for the two spectrometers is indicated together with the EAST plasma cross section in figure 1.It could be found that both LOS pass through the core region of EAST plasma.Both spectrometers are grazing incidence flatfield spectrometers consisting of entrance slits,grating and a back-illuminated charge-coupled detector(CCD).Flat-field imaging is achieved by laminar-type varied-line-spacing concave holographic gratings with 1200(EUV_Long)and 2400(EUV_Short)grooves/mm and with incidences of 88.6°and 87°,respectively.The size of the CCD is 26.6×6.6 mm2with 1024×256 pixels.The CCD is moved by a stepping motor along the focal plane to scan the observation wavelength interval.The spectra emitted by EAST plasma are recorded by two spectrometers every 5 ms when the CCD is operated with Full Vertical Binning mode.
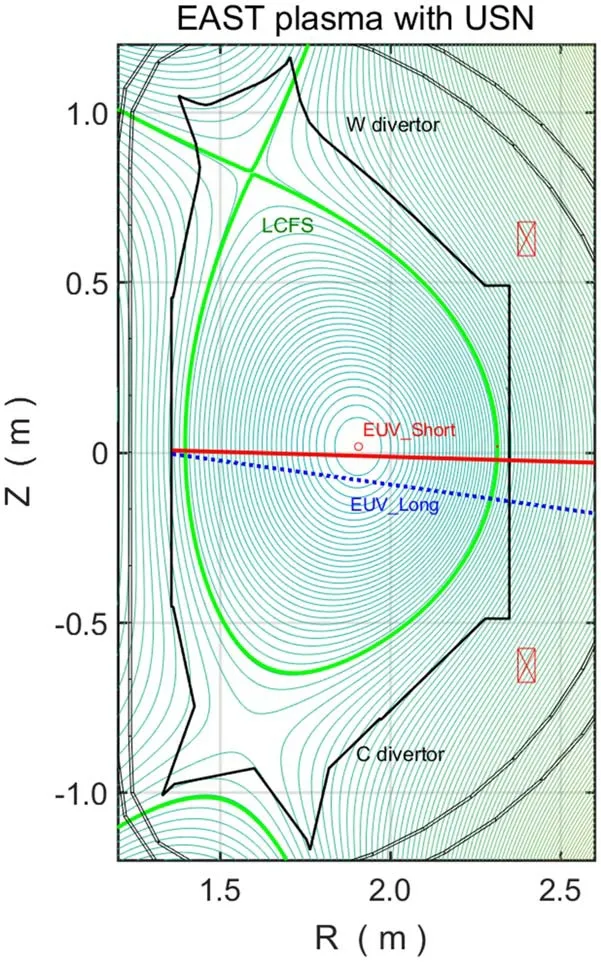
Figure 1.LOS of the two fast-time-response EUV spectrometers.(EUV_Short:red solid line and EUV_Long:blue dotted line).
The optical layouts of the two spectrometers are illustrated in figure 2.Based on the optical layouts and the grating equation[17],the first-order spectral line at wavelength of λ is focused at position ofXon the focal plan via the equation of
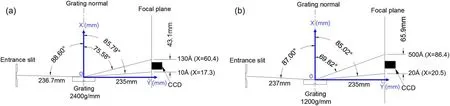
Figure 2.Top view of the optical layout of the two fast-time-response EUV spectrometers.(a)EUV_Short,(b)EUV_Long.

whered,and α stand for the grating groove spacing and the incidence angle.Meanwhile,the reciprocal linear dispersion of two spectrometers as function of wavelength,dλ/dX,is theoretically calculated with equation(1)as shown in figure 3,which is therefore used to calculate the wavelength(λcal)corresponding to each pixel on CCD sensor when one well-known spectral line is observed at particular pixel.The wavelength calibration is also performed by cubic polynomial fitting with many well-known spectral lines covering the whole observable wavelength ranges for two spectrometers.The wavelength intervals which can be simultaneously observed in one discharge vary in ranges of 42–97 Å for EUV_Short and 131–253 Å for EUV_Long respectively,depending on the wavelength to be observed.The wavelength calibration results for EUV_Short with one CCD position(8–65 Å)and EUV_Long with four CCD positions(41–195 Å,99–292 Å,190–425 Å and 245–500 Å)are illustrated in figure 4.The spectral lines used in calibration are listed in table 1 and indicated in figure 4,of which the wavelength,λ,and transitions are mainly from National Institute of Standards and Technology(NIST)database[21].Normally,the result from theoretical calculation(λcal)and cubic polynomial fitting(λexp)is used in real-time operation and post data analysis,respectively.The uncertainty of the wavelength at each pixel for different observation wavelength intervals introduced by different calibration methods,Δλ=λexp-λcal,is then studied,as shown in figure 5.The same work has been done in[22].It is found that|Δλ|≤0.03 and|Δλ|≤0.08 Å for EUV_Short and EUV_Long respectively.
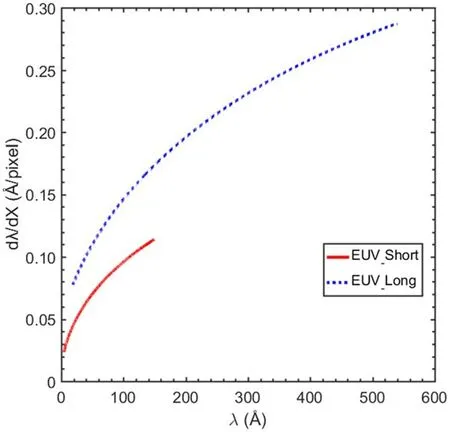
Figure 3.Reciprocal linear dispersion of two spectrometers as a function of wavelength.EUV_Short:red solid line,EUV_Long:blue dotted line.Note:26 μm pixel-1.
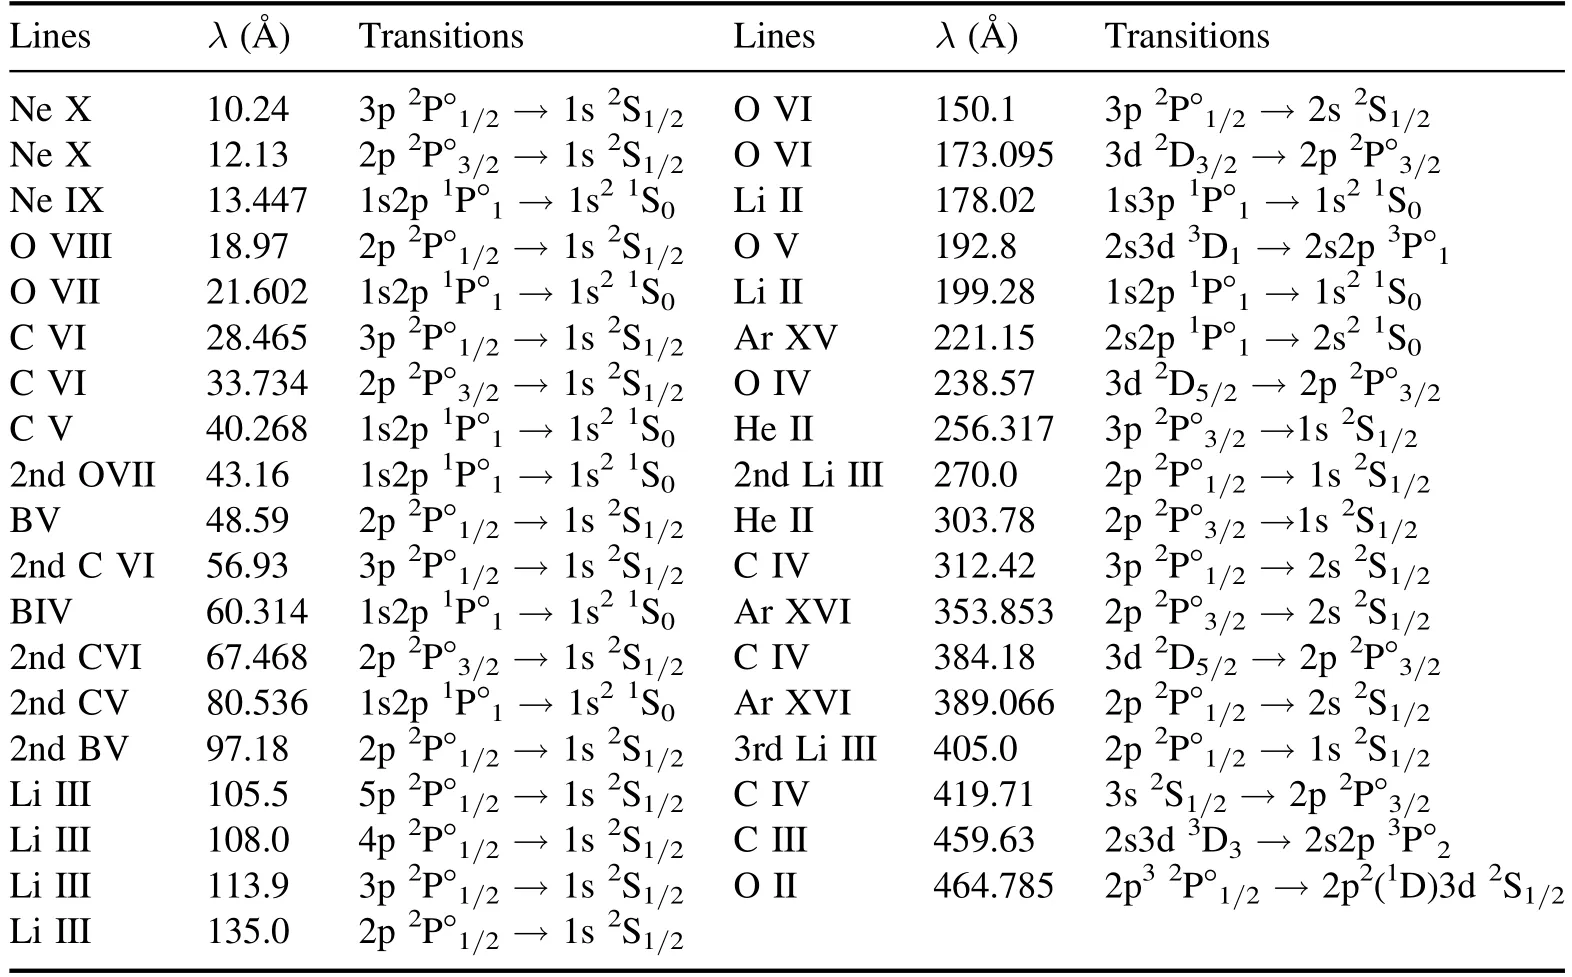
Table 1.Emission lines used in wavelength calibration.The wavelength,λ,and transitions are mainly from NIST database[21].
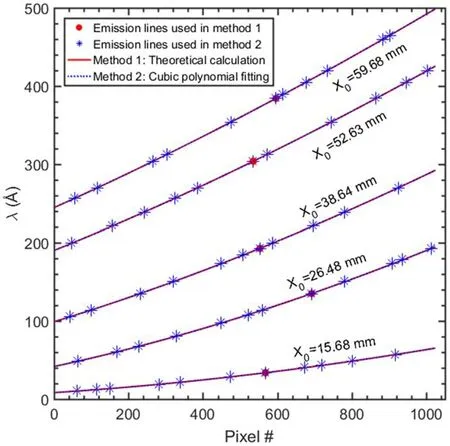
Figure 4.Wavelength calibration result with theoretical calculation(method 1,red solid line)and cubic polynomial fitting(method 2,blue dotted line)for EUV_Short with one CCD position of X0=15.68 mm(8–65 Å)and for EUV_Long with four CCD positions of X0=26.48 mm(41–195 Å),38.64 mm(99–292 Å),52.63 mm(190–425 Å),59.68 mm(245–500 Å).Emission lines used in method 1 and method 2 are indicated with red solid circle and blue stars respectively(X0:starting position of CCD sensor on the focal plane).
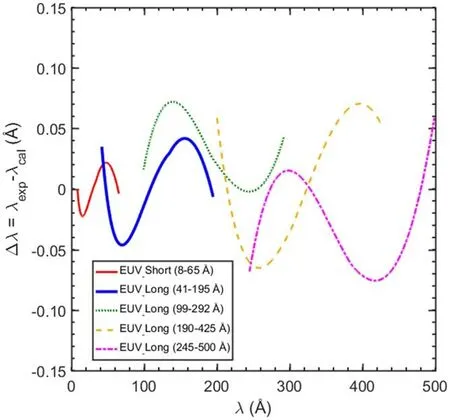
Figure 5.The uncertainty of wavelength calibration between two methods of theoretical calculation and cubic polynomial fitting using experimentally observed lines,Δλ=λexp–λcal.
In 2015 campaign,the spectral line intensities at 20–150 Å from EUV_Long were absolutely calibrated by comparing the observed and calculated intensities of EUV bremsstrahlung continua,in which the latter one is calculated with 〈Zeff〉 andZeff(r)inferred from absolute intensity measurement of visible bremsstrahlung continua at ~5230 Å[17].Then in 2018,the absolute intensity calibration was extended to 280 Å by relative intensity calibration using resonance transition doubles from Li-like and Na-like ions[23].Recently,the absolutely calibration has been extended for the spectra at 10–65 Å observed by EUV_Short and 40–500 Å observed by EUV_Long using Ohmic helium plasma with 〈Zeff〉=2.7–2.8 at high electron density of 6.5×10¹⁹m-3.The uncertainty of the absolute intensity calibration was estimated to be 30%–50%.The detailed calibration method and process could also be found in[24,25].In the following figures 6–13,the intensity of EUV spectra is indicated in the unit of ‘photons·s-1·m-2·Sr-1’,which denotes line-integral absolute intensity at each horizontal pixel(vertical pixels fully binning)of t he CCD.
3.EUV spectra and analysis
3.1.Helium(Z=2)
Figure 6 shows the EUV spectra at 190–420 Å observed for the Ohmic phase in the helium plasma discharge measured with EUV_Long.The electron temperature at the plasma center,Te0,is 0.9 keV,and the electron density,ne,is 4.7×10¹⁹m-3.As shown in figure 6,the Lyman series lines from H-like helium ions(He II)can be clearly identified at 231–304 Å with a transition from the upper energy level up ton=8.Two strong helium lines at 256.317 Å and 303.78 Å are useful for wavelength calibration at longer wavelength ranges in helium plasma discharges.The ionization energy,Ei,wavelength,λ,and transitions of all the identified helium lines from[26]and the NIST database[21]are listed in table 2.
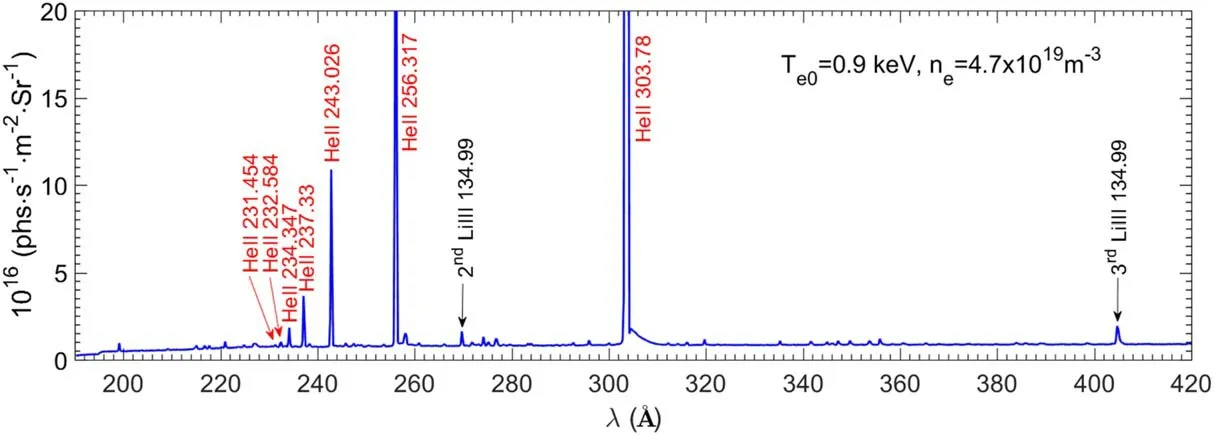
Figure 6.EUV spectra at 190–420 Å observed in the helium plasma discharge.The identified He lines are indicated in red.Te0 and ne are also indicated.

Table 2.Ionization energy,Ei,wavelength,λ,and transitions of the identified helium lines.
3.2.Lithium(Z=3)
Figure 7 shows the EUV spectra at 50–200 Å observed during the ohmic phase in the discharges with a fresh Li coating.The spectra were measured with EUV_Long.Te0andneare 1.5 keV and 0.9×10¹⁹m-3respectively.The 2nd-order line emissions from He-like and H-like carbon,C V and C VI,can be observed,as shown in figure 7.The Lyman series lines from H-like lithium ions(Li III)with transitions from upper energy level up ton=6 emitted at 100–135 Å can be identified.Three Li II lines are observed with weaker intensity in the longer wavelength range of 170–200 Å,as shown infigure 7.However,only Li III at 135.0 Å and Li II at 199.28 Å can be observed continuously during the whole discharge,and other lithium lines disappear due to the increasedTe.These two lines were therefore used to perform the wavelength calibration[20].TheEi,λ,and transitions of all the identified lithium lines from the NIST database[21]are listed in table 3.
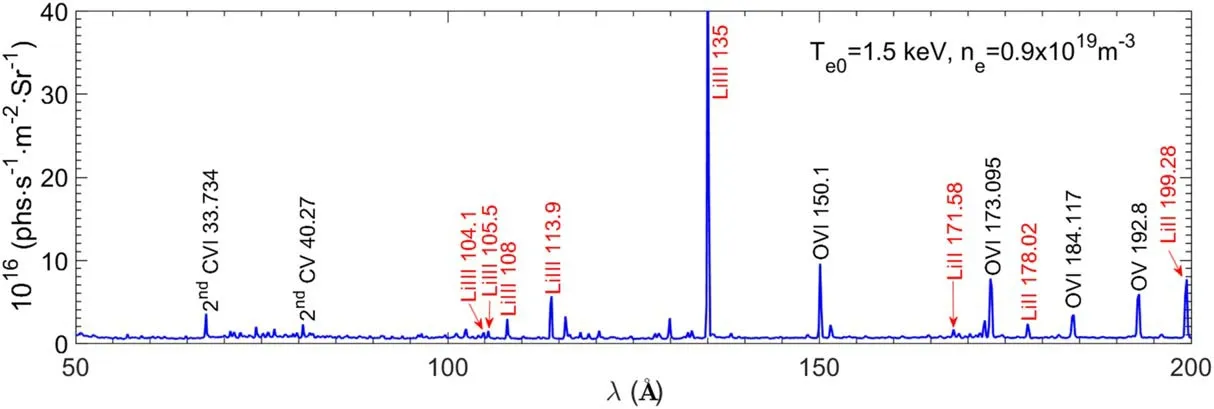
Figure 7.EUV spectra at 50–200 Å observed in the discharge after lithium wall coating conditioning.The identified Li lines are indicated in red.The central electron temperature,Te0,and averaged electron density,ne,are also indicated.
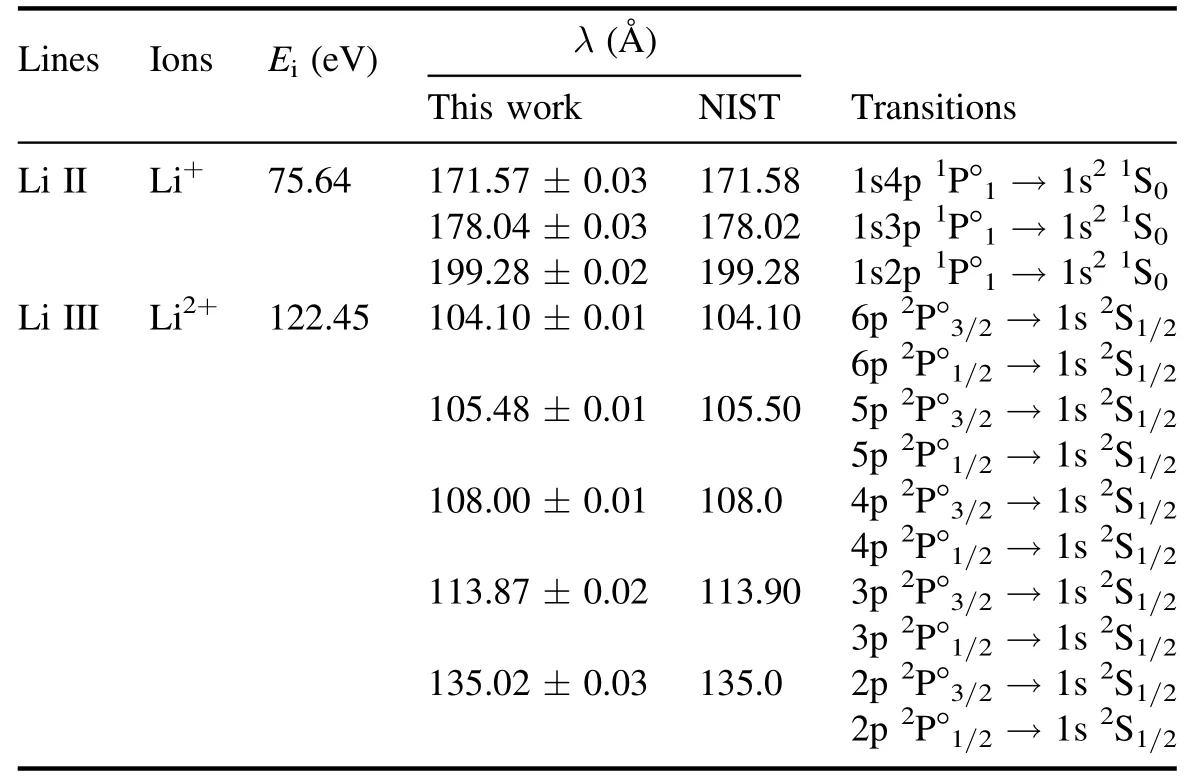
Table 3.Ionization energy,Ei,wavelength,λ,and transition of the identified lithium lines.
3.3.Boron(Z=5)
Figure 8 shows the EUV spectra at 10–200 Å observed after real-time boronization,in which the spectra at 20–45 Å and 45–200 Å were measured with EUV_Short and EUV_Long,respectively.Te0andneare 0.7 keV and 3.4×10¹⁹m-3,respectively.Figure 8(a)shows that the Lyman series lines from H-like boron ions(B V)with a transition from an upper energy level up ton=6 emitted at 37–41 Å can be identified.Emission lines from H- and He-like boron ions with transitions of 2p–1s,i.e.B V at 48.59 Å and B IV at 60.3144 and 61.088 Å,are observed with strong or saturated intensities;therefore,the 2nd- and 3rd-order lines can be clearly identified at 75–150 Å,as shown in figures 8(a)and(b).TheEi,λ and transitions of all the identified boron lines from NIST[21]are listed in table 4.
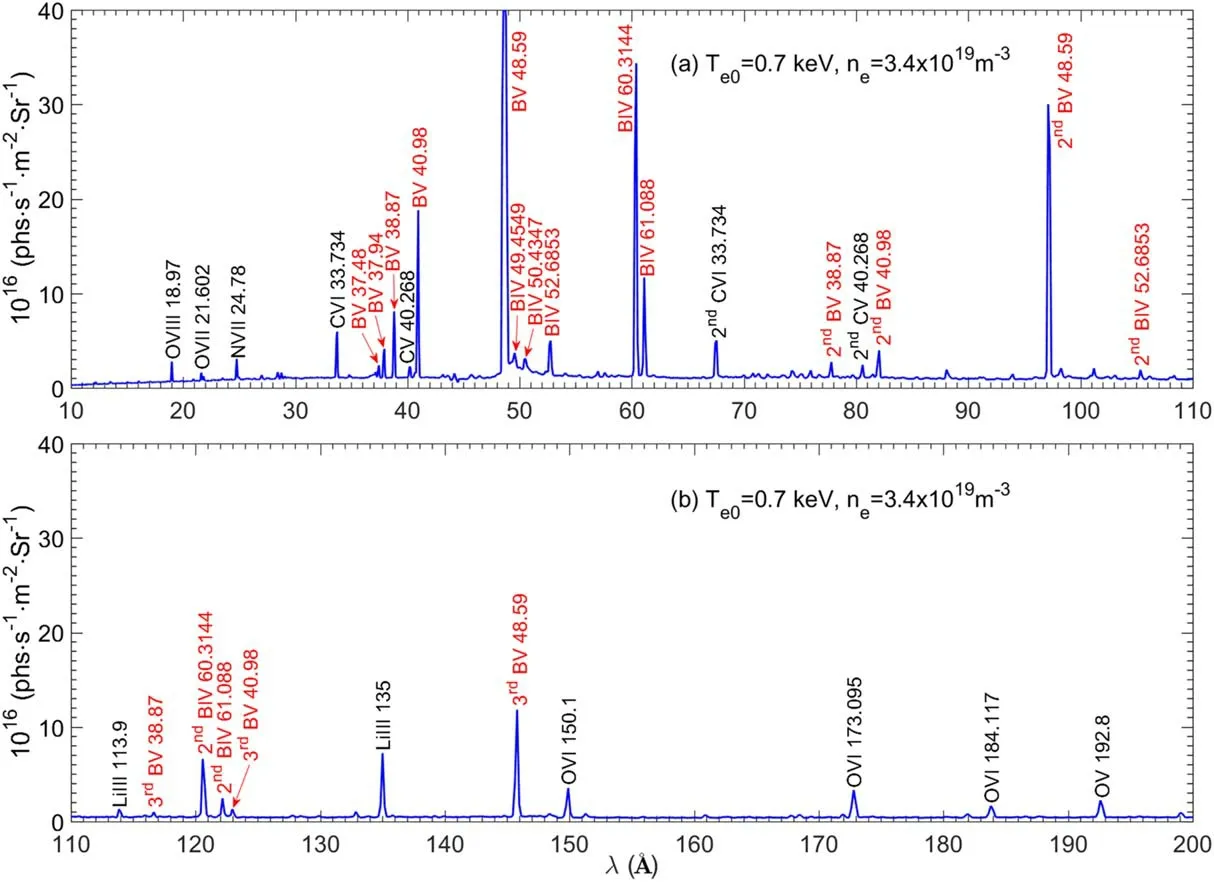
Figure 8.EUV spectra at 20–200 Å observed in the discharge after real-time boronization,(a)20–110 Å,(b)110–200 Å.The identified boron lines are indicated in red. Te0 and ne are also indicated.
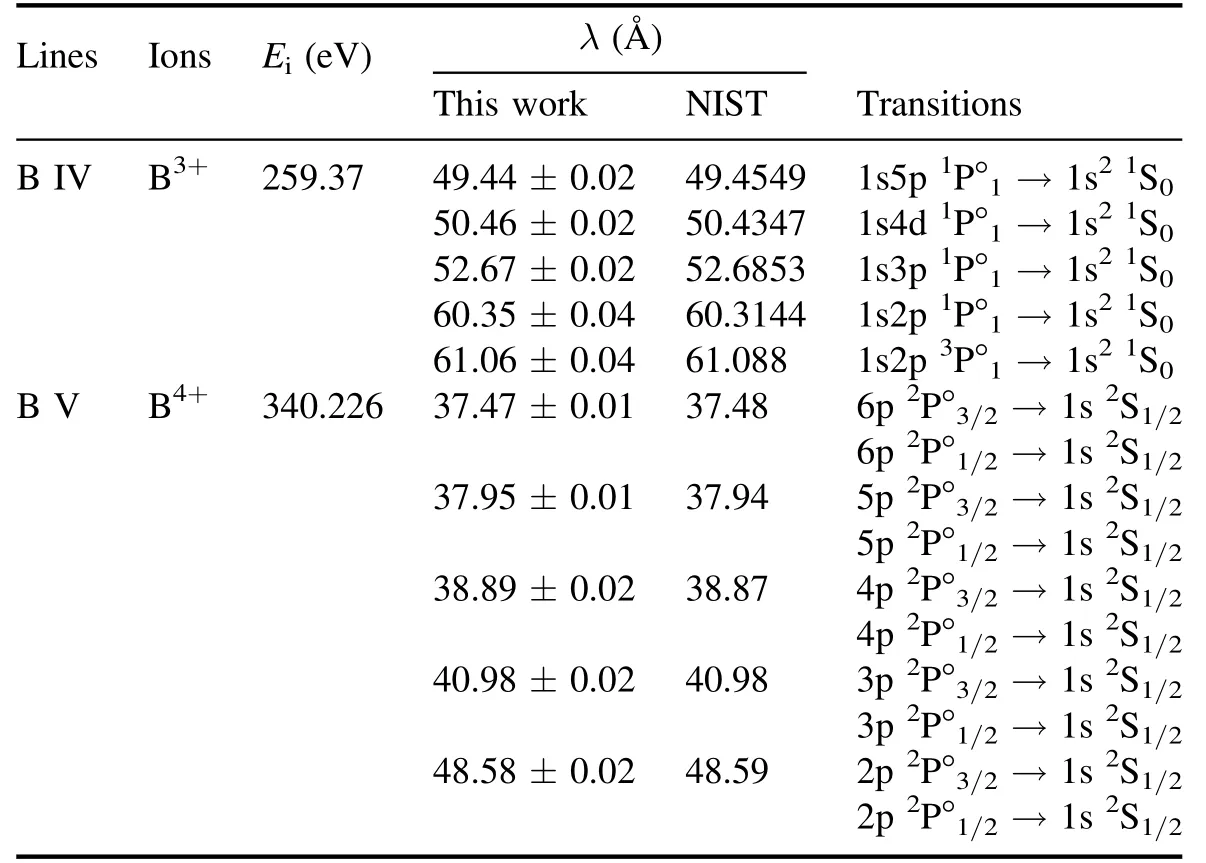
Table 4.Ionization energy,Ei,wavelength,λ,and transition of the identified boron lines.
3.4.Carbon(Z=6)
Figure 9 shows the EUV spectra at 10–500 Å observed after injecting the reciprocating probe in three L-mode discharges at different wavelength intervals.The spectra at 10–45 Å were measured with EUV_Short,and those at 45–500 Å were measured with EUV_Long.Te0,andneare 1.5 keV and(1.9–2.8)×1019m-3,respectively.The 2nd-and 3rd-order line emissions from He-like and H-like carbon ions,C V and C VI,can be observed,as shown in figure 9(a).The Lyman series lines from H-like carbon ions(C VI)with transitions at 25–35 Å and Li-like carbon ions(C IV)with transitions at 240–420 Å can be identified.TheEi,λ,and transitions of all the identified carbon lines from the NIST database[21]are listed in table 5.
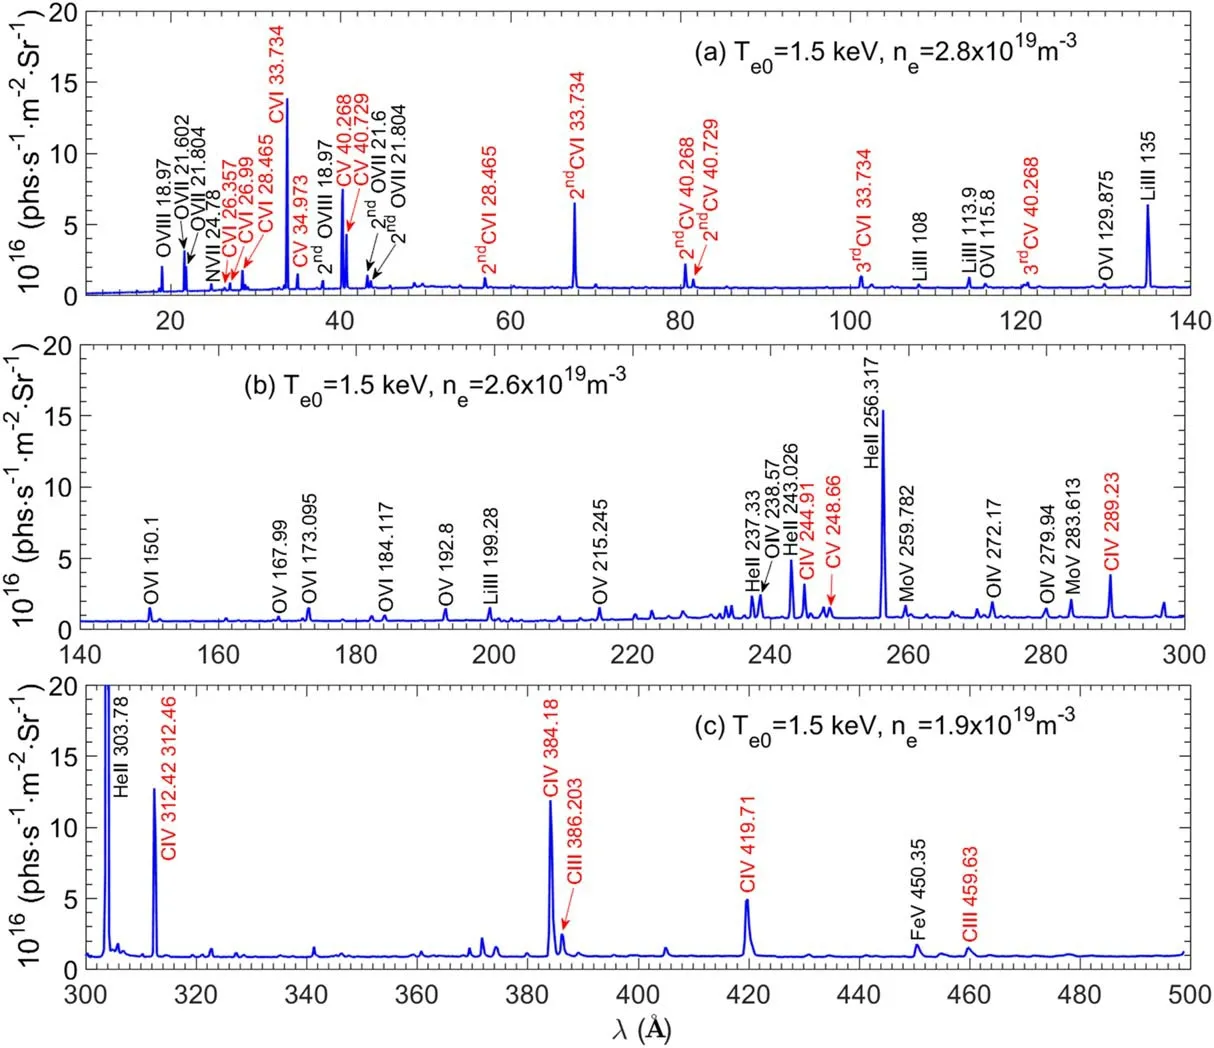
Figure 9.EUV spectra in the wavelength range of 10–500 Å observed in the plasma.(a)10–140 Å,(b)140–300 Å,(c)300–500 Å observed from EAST plasma.The identified carbon lines are indicated in red. Te0 and ne are also indicated.
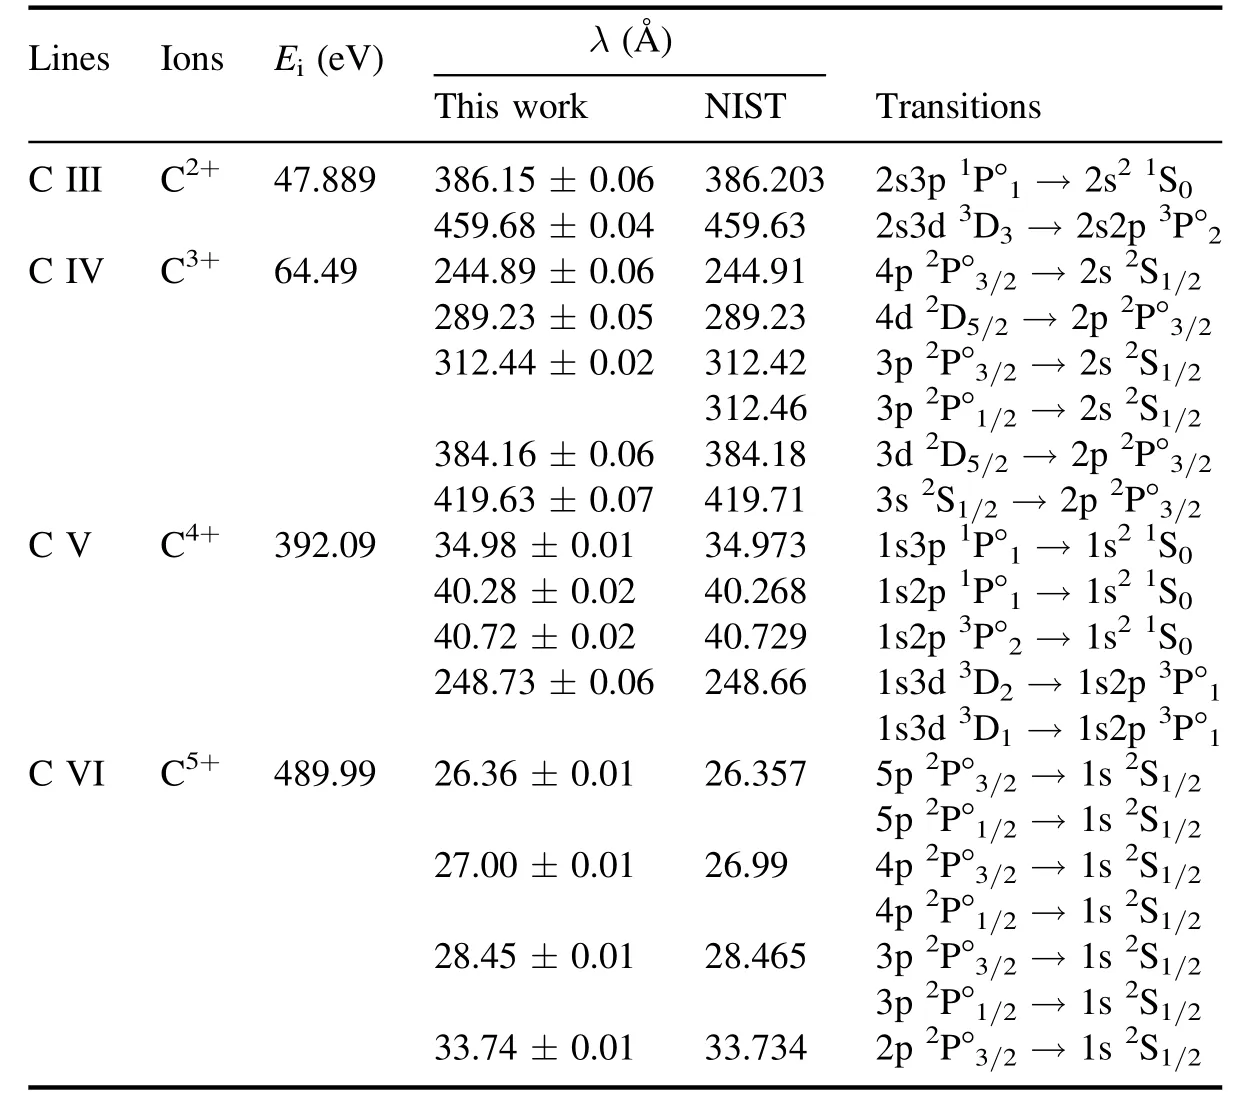
Table 5.Ionization energy,Ei,wavelength,λ,and transitions of the identified carbon lines.
3.5.Oxygen(Z=8)
Three discharges at the beginning of one experimental campaign are used to observe oxygen impurity lines due to the higher oxygen content during these discharges.The oxygen lines in the EUV spectra at 10–500 Å observed in the plasma current rampup phase were analyzed,and the results are shown in figure 10.Te0is 1.1 keV,andneis 1.0 or 2.1×10¹⁹m-3,respectively.The spectra at 10–45 Å observed with EUV_Short contain three lines with transitions of 2p–1s from He-like and H-like oxygen ions,O VII and O VIII and 2nd-order lines.The Lyman series lines from Li-like(O VI)oxygen ions at 104–185 Å are clearly identified.The lines at 150.1 Å and 173.095 Å are used to monitor oxygen impurities and perform wavelength calibration due to their high intensity.TheEi,λ,and transitions of all the identified oxygen lines from the NIST database[21]are listed in table 6.
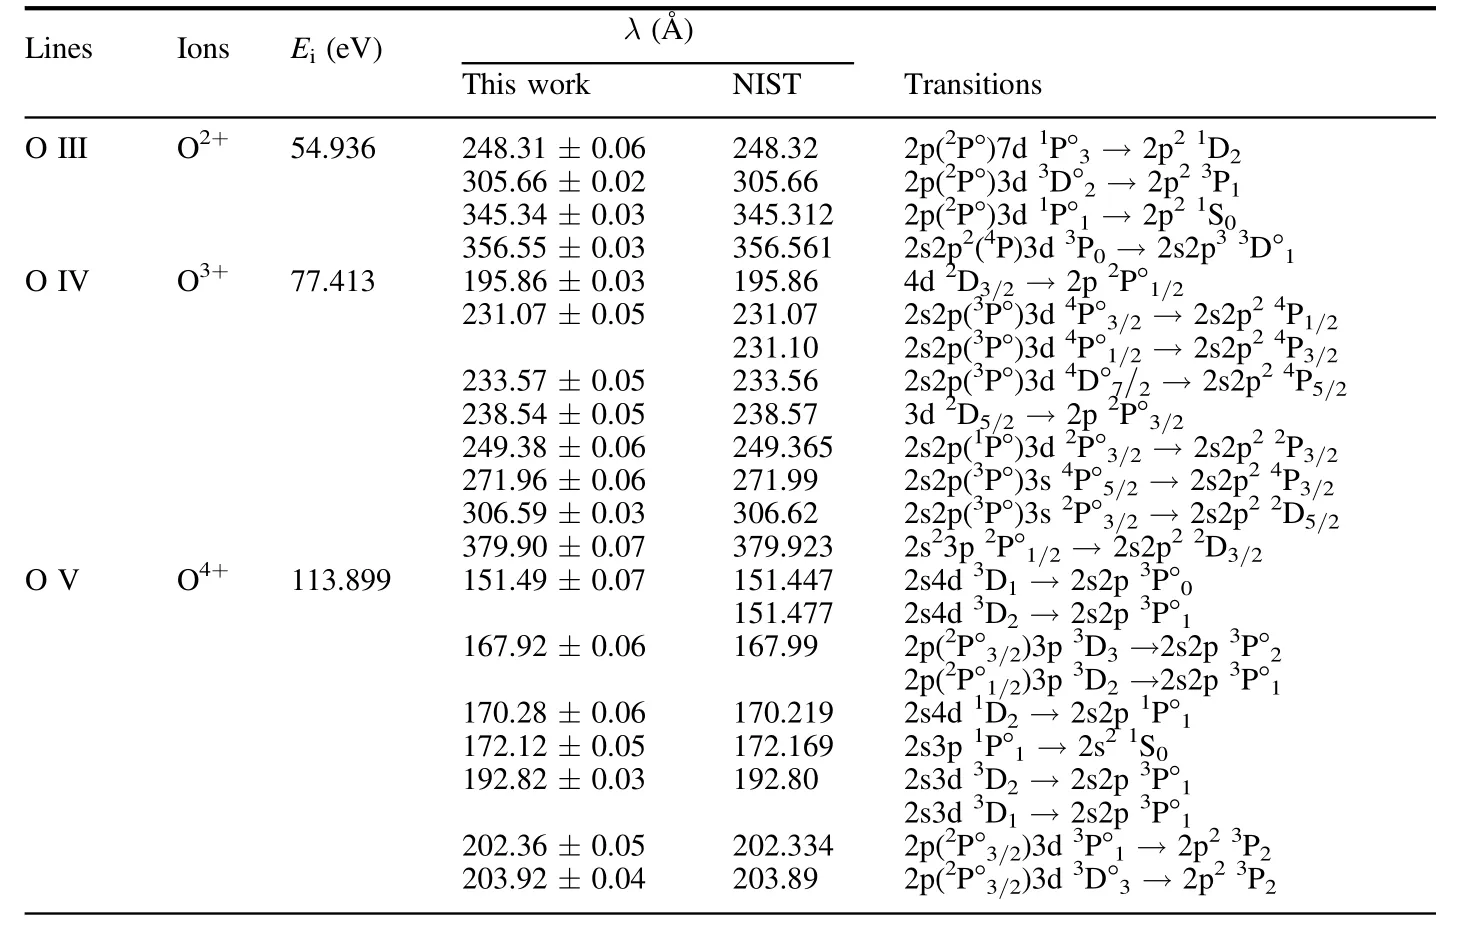
Table 6.Ionization energy,Ei,wavelength,λ,and transitions of the identified oxygen lines.

Table 6.(Continued.)

Figure 10.EUV spectra at(a)10–140 Å,(b)140–280 Å and(c)280–500 Å.The identified oxygen lines are indicated in red.Te0 and ne are also indicated.
3.6.Neon(Z=10)
The neon lines in the EUV spectra at 10–500 Å observed in the radiation divertor experiment after neon seeding were analyzed,as shown in figure 11.The spectra at 10–45 Å were obtained with EUV_Short,and the spectra at 45–500 Å were obtained with EUV_Long using three discharges.Te0is 2.5 or 2.8 keV,andneis 3.3×10¹⁹or 4.8×10¹⁹m-3.Compared with the number of oxygen lines,the number of neon lines increases substantially,e.g.more than 25 lines corresponding to the 3p–2s,3d–2p,and 3s–2p transitions of Ne IV–Ne VIII(Ei=126.247–239.097 eV)are emitted at 78–405 Å,and several lines corresponding to the 5p–2s,5d–2p,4p–2s,4d–2p and 4s–2p transitions of Ne VII–Ne VIII are emitted at 60–90 Å,while the 3p–1s and 2p–1s transitions of Ne IX(Ei=1195.81 eV)and Ne X(Ei=1362.2 eV)are emitted at short wavelength ranges of 10–14 Å,i.e.Ne IX at 11.547 and 13.447 Å and Ne X at 10.24 and 12.13 Å.It is clear that several Ne VIII lines at 88.092/88.12 Å,98.26 Å,103.09 Å and 402 Å and the Ne VII line at 106.192 Å can be used for diagnosis due to their high intensity.TheEi,λ,and the transitions of Ne X from[26]and other lines from NIST[21]are listed in table 7.
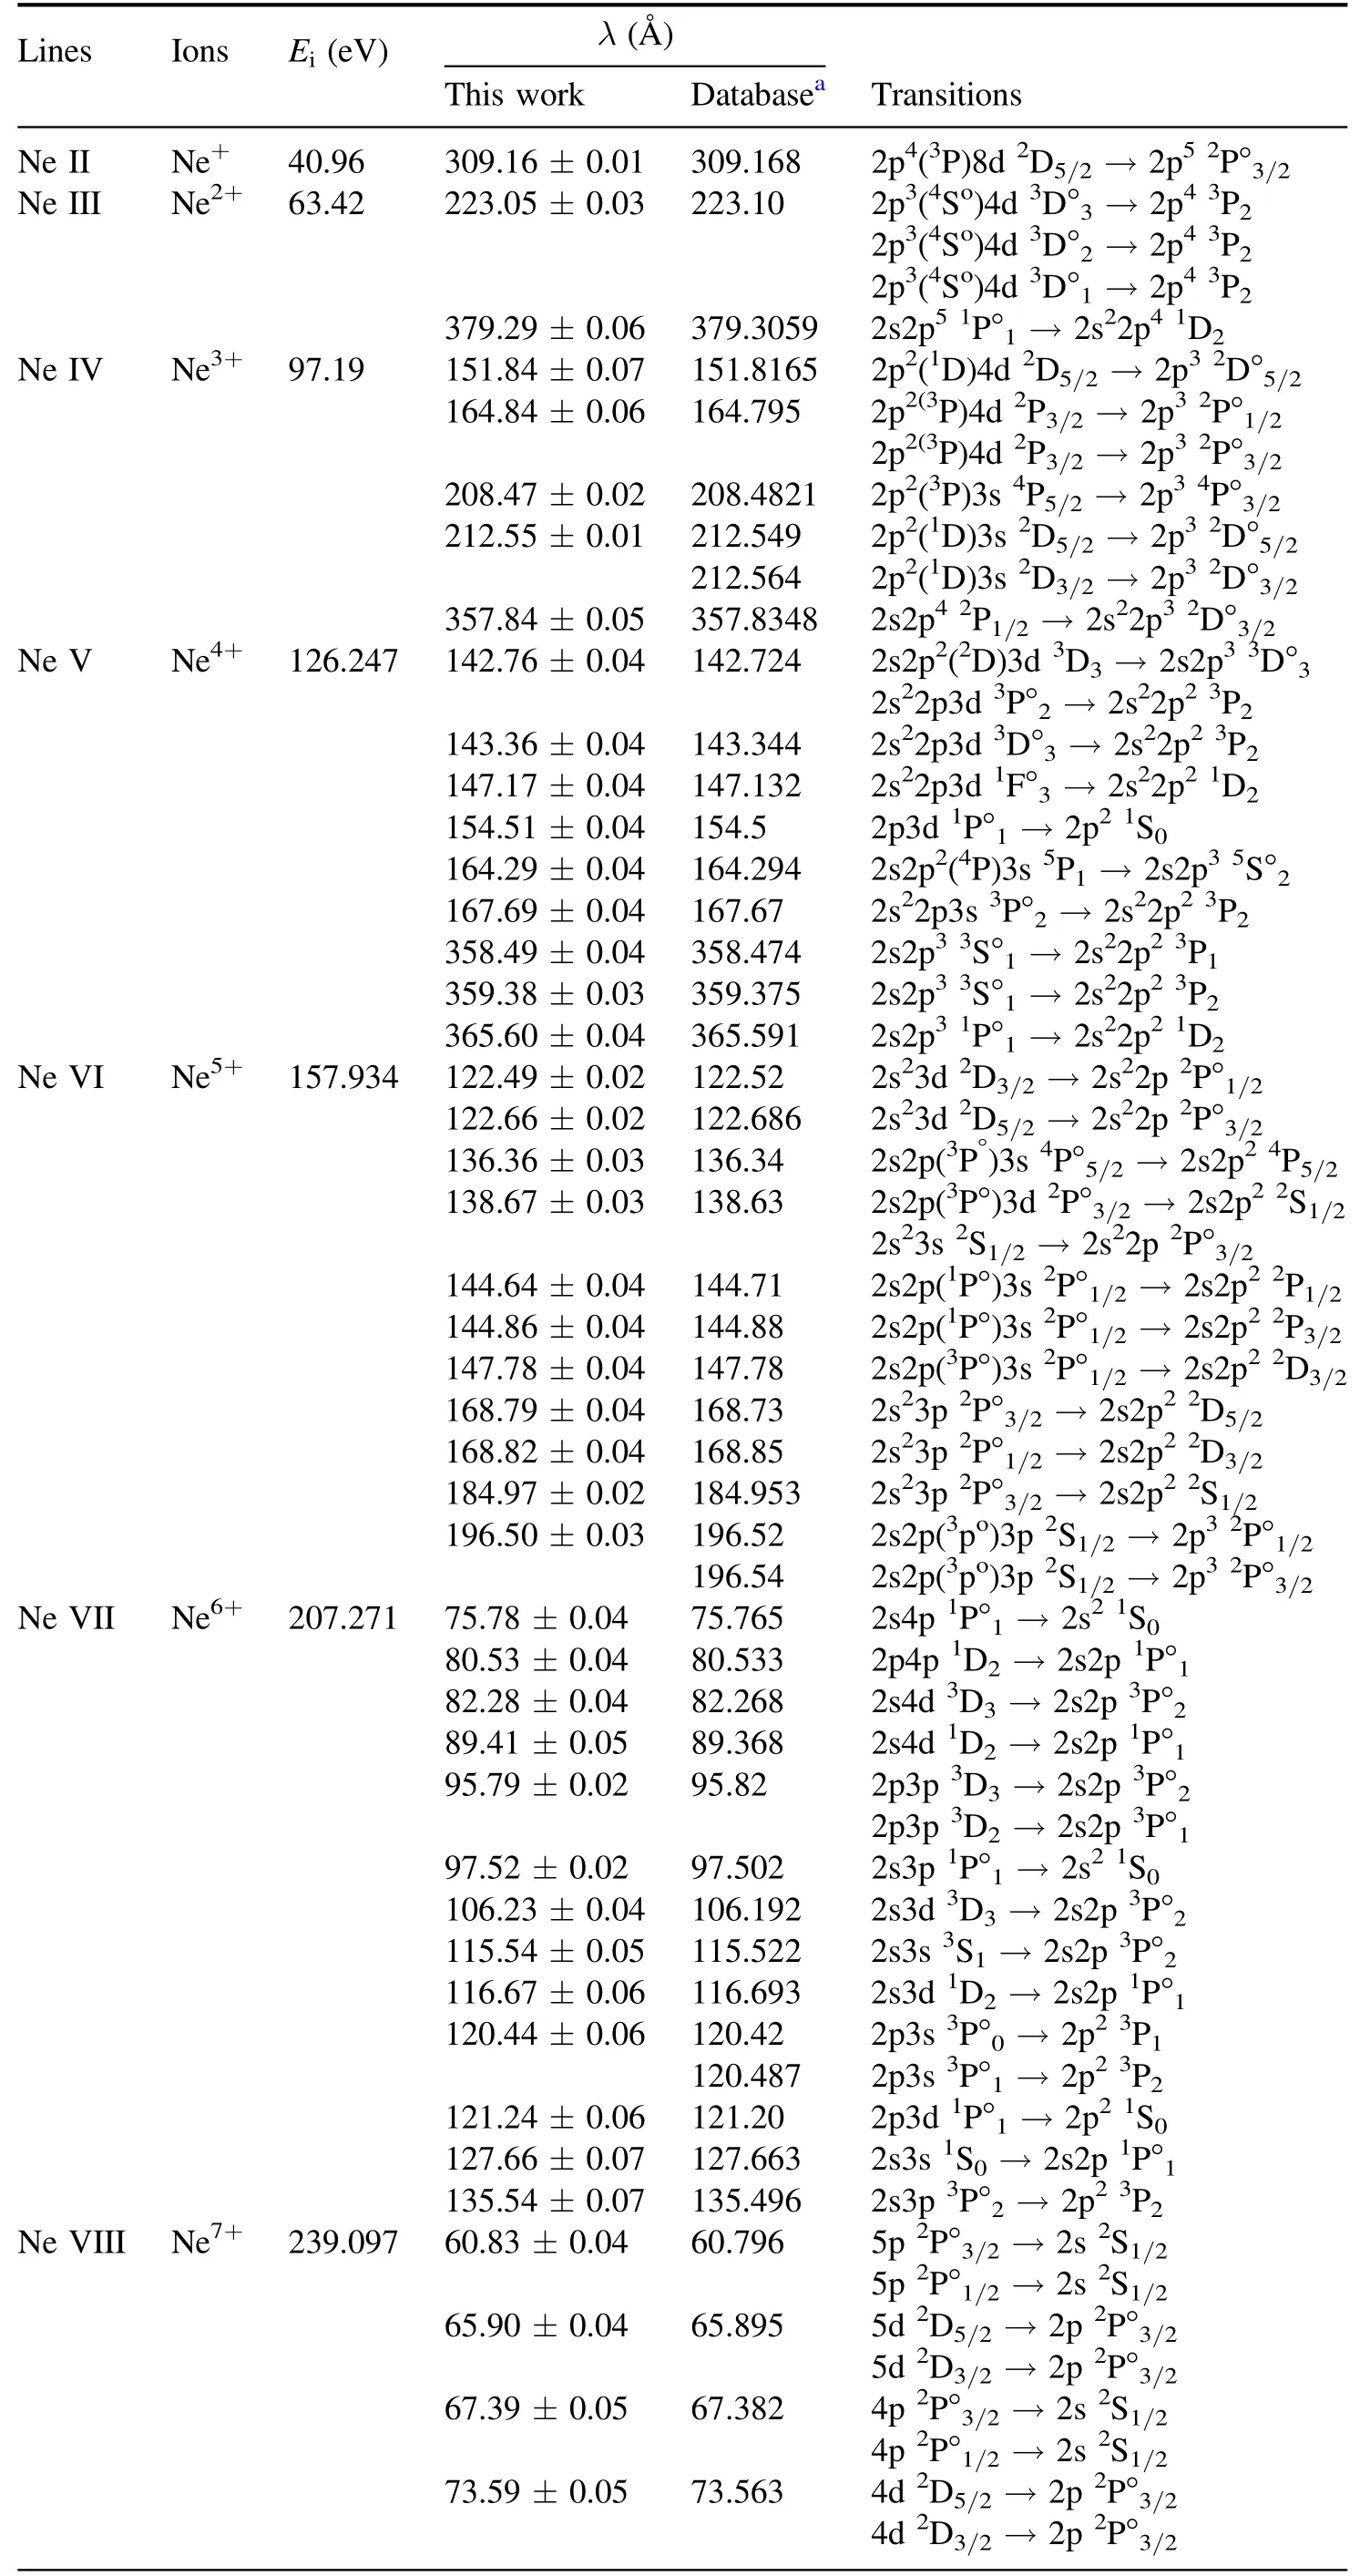
Table 7.Ionization energy,Ei,wavelength,λ,and transitions of the identified neon lines.
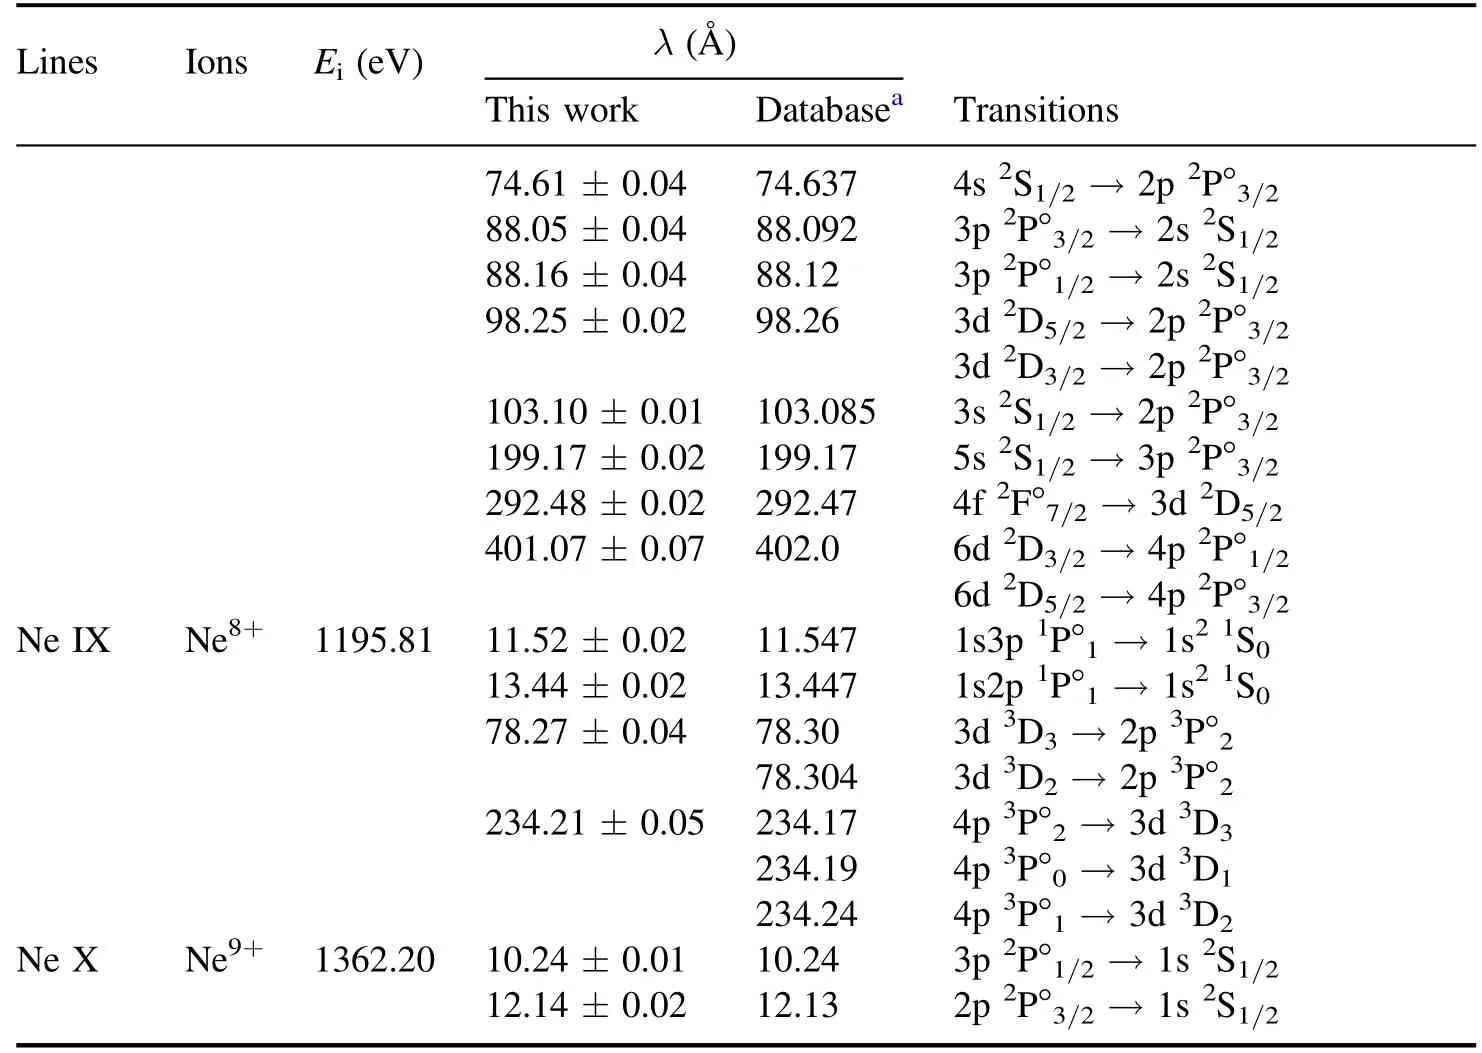
Table 7.(Continued.)
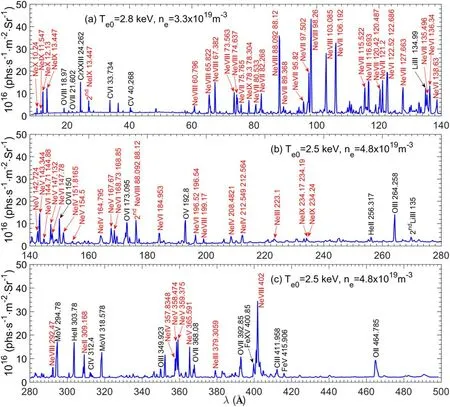
Figure 11.EUV spectra at 10–500 Å observed in the discharge with neon gas puffing.(a)10–140 Å,(b)140–280 and(c)280–500 Å.The identified neon lines are indicated in red. Te0 and ne are also indicated.
3.7.Silicon(Z=14)
The silicon lines in the EUV spectra at 10–490 Å observed in the plasma obtained with fresh silicon coating were analyzed,as shown in figure 12.The spectra at 10–45 Å were obtained with EUV_Short,and the spectra at 45–490 Å were obtained with EUV_Long using three discharges.Te0is 0.9–1.6 keV,andneis(0.5–1.0)×1019m-3.As shown in figures 12(a)–(c),several lines of Si V–Si XII are identified at 40–150 Å and 215–315 Å,respectively.Figure 12(b)shows that lines corresponding to the 2p–2s transitions of B- and C-like silicon ions(Si VIII and Si IX)have high intensity at the wavelength range of 227–297 Å,and the lines at 277.055 Å and 296.213 Å are suitable for the diagnosis of silicon impurities in plasma due to their high intensity.TheEi,λ,and the transitions of the identified boron lines from the NIST database[21]are listed in table 8.
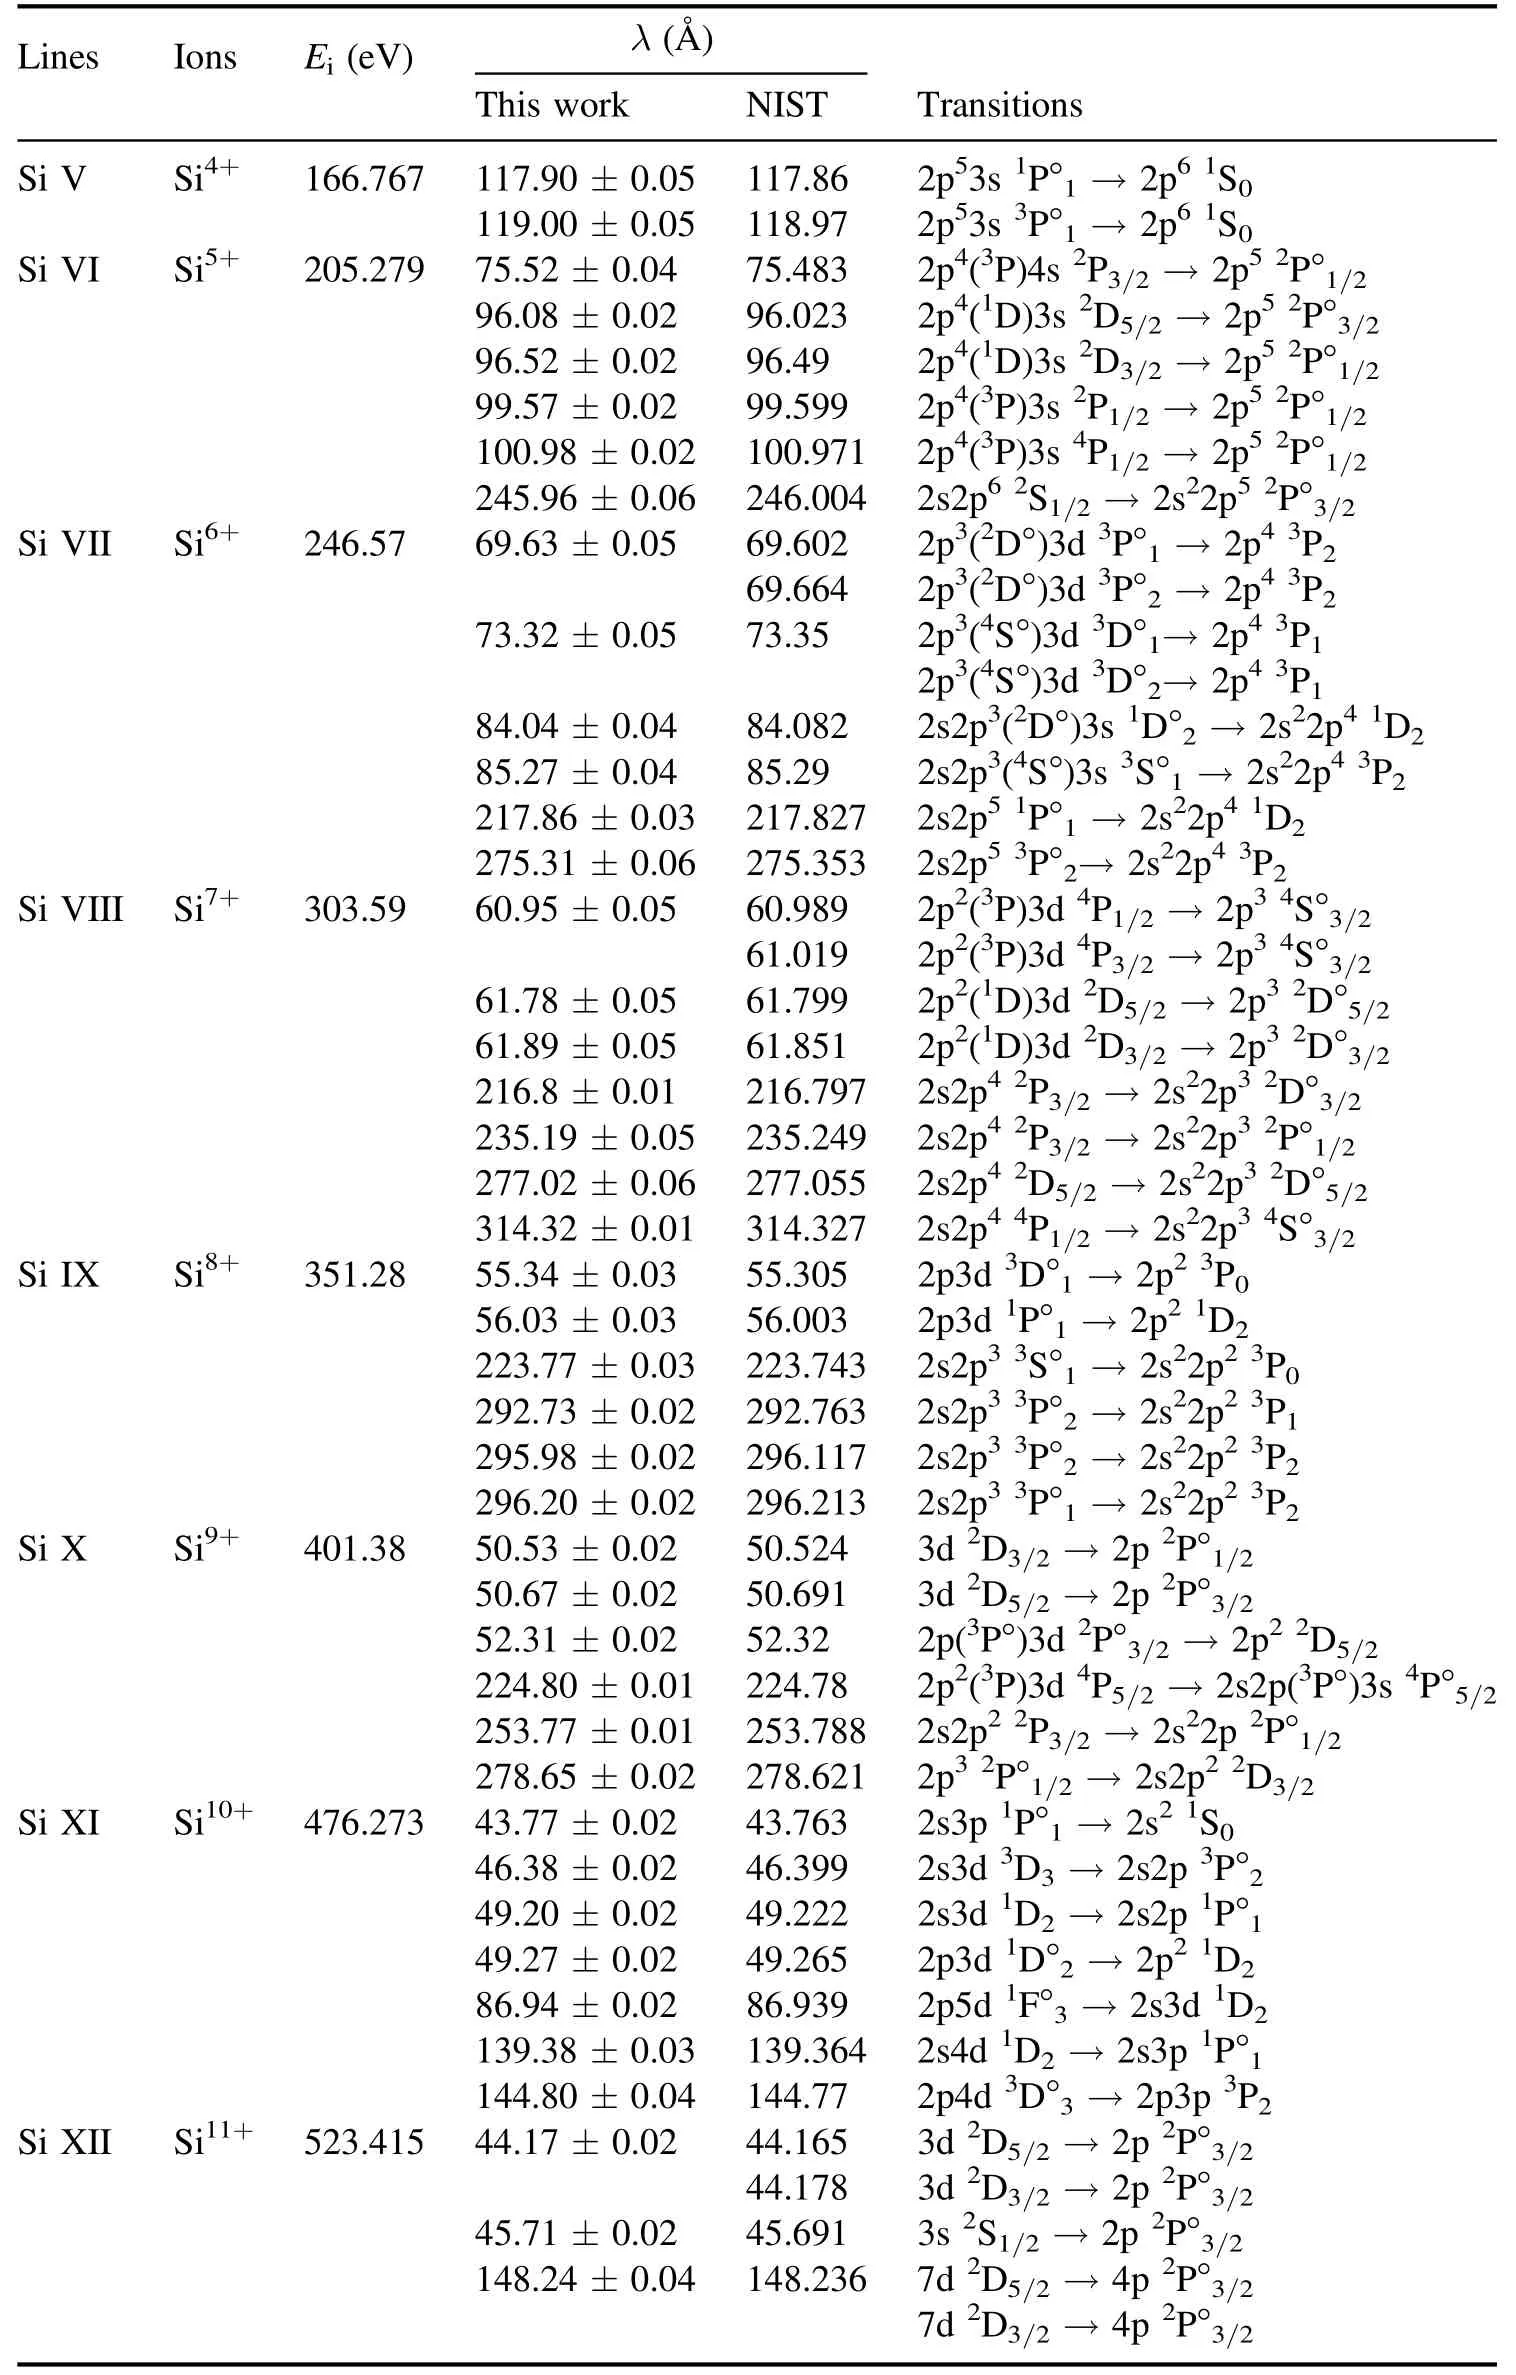
Table 8.Ionization energy,Ei,wavelength,λ,and transitions of the identified silicon lines.
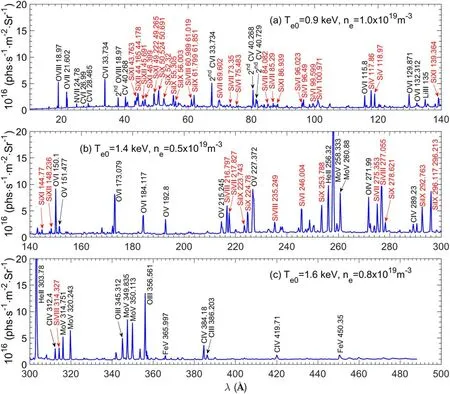
Figure 12.EUV spectra at 10–490 Å obtained with EUV_Long in the discharge after silicon wall conditioning coating siliconization.(a)10–140 Å,(b)140–300 Å,(c)300–490 Å.The identified silicon lines are indicated in red. Te0 and ne are also indicated.
3.8.Argon(Z=18)
The argon lines in the EUV spectra at 10–500 Å observed in the L-mode plasma after argon seeding in EAST were analyzed,as shown in figure 13.The spectra at 10–45 Å were obtained with EUV_Short,and the spectra at 45–150 Å,150–280 Å and 280–500 Å were obtained with EUV_Long using three discharges.Te0andneare similar between different discharges,i.e.Te0=2.4–2.7 keV andne=(1.8–2.4)×1019m-3.As shown in figures 13(a)–(c),a total of 38 lines of Ar X–Ar XVI(Ei=479.76–918.375 eV)can be observed and identified.It is clear that the wavelength distribution of the lines is divided into two groups,in which the lines corresponding to the 3d–2p,3p–2s,and 3s–2p transitions of Ar XIII–Ar XVI(Ei=685.5–918.375 eV)have low intensity in the short wavelength range of 20–30 Å,while the lines corresponding to the 2p–2s transition of Ar X–Ar XVI are observed in the longer wavelength range of 140–390 Å.The line of Ar XV(2s2–2s2p)at 221.15 Å with a high intensity is therefore good for monitoring Ar impurities in core plasma.TheEi,λ,and the transitions of the identified argon lines from the NIST database[21]are listed in table 9.60–150 Å;3p–2s,3d–2p and 3s–2p transitions of Ar XVI–Ar XIV emitted at 23–30 Å;4d–3p transition of Ar VII– Ar IX emitted at 150–21 Å;and 2p–2s transition of Ar X– Ar XVI emitted at 149–389 Å.
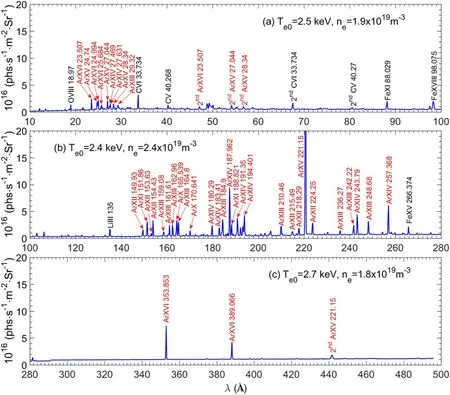
Figure 13.EUV spectra at 20–500 Å observed in the discharge with argon gas puffing.(a)20–110 Å,(b)110–280 Å and(c)280–500 Å.The identified argon lines are indicated in red. Te0 and ne are also indicated.

Table 9.Ionization energy,Ei,wavelength,λ,and transitions of the identified argon lines.
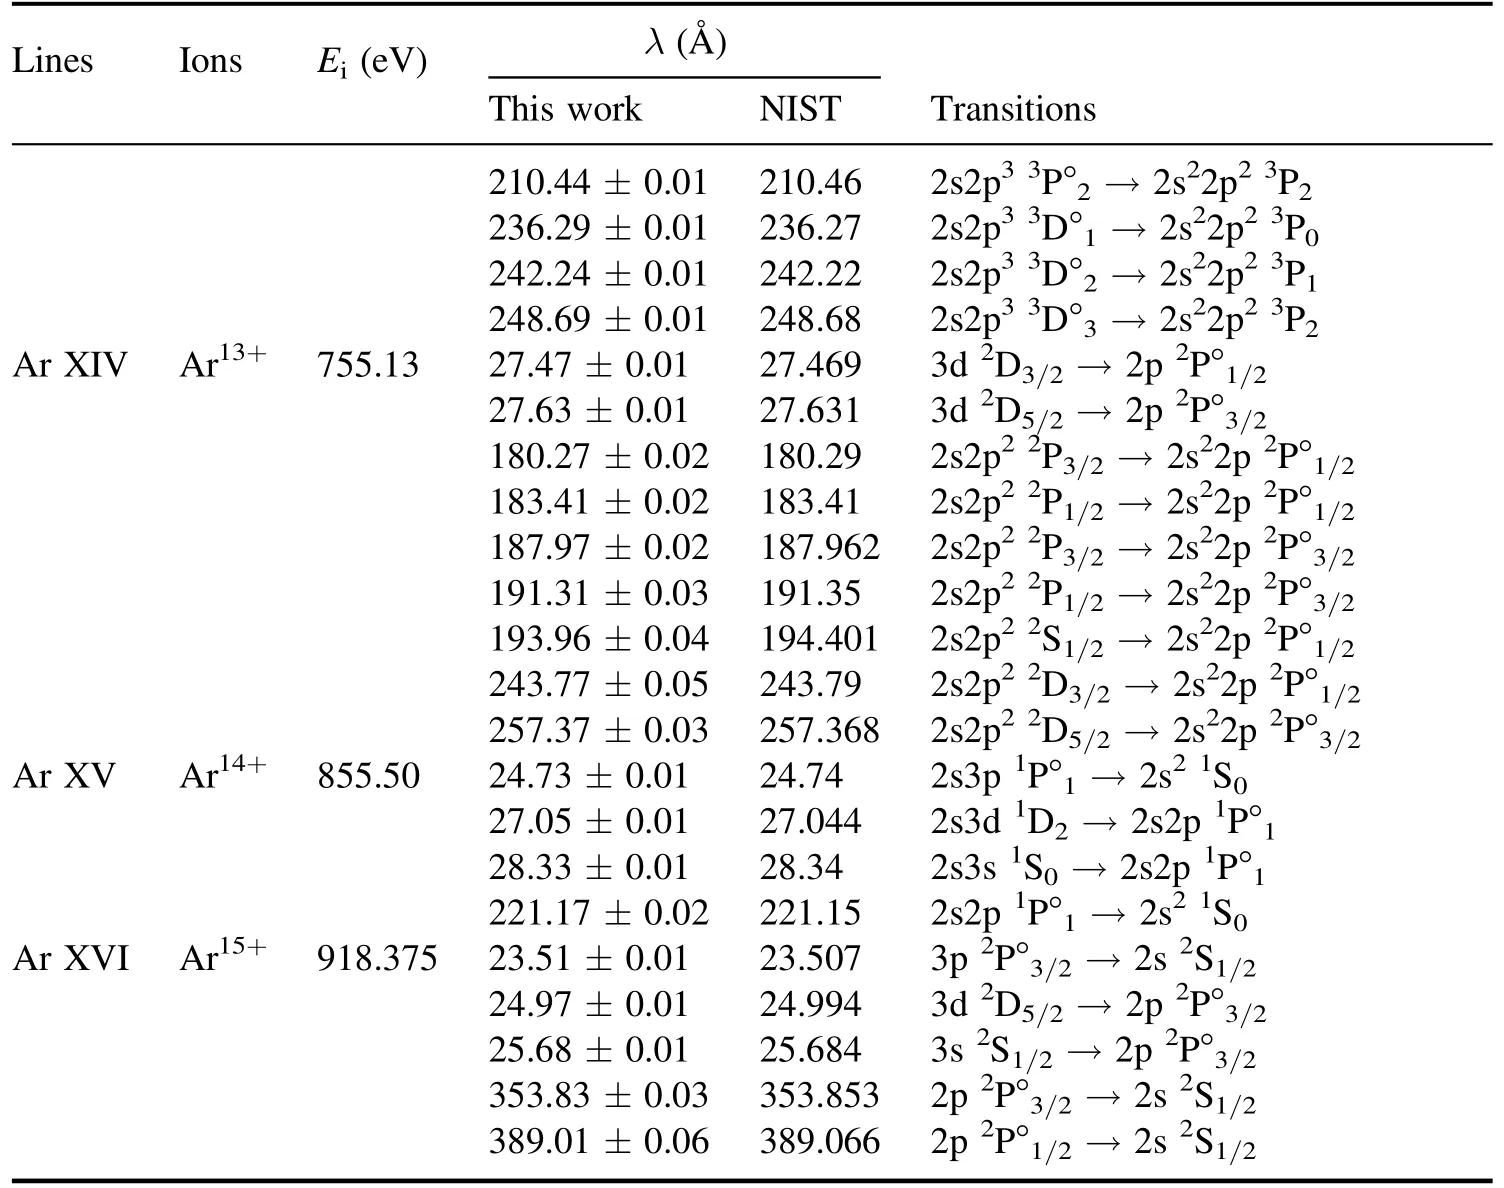
Table 9.(Continued.)
4.Summary
In this work,the emission lines in the EUV wavelength range of 10–500 Å from low-Zimpurities in EAST plasma were systematically analyzed mainly based on the NIST database.As a result,an impurity line emission database of line wavelength,transition was established.The following lines were successfully observed and identified,which will be helpful for studies of the impurity transport and atomic process in fusion plasma:Lyman series lines of He II emitted at 230–310 Å;Lyman series lines of Li III and Li II emitted at 100–200 Å;Lyman series lines of B V and B VI emitted at 37–62 Å;2p–1s transitions of O VII-O VIII emitted at 18–22 Å;3p–2s,3d–2p and 3s–2p transitions of Si XII–Si V emitted at 40–70 Å;3p–1s and 2p–1s transitions of Ne X and Ne IX emitted at 10–14 Å;5p–2s,5d–2p,4p–2s,4d–2p,3p–2s,3d–2p and 3s–2p transitions of Ne VIII –Ne V emitted at
Acknowledgments
This work is supported by National Key Research and Development Program of China(Nos.2018YFE0311100,2017YFE0300402,2017YFE0301300),National Natural Science Foundation of China(Nos.Nos.11905146,11775269,U1832126,11805133),Hefei Science Center High-end User Development Fund Project(2019HSCUE014)and Chinese Academy of Sciences President’s International Fellowship Initiative(PIFI)(2020VMA0001)
杂志排行

Plasma Science and Technology的其它文章
- Rice plant growth and yield:foliar application of plasma activated water
- Three-dimensional non-equilibrium modeling of a DC multi-cathode arc plasma torch
- Magnetic field induction and magnetic force distribution profiles in plasma focus discharge device
- Comparison of sample temperature effect on femtosecond and nanosecond laser-induced breakdown spectroscopy
- An active tunable Fano switch in a plasmafilled superlattice array
- Enhanced removal of ultrafine particles from kerosene combustion using a dielectric barrier discharge reactor packed with porous alumina balls