Experimental study of core and edge fluctuations by reflectometry on EAST tokamak
2021-07-07ZhenZHOU周振TaoZHANG张涛MingfuWU吴茗甫KaixuanYE叶凯萱FubinZHONG钟富彬JiaHUANG黄佳KangningGENG耿康宁YukaiLIU刘煜凯GongshunLI李恭顺HaomingXIANG向皓明YuminWANG王嵎民FeiWEN文斐andSanqiuLIU刘三秋
Zhen ZHOU(周振),Tao ZHANG(张涛),Mingfu WU(吴茗甫),Kaixuan YE(叶凯萱),Fubin ZHONG(钟富彬),Jia HUANG(黄佳),Kangning GENG(耿康宁),Yukai LIU(刘煜凯),Gongshun LI(李恭顺),Haoming XIANG(向皓明),Yumin WANG(王嵎民),Fei WEN(文斐) and Sanqiu LIU(刘三秋)
1 Jiangxi Province Key Laboratory of Fusion and Information Control,Institute of Fusion Energy and Plasma Application,Department of Physics,Nanchang University,Nanchang 330031,People’s Republic of China
2 Institute of Plasma Physics,Chinese Academy of Sciences,Hefei 230031,People’s Republic of China
3 University of Science and Technology of China,Hefei 230026,People’s Republic of China
4 Advanced Energy Research Center,Shenzhen University,Shenzhen 518060,People’s Republic of China
5 Key Laboratory of Optoelectronic Devices and Systems of Ministry of Education and Guangdong Province,College of Optoelectronic Engineering,Shenzhen University,Shenzhen 5180602,People’s Republic of China
Abstract An eight-channel poloidal correlation reflectometer(PCR)with O-mode polarization has been installed in the EAST tokamak to measure the fluctuations from core to edge.The PCR launches eight different frequency microwaves(20.4,24.8,33,40,42.4,48,52.6,57.2 GHz)into the plasma from the low field side and two poloidally separated antennae are used to receive the reflected waves.As a result,the diagnostic can measure fluctuations in eight(radial)×two(poloidal)spatial positions.The diagnostic has been applied to study the core and edge pedestal fluctuations during an inter-ELM phase in H-mode plasma.This inter-ELM phase can be divided into two stages.In the first stage,a low frequency(<50 kHz)broadband fluctuation dominates in the pedestal gradient region.In the second stage,this fluctuation is strongly suppressed and quasi-coherent fluctuations(QCFs)appear.The QCF’s amplitude increases with the pedestal density gradient,implying density gradient driven instabilities.But the core fluctuations inside the pedestal show no evident changes during the inter-ELM phase.
Keywords:core fluctuation,edge fluctuation,reflectometry
1.Introduction
Many studies have shown that the heat transport level of electrons and ions is higher than expected based on neoclassical theory[1].The high transport level is thought to result from plasma turbulence[2],which is still an unresolved issue in fusion plasmas.So,the turbulence and its induced transport are critically important for plasmas in present and future devices,e.g.,ITER[3]and CFETR[4].Due to its high temporal and spatial resolution,reflectometry has been an important diagnostic to study turbulence and transport in experiment and is now installed on many fusion machines for fluctuation measurement[5–11].On EAST,a 20–40 GHz four-channel poloidal correlation reflectometer(PCR)with O-mode polarization has been developed to measure the fluctuation in the plasma edge[12,13].In order to enhance the capability of the diagnostics,a new four-channel PCR with O-mode polarization in the U-band(40–60 GHz)has been installed.As a result,this O-mode PCR is now composed of eight different frequencies,[20.4,24.8,33,40,42.4,48,52.6,57.2]GHz,corresponding to a cutoff density of between ~0.5×10¹⁹m-3and ~4.1×10¹⁹m-3.With this upgrade,the PCR can simultaneously measure the edge and core fluctuations in EAST plasmas.In addition,the diagnostics uses two poloidally separated antennae for the receiver and therefore each frequency has two poloidal measurements,which can be used for poloidal correlation analysis.An introduction to this diagnostic will be presented in section 2.By applying the O-mode PCR to an H-mode plasma,the evolutions of core and edge pedestal fluctuation during the inter-ELM phase have been studied in section 3.Lastly,a discussion and summary are given in section 4.
2.O-mode poloidal correlation reflectometry
The O-mode PCR on EAST has two sets of systems,one of which is a 20–40 GHz reflectometer[12]and the other is a newly installed U-band reflectometer.The U-band reflectometer is also four-channel,i.e.with four microwave frequencies,[42.4,48,52.6,57.2]GHz.Each reflectometer uses three antennae,as shown in figure 1.The antenna in the middle(L)is for the launcher and the other two poloidally separated(~6 cm)antennae(P1 and P2)are for receivers.The two antennae sets for the two reflectometer systems are installed inside the vacuum vessel and located in the same radial and poloidal positions(R=2.6 m,Z=-0.09 m)in the low field side but in adjacent toroidal positions.In addition,the antennae sets have a tilt angle of ~8°with respect to the horizontal line to ensure that the microwave beams are nearly perpendicular to the magnetic surfaces.For present antennae setting and EAST experimental geometry,the diagnostics can respond to fluctuations withkθ<3 cm-1in the plasma edge and withkθ<6 cm-1in the plasma center due to the larger plasma poloidal curvature[14].The distance between the two detected areas of PCR,obtained from the ray tracing code,is about from 0.8 cm to 1.3 cm for the present experiment.With this setup,the O-mode PCR now has eight frequencies,[20.4,24.8,33,40,42.4,48,52.6,57.2]GHz,which corresponds to cutoff densities from ~0.5×10¹⁹m-3to ~4.1×10¹⁹m-3.For each frequency,there are two poloidal measurements and thus poloidal correlation analysis can be applied.
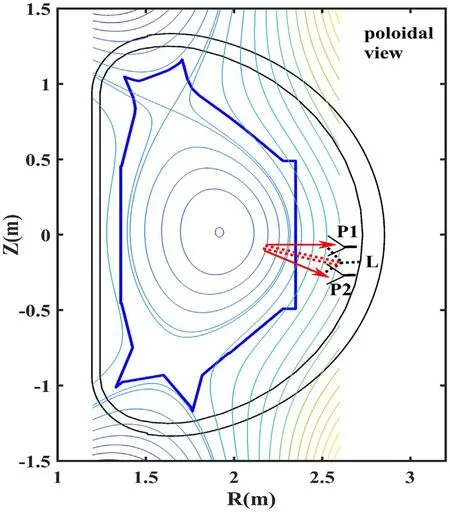
Figure 1.Location of the O-mode PCR antennae sets.The middle antenna is the launcher and the other two poloidally separated antennae are receivers.
3.Core and edge fluctuations in H-mode plasma
High confinement mode(H-mode)plasma is characterized by the spontaneous formation of a narrow region with stair-steplike profiles and steep gradients in the plasma edge.This region is usually called H-mode pedestal.H-mode plasma will be the basic plasma operation scenario for future fusion devices[3,4].Experimental studies have shown that the turbulence is still important for transport in the core and edge even in H-mode plasma[15–23]and deserves further study.
Figure 2 shows a typical plasma discharge #86787(Bt=2.4 T,Ip=440 kA)for the present study,heated by a 0.8 MW lower hybrid wave(LHW)and 0.75 MW electron cyclotron resonance heating(ECRH).L-H transition takes place at aboutt=2.35 s,where density and stored energy shows an increase and the Dαsignal has an abrupt decrease.During the H-mode phase,the plasma energy and density experience large oscillations.This is because the heating power is not high and close to the L-H transition power threshold as the density increases.The ELM behaviors also change correspondingly.Beforet~3.0 s,the ELM is more likely mixed type-I and type-III.Then the plasma experiences a long period without ELMs and density increases but energy decreases.At lower plasma energy,type-III ELMs appear.Fortunately,the plasma does not go back to L-mode but keeps at a state with oscillation.It is noted that the present planned heating power on ITER is also critical with respect to the L-H transition threshold power.Therefore,it is important to study this kind of plasma in the present devices.In the next section,we will focus on the core and edge fluctuations during the long period phase without ELMs.
Figure 3 shows the long period phase without ELMs for the plasma in figure 2.The bursts in the Dαsignal of figure 3(a)represent the ELM crashes and the pedestal density(ne,ped)in figure 3(b)shows a drop at each ELM event.After an ELM crash att=2.98 s,the fluctuation spectrogram of 42.4 GHz reflectometry in figure 3(c)shows a low frequency broadband fluctuation with a frequency of less than ~50 kHz.Aftert=3.04 s,it is found that this broadband fluctuation disappears while quasi-coherent fluctuations(QCFs)with two main bands at about ~50 kHz and ~80 kHz appear and another higher frequency band at ~100 kHz appears later.At the same time,Dαsignal amplitude decreases andne,pedgradually increases up to the next ELM crash.The QCFs are also observed in magnetic fluctuation measured by magnetic probes mounted in the vacuum vessel,as shown in figure 3(d).The toroidal mode numbers for the two bands(~50 kHz and ~80 kHz)of QCFs in magnetic fluctuation aren=-2,-4 respectively.Here,the minus value represents the QCFs rotating in a counter-Ipdirection,corresponding to an electron diamagnetic direction in the perpendicular direction.The ~100 kHz frequency band is very week at magnetic fluctuation and its toroidal mode number is difficult to determine.So it is not known whether the ~100 kHz band is the second harmonic of the ~50 kHz band presently.In addition,ann=-1 mode with frequency ~30 kHz is also observed on the magnetic fluctuation.Although this mode is very weak in the 42.4 GHz PCR signal,a finite coherence between PCR and magnetic signals in figure 3(e)for the 30 kHz mode can be observed.As shown later,the 42.4 GHz PCR is located in the pedestal region.Therefore,the 30 kHz mode is a pedestal mode.Further,the mode frequency remains almost constant while the QCFs’ frequencies show a gradual decrease after 3.12 s.This indicates that they are two different pedestal modes.The 30 kHz mode could be the magnetic coherence mode(MCM)which is with ann=-1,frequency ~30 kHz and with a strong magnetic fluctuation but very weak density and temperature fluctuations[24].Figure 4 shows the fluctuation spectrograms for all eight channels of the O-mode PCR.It is shown that only five channels with a frequency from 24.8 GHz to 48 GHz can observe the phenomena similar to those described above.Figure 5 shows the density profiles and the cutoff positions of the O-mode PCR att=3.025 s andt=3.125 s respectively.From figures 4 and 5,it is seen that the disappearance of broadband fluctuation and the appearance of QCFs occur just at the pedestal gradient region.If we have only the fourchannel 20–40 GHz reflectometry,it is impossible to determine whether these phenomena occur more inside the plasma.
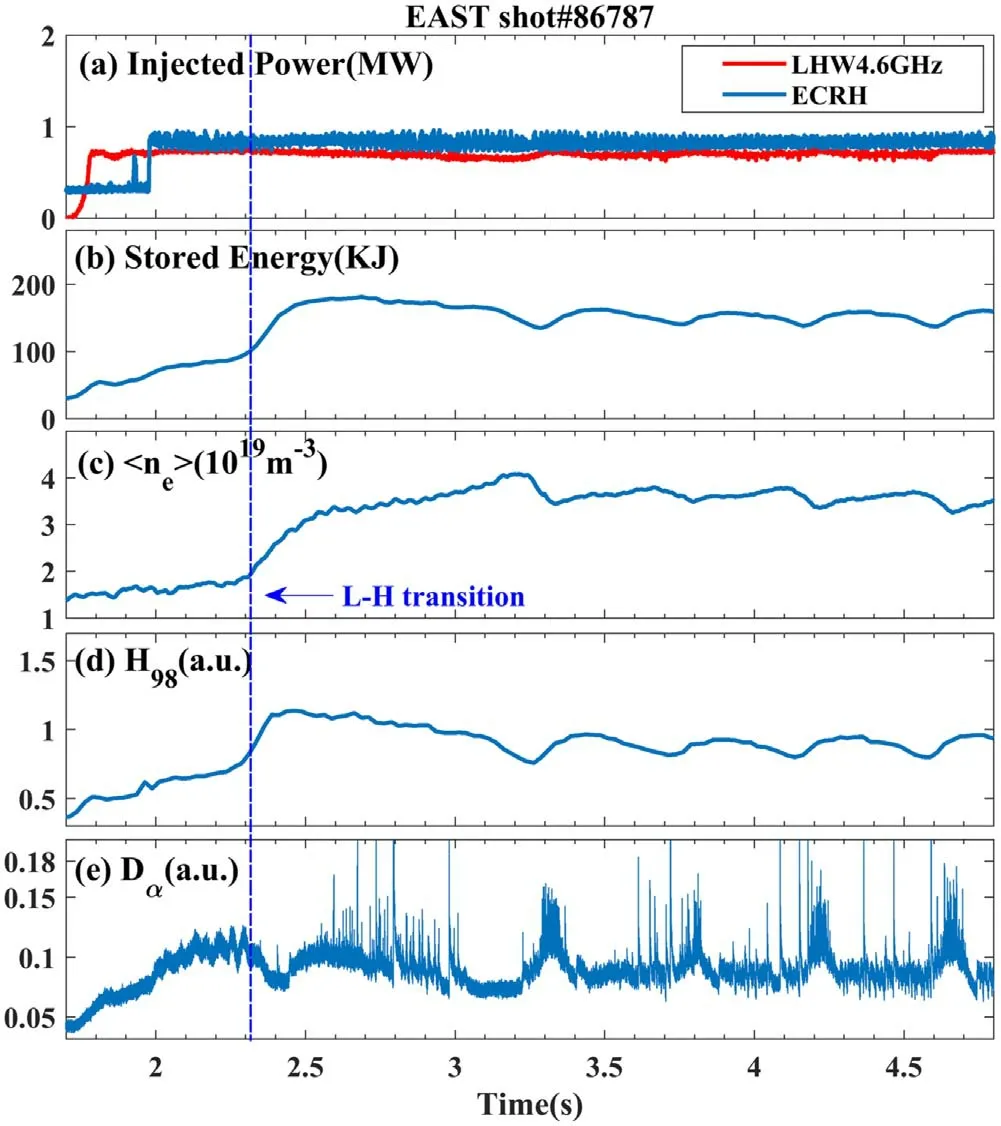
Figure 2.Time evolution of(a)heating power,(b)stored energy,(c)line average electron density,(d) H98,(e)Dα emission.Vertical dashed line indicates the L-H transition.
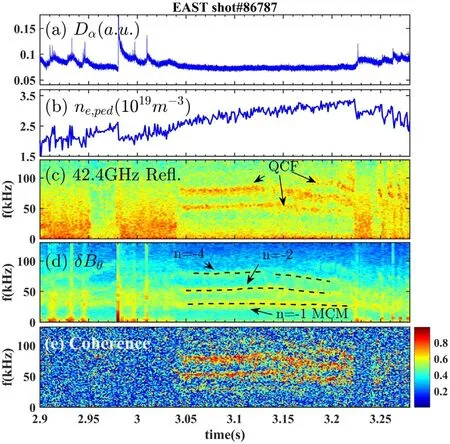
Figure 3.(a)Dα signal,(b)pedestal density ne,ped,(c)fluctuation spectrogram of 42.4 GHz reflectometry,(d)magnetic fluctuation spectrogram measured by magnetic probes,(e)the coherence spectrum between the magnetic signal and 42.4 GHz reflectometry fluctuation.
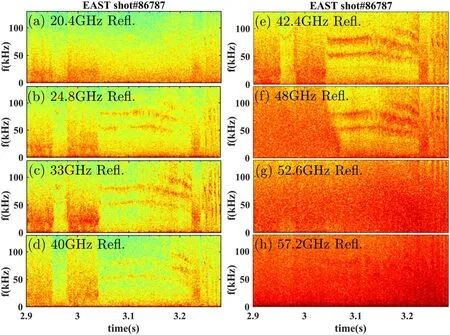
Figure 4.The fluctuation spectrograms measured by the eight-channel O-mode PCR.
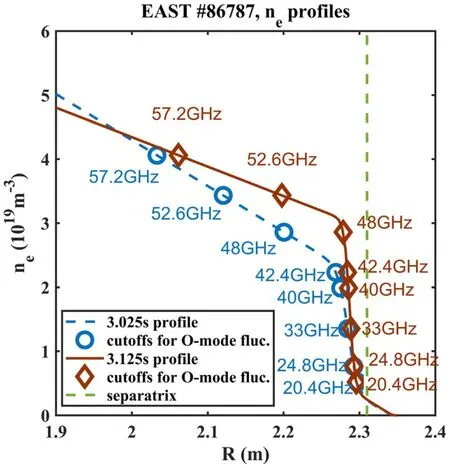
Figure 5.The electron density profile and the cutoffs for O-mode fluctuation reflectometer at t=3.025 s and t=3.125 s.The vertical dashed line represents the separatrix.
Figure 6 shows the comparison of reflectometry fluctuation betweent=3.025 s andt=3.125 s for edge and core regions,respectively.Since the density is increased in the latter time,all the reflectometry cutoffs in fact move outwards.As shown in figure 5,the cutoffs for reflectometry channels in the pedestal gradient region,especially those with a frequency of less than 33 GHz,have little changes due to the steep density gradient.So the 33 GHz reflectometry fluctuation at the two times is chosen to compare for the fluctuation in the edge,as shown in figures 6(a)–(c).The power spectra in figure 6(a)clearly show that the low frequency broadband fluctuation with a frequency of less than 50 kHz is strongly suppressed but the QCFs are stimulated att=3.125 s.As introduced in section 2,each PCR channel has two poloidal measurements and thus poloidal correlation analysis can be applied.In this work,we mainly apply the correlation analysis in the frequency domain,from which coherence spectra and cross-phase spectra can be obtained.Figure 6(b)shows the coherence spectra from the 33 GHz channel for the two times,respectively.It is seen that the frequency domain with significant coherence att=3.025 s is at the range of the low frequency broadband fluctuation.But att=3.125 s,the frequency domain with significant coherence is mainly in the region of QCFs and extends up to 200 kHz.From the crossphase spectrum,the poloidal wavenumber(kθ)spectrum can be obtained by calculating the ratio between the cross-phase and the poloidal separation.Here,the poloidal separation is calculated by a ray-tracing code[25].Figure 6(c)shows thekθspectra for 33 GHz reflectometry fluctuation.It is seen that the low frequency broadband fluctuation att=3.025 s is withkθ=0–1 cm-1while the fluctuation with significant coherence att=3.125 s is withkθ<0.5 cm-1.For comparison of core fluctuation,the 48 GHz reflectometry att=3.025 s and the 52.6 GHz reflectometry att=3.125 s are chosen since their cutoffs are at the same radial location(R~2.2 m)at the two times,as shown in figure 5.Figures 6(d)–(f)are the poloidal correlation analysis for the core fluctuations.The power spectra in figure 6(d)indicate that the fluctuations atR~2.2 m at the two times are broadband fluctuations.The frequency range with significant coherence att=3.025 s is less than 100 kHz withkθ<3 cm-1while that att=3.125 s extends up to 150 kHz withkθ<5 cm-1.
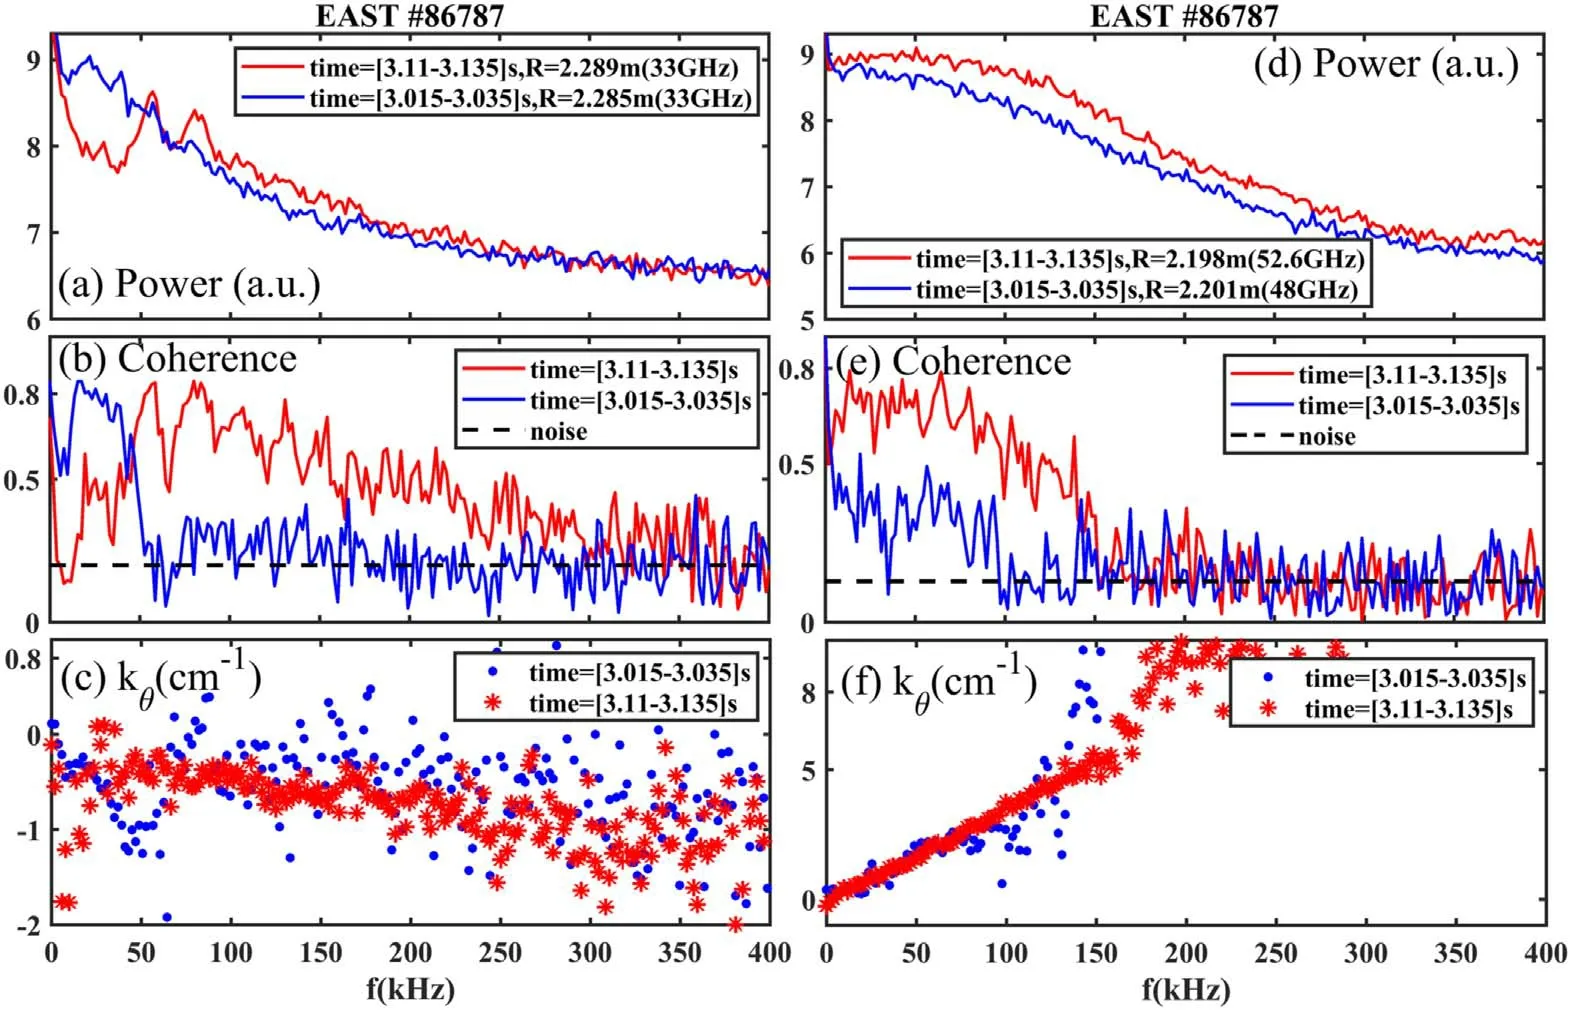
Figure 6.The poloidal correlation analysis for edge and core fluctuations at t=3.025 s and t=3.125 s.(a)and(d)are the power spectra,(b)and(e)the coherence spectra,(c)and(f)the poloidal wave number spectra.
It is shown above that the pedestal is dominated by the low frequency broadband fluctuation before 3.04 s after which the pedestal is dominated by QCFs.In order to understand this phenomenon,the edge turbulence perpendicular velocities(⊥u)att=3.025 s andt=3.125 s measured by a multichannel Doppler backscattering(DBS)diagnostics[26]are compared,as shown in figure 7.The diagnostics launches microwave beams with oblique angles and receives the backscattered signals.As a result,the turbulence with specific perpendicular wave number(⊥k)can be measured.For the case shown in figure 7,the⊥kfor different channels range from 3.5 cm-1to 4.8 cm-1.As shown in the figure,the main difference between⊥uprofiles is that the velocity atR~2.29 m,just the pedestal steep gradient region,changes from ~-2.5 km s-1att=3.025 s to ~-8 km s-1att=3.125 s.Here,the negative⊥urepresents a velocity in the electron diamagnetic drift direction.Generally,this velocity comes from a combination of plasmaE×Bvelocity and turbulence phase velocity in the plasma frame,i.e.In EAST,it is usually found that theE×Bvelocity dominated in⊥uat the pedestal region and thus the estimatedEris usually similar to that estimated from radial force balance[27].Therefore,the change of⊥uin figure 7 mainly reflects theErchanges.In principle,PCR can also be used to measure the plasma turbulence velocity by applying the correlation method[8,25].For example,it is seen from figure 6(f)that for the frequency ranges with significant coherence,thekθshows a linear relation with respect to the frequency.By fitting thedata with a line,the turbulence velocity could be estimated asFor the core turbulence shown in figure 6(f),thekθspectra are nearly the same for frequencies of less than 100 kHz.This indicates that the core turbulence,including the turbulence velocity,has little change before and after 3.04 s.It also implies that theErin the core has no changes during the inter-ELM phase.But in the pedestal region,the fluctuations measured by PCR are different,i.e.low frequency broadband fluctuation before 3.04 s but QCFs after 3.04 s.So from the turbulence velocity calculated from PCR data,it will not be unambiguous how theErchanges.However,this point can be overcome by DBS measurement since it measures the fluctuation at the same⊥kbefore and after 3.04 s.For example,the⊥kof the fluctuation measured by DBS channel atR~2.29 m is about 4 cm-1and has little change before and after 3.04 s.Therefore,we use the⊥udata from DBS measurement since we focus on the pedestal region here.A further analysis of the time evolution of pedestal parameters is shown in figure 8.It can be observed that the decrease of⊥uand the suppression of low frequency broadband fluctuation,occur instantly and nearly simultaneously.At the same time,the pedestal density gradient also shows an abrupt increase.More discussions will be presented in section 4.

Figure 7.The turbulence velocity profiles measured by DBS at t=3.025 s and t=3.125 s.
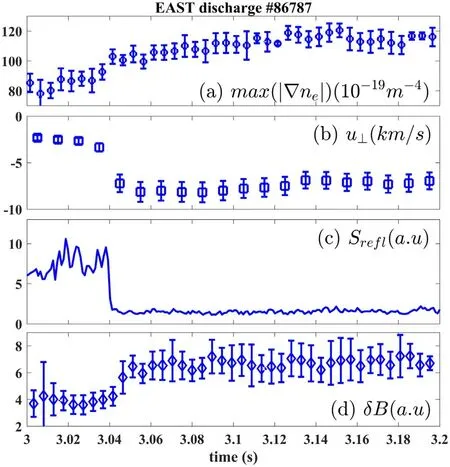
Figure 8.Time evolution of(a)pedestal density gradient(maximum value),(b)turbulence velocities measured by DBS,(c)integrated power from 10 kHz to 50 kHz from spectrum of 40 GHz reflectometry,(d)QCF intensity for the frequency bands of 40–120 kHz from the magnetic signal.
Another interesting phenomenon is that QCFs are stimulated after 3.04 s.Figure 8(d)shows that the amplitude of QCFs appears after a specific density gradient and then increases until saturation is reached.In figure 9,the amplitude of the QCFs is plotted against the density gradient.It is seen that the QCF amplitudes increase with the pedestal gradient.This implies that the QCFs could be destabilized by the density gradient.As shown in figure 3 and discussion therein,both MCM and QCFs are pedestal modes and can be picked up by magnetic signals.It is usually found that different modes can coexist in pedestal region and nonlinear interaction among them could be import for pedestal transport or even ELM[28,29].The bi-spectrum of the magnetic fluctuations has been analyzed as shown in figure 10 and no significant bicoherence value is observed.This implies that the nonlinear interaction between QCFs and MCM could be unavailable for the present case.
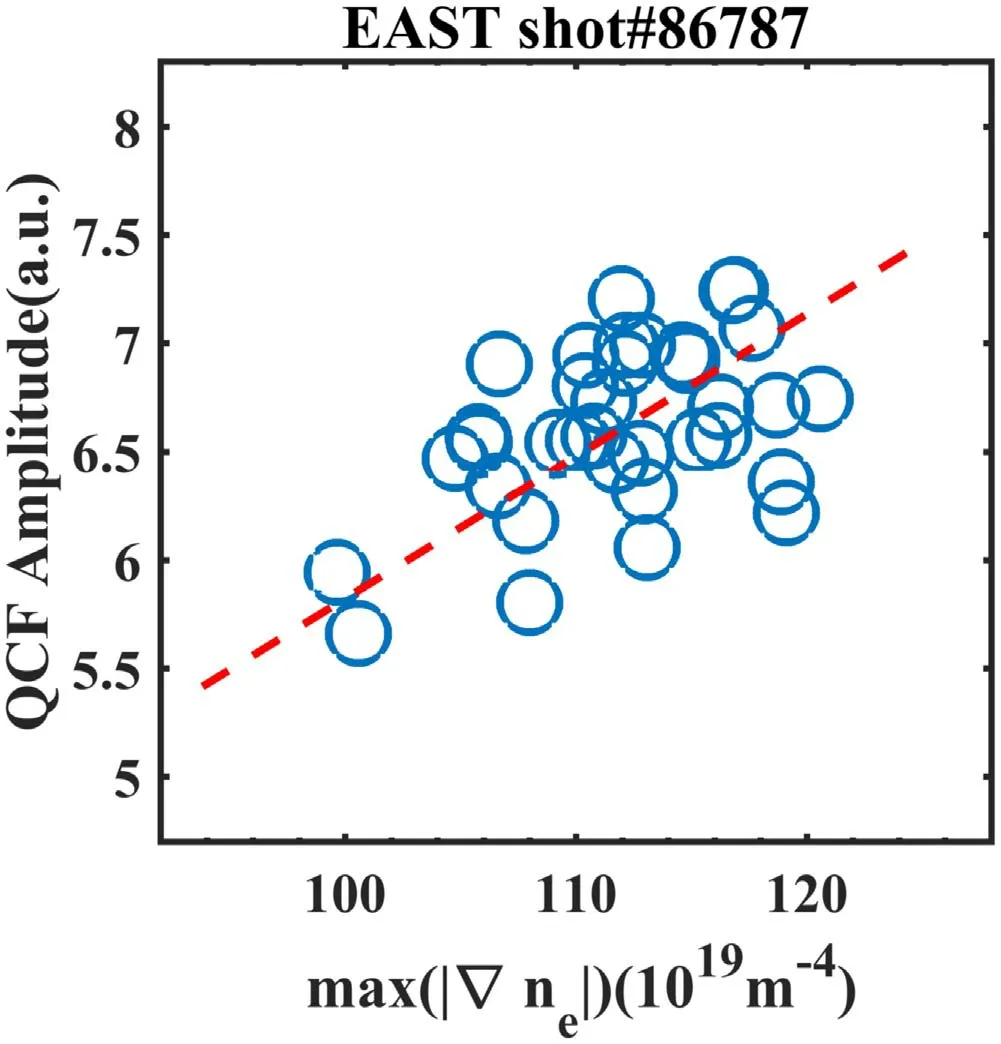
Figure 9.The QCF amplitude is plotted against the density gradient evolution.
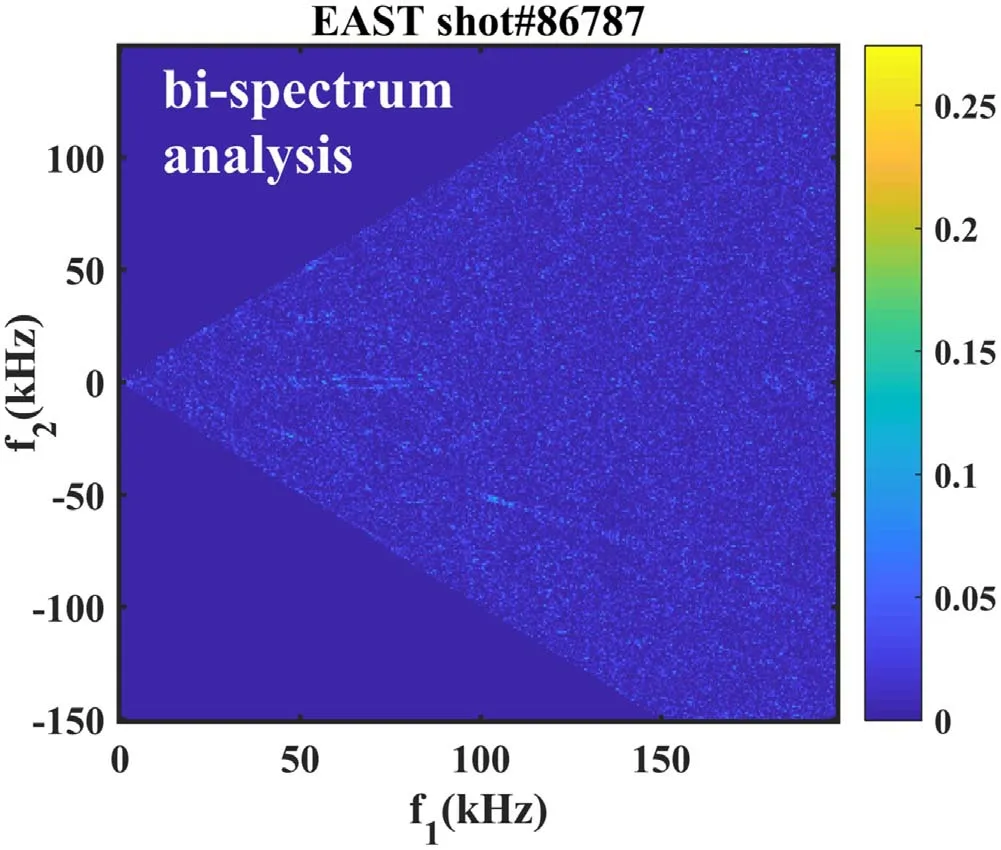
Figure 10.The bi-spectrum analysis from the magnetic fluctuation.
4.Discussion and summary
From the O-mode PCR fluctuation measurement during an inter-ELM phase shown in figure 4,it is evident that this inter-ELM phase can be divided into two stages.The first stage is fromt=2.98 s(just after the ELM crash)tot=3.04 s,where the edge pedestal fluctuation is dominated by a low frequency broadband fluctuation with a frequency of less than 50 kHz.The second stage is fromt=3.04 s up to the next ELM crash.As shown in figure 8,the density gradient increase indicates that the pedestal particle transport is improved in the second stage and could be attributed to the suppression of the low frequency broadband fluctuation.This also implies that this fluctuation can drive outward particle flux in the first stage.This fluctuation suppression was clearly closely related to the⊥udecrease or more closely related to theErdecrease in the pedestal region while the causal relationship between them is impossible to resolve based on present analysis.
In the second stage,a new turbulence component,i.e.QCFs,appear in the pedestal region.The recent observations on DIII-D also indicate that QCFs appear between ELMs and the onset occurs when the temperature gradient threshold is reached[19].A QCM is triggered by the density gradient during the inter-edge localized mode period in HL-2A by linear and nonlinear simulations[30].For the analysis of QCFs on EAST in the present work,only the pedestal density profile with enough time resolution is available and no pedestal temperature profile is available.So we do not know the relation between QCFs and temperature gradient.Nevertheless,the relation between the QCFs’amplitude and density gradient shown in figures 8 and 9 implies that the QCFs are destabilized by the pedestal density gradient,which is similar to the observation in HL-2A.In addition,figure 8 shows that the density gradient remains nearly constant as the QCFs arrived at the saturation value.This implies that QCFs could have an effect on driving outward particle transport.
With the installation of a U-band reflectometer,the O-mode PCR on EAST is now composed of eight frequencies covering from 20 GHz to 60 GHz,corresponding to a cutoff density from ~0.5×10¹⁹m-3to ~4.1×10¹⁹m-3.This enables the diagnostic to simultaneously measure the fluctuation from edge to core in most of the EAST operations.In addition,each frequency has two poloidal measurements which can be used for poloidal correlation analysis.During an inter-ELM phase,the PCR measurement shows that it can be divided into two stages according to the behavior of the edge pedestal fluctuations.The pedestal in the first stage is dominated by a low-frequency broadband fluctuation while this fluctuation will be strongly suppressed and new QCFs are stimulated in the second stage.It seems that the QCFs are destabilized by the pedestal density gradient.The core fluctuation,however,shows no significant change in the two stages of the inter-ELM phase.
Acknowledgments
The authors are grateful to Dr C.Zhou who helped to analyze the DBS data.This work has been supported by the National Key R&D Program of China(No.2017YFE0301205),and National Natural Science Foundation of China(Nos.11875289,11675211,11805136,and 12075284).
ORCID iDs
猜你喜欢
杂志排行

Plasma Science and Technology的其它文章
- Numerical simulation of carbon arc discharge for graphene synthesis without catalyst
- Enhanced removal of ultrafine particles from kerosene combustion using a dielectric barrier discharge reactor packed with porous alumina balls
- Visualization of gold nanoparticles formation in DC plasma-liquid systems
- Rice plant growth and yield:foliar application of plasma activated water
- An active tunable Fano switch in a plasmafilled superlattice array
- Comparison of sample temperature effect on femtosecond and nanosecond laser-induced breakdown spectroscopy