Susceptibility breakpoint for cefquinome against Escherichia coli and Staphylococcus aureus from pigs
2021-06-02ZHANGHuilinZHAOYiyangZHOUZichongDlNGHuanzhong
ZHANG Hui-lin,ZHAO Yi-yang,ZHOU Zi-chong,DlNG Huan-zhong
Guangdong Key Laboratory for Veterinary Drug Development and Safety Evaluation,South China Agricultural University,Guangzhou 510000,P.R.China
Abstract Cefquinome is the only fourth-generation cephalosporin used solely for veterinary applications.In this study,we established the wild-type cut-off (COWT) and pharmacokinetic/pharmacodynamic cut-off (COPD) of cefquinome against Escherichia coli and Staphylococcus aureus.A total of 210 E.coli and 160 S.aureus isolates were collected from pigs in Guangdong Province between 2014 and 2018.The minimum inhibitory concentrations (MICs) were determined using a microdilution broth method.MIC50 and MIC90 were 0.06 and 0.25 μg mL–1 for E.coli and 0.5 and 1 μg mL–1 for S.aureus,respectively.Statistical analysis and the ECOFFinder Program showed that the COWT for cefquinome against E.coli and S.aureus were 0.125 and 2 μg mL–1,respectively.The resistance rates were 11.9% for E.coli and 6.25% for S.aureus.Based on a 5 000-subject Monte Carlo simulation,the COPD value for cefquinome against E.coil and S.aureus was 0.25 μg mL–1 under the recommended dose (2 mg kg–1,twice a day for 3 days),confirming that infections caused by strains with MIC≤0.25 μg mL–1 could be effectively treated.Following adjustment of the dosing regimen to 4.5 mg kg–1,effective treatment (>90)was achieved for S.aureus infections with MIC90 1 μg mL–1.This susceptibility breakpoint determination is significant for resistant surveillance and cefquinome dosage guidance against E.coli and S.aureus in pigs.
Keywords:cefquinome,Escherichia coli, Staphylococcus aureus,COWT,COPD
1.lntroduction
Escherichia coliandStaphylococcus aureusare important zoonotic pathogensthat have recently emerged as the most important pathogenic bacteria affecting the pig farming industry in the world (VanderWaal and Deen 2018).Escherichia colicaused diarrhea and edema in different pigs of all ages,with high morbidity and mortality (Zhanget al.2007).The pig industry is an important reservoir ofE.colithat could cause human intestinal infections andtypical extraintestinal infections including urinary tract infections,pyelonephritis,sepsis,pneumonia and meningitis (Johnson and Russo 2005;Belangeret al.2011;Tanet al.2012).As vaccines have limited antagonism against a large number of serotypes ofE.coli(Nesta and Pizza 2018),antimicrobial chemotherapy is critically important to control infections.Staphylococcus aureuscould cause a variety of illnesses ranging from minor skin infections to life-threatening diseases such as pneumonia,endocarditis and sepsis(Lowy 1998;Christiansenet al.2013;De la Calleet al.2016).β-Lactam antibiotics have good antibacterial activity onS.aureus,but commonly induce resistance,resulting in strains such as methicillin-resistantS.aureus(MRSA).
Cefquinome showed good therapeutic effects on respiratory tract diseases (caused byActinobacillus pleuropneumoniae,Klebsiella pneumoniaandPasteurella multocida) in pigs (Shan and Wang 2017;Zhanget al.2018,2019),and has been approved by the CVMP (1999)for the treatment of metritis-mastitis-agalactia syndrome in sows.The antibacterial effect of cefquinome onE.coliwas better than that of other drugs,and had similar effects onS.aureuscompared to other drugs (Wisselinket al.2006).Furthermore,cefquinome showed good antibacterial effects on MRSA and intestinal bacteria that were resistant to the previous cephalosporins (Limbertet al.1991;Chinet al.1992).
Irrational use of antibiotics led to the development of resistance.One study indicated that the resistance rate of cefquinome toE.coliincreased from 3.8 to 44%during the period from 2002 to 2011 in Italy (Luppiet al.2015).β-Lactam antibiotics are the drugs of the choice to treatS.aureusinfections,but resistance to these and other antibiotics make treatment problematic (Chanet al.2016).There are various mechanisms underlying the resistance ofS.aureusto β-lactam including enzymemediated inactivation,intrinsic factor and tolerance (Sabath 1982).Antimicrobial resistance is a serious threat to the economy and public health worldwide (Barton 2014).The establishment of susceptibility breakpoints is an important part of drug resistance monitoring,and provides important information for the use of antibiotics.However,neither the European Union Commission on Antimicrobial Susceptibility Testing (EUCAST) nor Clinical and Laboratory Standards Institution (CLSI) has established susceptibility breakpoint for cefquinome againstE.coliandS.aureus.
Susceptibility breakpoints include wild-type cut-off(COWT),pharmacokinetic/pharmacodynamic cut-off (COPD)and clinical cut-off (COCL).The wild-type (WT) is the species of a microorganism that isdevoid of resistance mechanisms to target drugs (Kahlmeteret al.2003;Turnidge and Paterson 2007).The COWTwas defined as the upper limit of minimum inhibitory concentrations (MICs) distribution and at least 95% of WT isolates were encompassed,used to distinguish sensitive and resistant bacterial populations(Turnidgeet al.2006;Cantonet al.2012).Although the COWTplays an important role in monitoring resistance(Huseet al.2018),however,COWTdoes not reflect the drug interaction of the drug with bacteriain vivo,so it has limited value in guiding medication (Ambrose and Quintiliani 2000).In the absence of COCL,COPDwas associated with clinical efficacy,as both pharmacokinetic/pharmacodynamic(PK/PD) parameters and MIC distribution were used to calculate the COPD(Zhanget al.2016).The COPDwas defined as the MIC value corresponding to the probability of target attainment (PTA)>90% in a Monte Carlo simulation(Ambrose and Grasela 2000;DeRykeet al.2007).It was used to describe the sensitivity of bacteria to changes in drug concentration.
The purposes of the present study were:(i) to perform thein vitrosusceptibility tests on porcine-derivedE.coliandS.aureuscollected between 2014 and 2018 in Guangdong Province (China);(ii) to establish the COWTof cefquinome against two bacteria by statistical analysis method and ECOFFinder method and (iii) to establish the COPDof cefquinome onE.coliandS.aureusbased on PK/PD parameters and MICs distribution using Monte Carlo simulation.Cefquinome was extensively used to prevent and treatE.coliandS.aureusinfections in the clinic,therefore,this study provided important information for reducing the possibility of treatment failure and avoiding the development of new resistance.
2.Materials and methods
2.1.Materials
A total of 210E.colistrains and 160S.aureusstrains were isolated from the gastrointestinal tract of pigs at veterinary stations and farms in five separate sites,Guangzhou,Foshan,Yunfu,Maoming and Jiangmen (Guangdong Province) from 2014 to 2018,including most of the pigs that looked normal and some of the pigs that have died.All the strains were identified using matrix-assisted laser desorption/ionization-time of flight (MALDI-TOF) mass spectrometry by the Laboratory of Veterinary Pharmacology,South China Agricultural University.Thestandard strains ofE.coli(ATCC25922) andS.aureus(ATCC29213) were provided by the Chinese Veterinary Microorganism Culture Collection Center (Beijing,China).A cefquinome sulfate standard (80.9%) was obtained from the China Institute of Veterinary Drug Control (Beijing,China).The“raw”form of cefquinome (84.1%) was purchased from Yuanzheng Pharmaceutical Co.,Ltd.(Hebei,China).
2.2.Antimicrobial susceptibility testing
The MICs of cefquinome againstE.colistrains andS.aureusstrains were determined using a microdilution broth method according to CLSI guidelines (CLSI-M100-S26).Escherichia coliATCC25922 andS.aureusATCC29213 were used as the quality control strains to ensure the credibility of the MICs determined in this study.
2.3.Wild-type cut-off determination
The COWTwas calculated by statistical analysis according to Turnidgeet al.(2006).First,MIC values were transformed to log2MIC values and normality analysis of the WT distribution was conducted using Statistical Product and Service Solutions (SPSS) Software (version 23.0.0.0,International Business Machines Corp,USA).Subsequently,nonlinear least-squares regression was used to fit the log2-transformed MICs in GraphPad Prism 7.04 (version 7.04,GraphPad Software,Inc.,San Diego,CA,USA) to obtain values for log2mean,log2SD (standard deviation) and N (the predicted number).The log2mean and log2SD values were then applied to the NORMINV function to determine the distribution of the WT strain by setting a 95% confidence interval.To verify the results,the NORMDIST function was used to calculate the probability of WT strains above and below the WT upper and lower limits,respectively.The COWTwas defined as the MIC value closest to the upper limit (Haoet al.2013).
The ECOFFinder method was used to verify the COWTvalues calculated by statistical analysis,and the COWTvalue was automatically calculated by the software (ECOFFinder XL 2010,v2.1).
2.4.Definition of pharmacokinetic/pharmacodynamic cut-off and Monte Carlo analysis
The PK/PD parameters were collected from simultaneous PK/PD modeling in animals (Guet al.2015;Xionget al.2016).The studies suggested that the effect of cefquinome againstE.coliandS.aureuswas time-dependent,and that efficacy was driven by %T>MIC (T=the cumulative percentage of time over a period that the drug concentration exceeds the MIC).The value of %T>MIC required to produce a 1/2log10CFU mL–1ofE.coliwas 52.68%,in which cefquinome was expected to be effective under the recommended dose (3log10reduction in bacterial count can be achieved after administration of six doses of the drug,twice a day for 3 days) (Guet al.2015).ForS.aureus,the%T>MIC to produce a drop in 1/2log10CFU mL–1was 42.91%(Xionget al.2016).
Based on the previous PK parameters,PK/PD threshold and MIC distribution,a 5 000-subject Monte Carlo simulation was conducted using R Software (version 3.5.3,https://www.r-project.org/).The %T>MICs of 52.68% forE.coliand 42.91% forS.aureuswere selected to calculate the PTA.The PK/PD cut-off was defined as the MIC at which the PTA for 1/2log10CFU mL–1decrease was ≥90% under the clinically recommended dose of 2 mg kg–1.This was calculated using a modification of a previously described method as follows(Tianet al.2016):(I) the drug concentration-time curve based on pharmacokinetic data was generated in R Software(version 3.5.3,https://www.r-project.org/),and the curve was divided into six parts according to the treatment period(12 h);(ii) linear regression and nonlinear regression analysis was then performed on its absorption and elimination phases(using Cmaxas the cut-off point) to select the best fitness equation;(iii) using the MIC as empirical distribution,and a random MIC value was applied to the equation to get the two pointst1andt2at which the plasma concentration equals to the MIC.The value of %T>MIC was calculated using the equation and compared with the target value;(IV) these steps were repeated 5000 times to obtained the predicted density distribution of % T>MIC and the PTA was calculated:
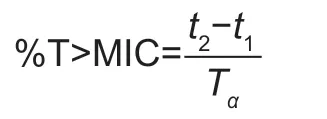
whereTαis the treatment period.
3.Results
3.1.MlCs of cefquinome against 210 E.coli and 160 S.aureus strains
The MICs for cefquinome againstE.coli(ATCC 25922)andS.aureusATCC29213 were within the acceptable quality control range.As shown in Fig.1-A,the MICs of cefquinome against 210E.colistrains ranged from 0.03 to 4 μg mL–1,the distribution of MICs was unimodal distribution with the peak MIC of 0.06 μg mL–1.The MIC50and MIC90were 0.06 and 0.25 μg mL–1,respectively.The MIC distribution of cefquinome against 160S.aureusstrains ranged from 0.125 to 16 μg mL–1(Fig.1-B).A unimodal distribution was observed with a peak value observed at 0.5 μg mL–1within the MIC value of 4 μg mL–1.The MIC50and MIC90were 0.5 and 1 μg mL–1,respectively.
3.2.Wild-type cut-off of cefquinome against E.coli and S.aureus
Statistical analysis showed a normal distribution of MIC frequencies forE.coliwhen plotted logarithmically;the MICs ranged 0.03–0.125 and 0.03–0.25 μg mL–1,respectively(Fig.2-A and B).The nonlinear least square method was used to simulate the cumulative frequency distribution of log2MIC in the range of MIC≤0.125 μg mL–1and MIC≤0.25 μg mL–1.Using MIC≤0.125 μg mL–1,the estimated total number of WT isolates (n=186) was closest to the true total number of bacteria (n=185),hence MIC≤0.125 μg mL–1was adopted as the tentative COWT.The NORMINV and NORMDIST functions indicated the tentative COWTof 0.125 μg mL–1contained 99.38% wild strains.Specific data was shown in Table 1.The COWTcalculated by using ECOFFinder method was also 0.125 μg mL–1(Fig.2-C and D).
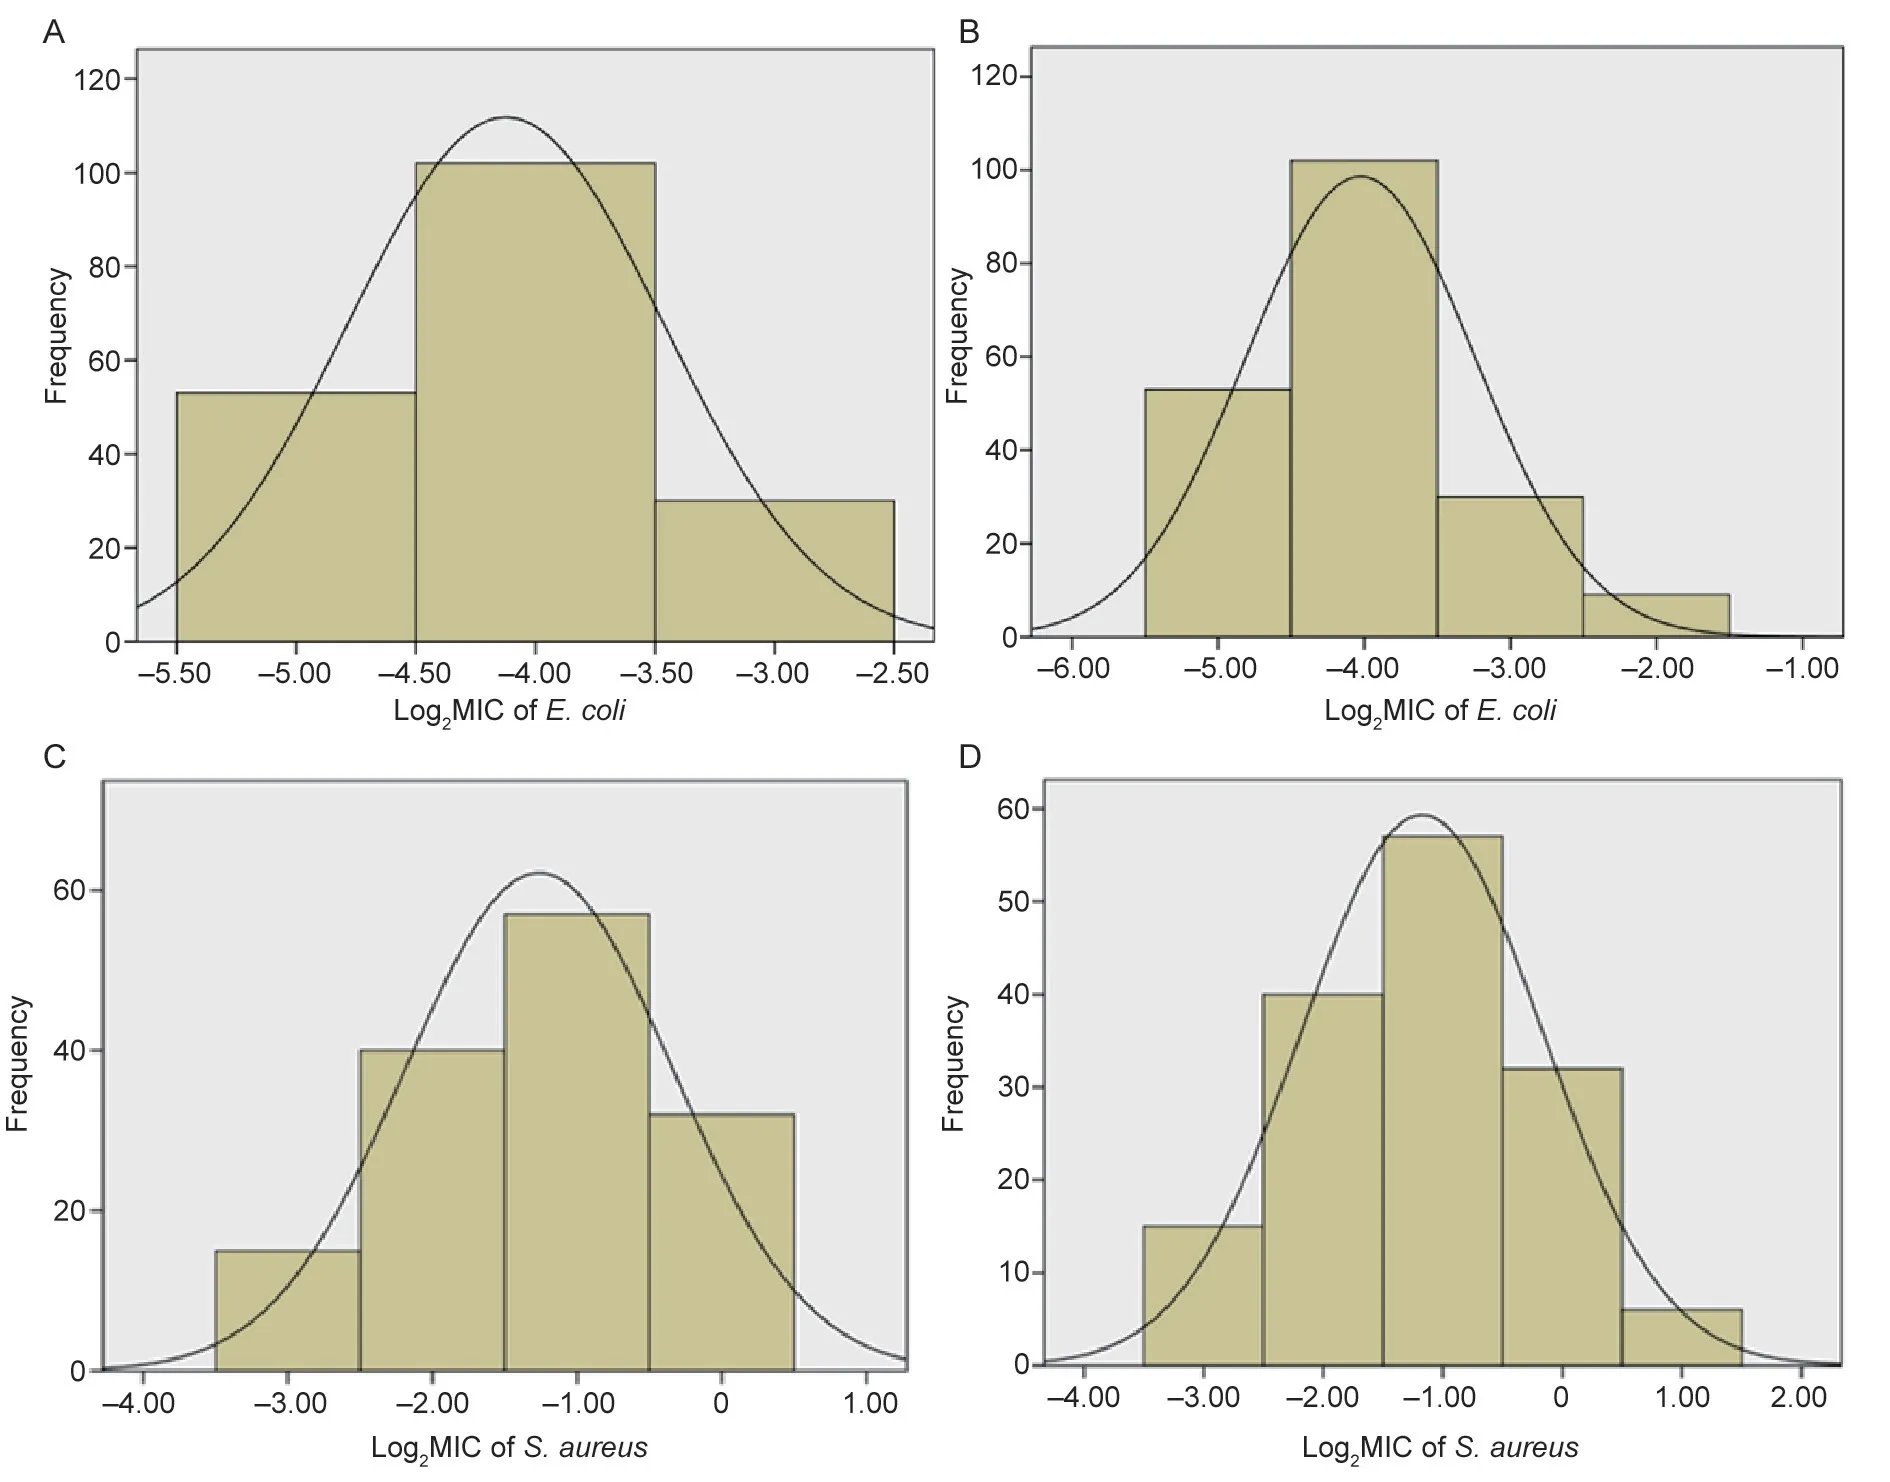
Fig.2 Simulation of the log2MIC (minimum inhibitory concentration) normal distribution of cefquinome against Escherichia coli (A,values ranged from 0.03 to 0.125 μg mL–1.B,values ranged from 0.03 to 0.25 μg mL–1) and Staphylococcus aureus (C,values ranged from 0.125 to 1 μg mL–1.D,values ranged from 0.125 to 2 μg mL–1).
ForS.aureus,both histograms of MIC frequencies appeared normal when plotted logarithmically with MIC ranged 0.125–1 and 0.125–2 μg mL–1(Fig.3-A).In GraphPad Prism 7.04,the estimated total number of WT isolates (n=151) was closest to the true total bacteria number(n=150) with the MIC range of 0.125–2 μg mL–1.MIC≤2 μg mL–1was considered as the tentative COWT.The NORMINV and NORMDIST functions in Microsoft Excel were used to verify that the tentative COWTof 2 μg mL–1covered at least 95% of the MIC distribution.Specific data are shown in Table 2.The COWTcalculated using the ECOFFinder method was also 2 μg mL–1(Fig.3-B).
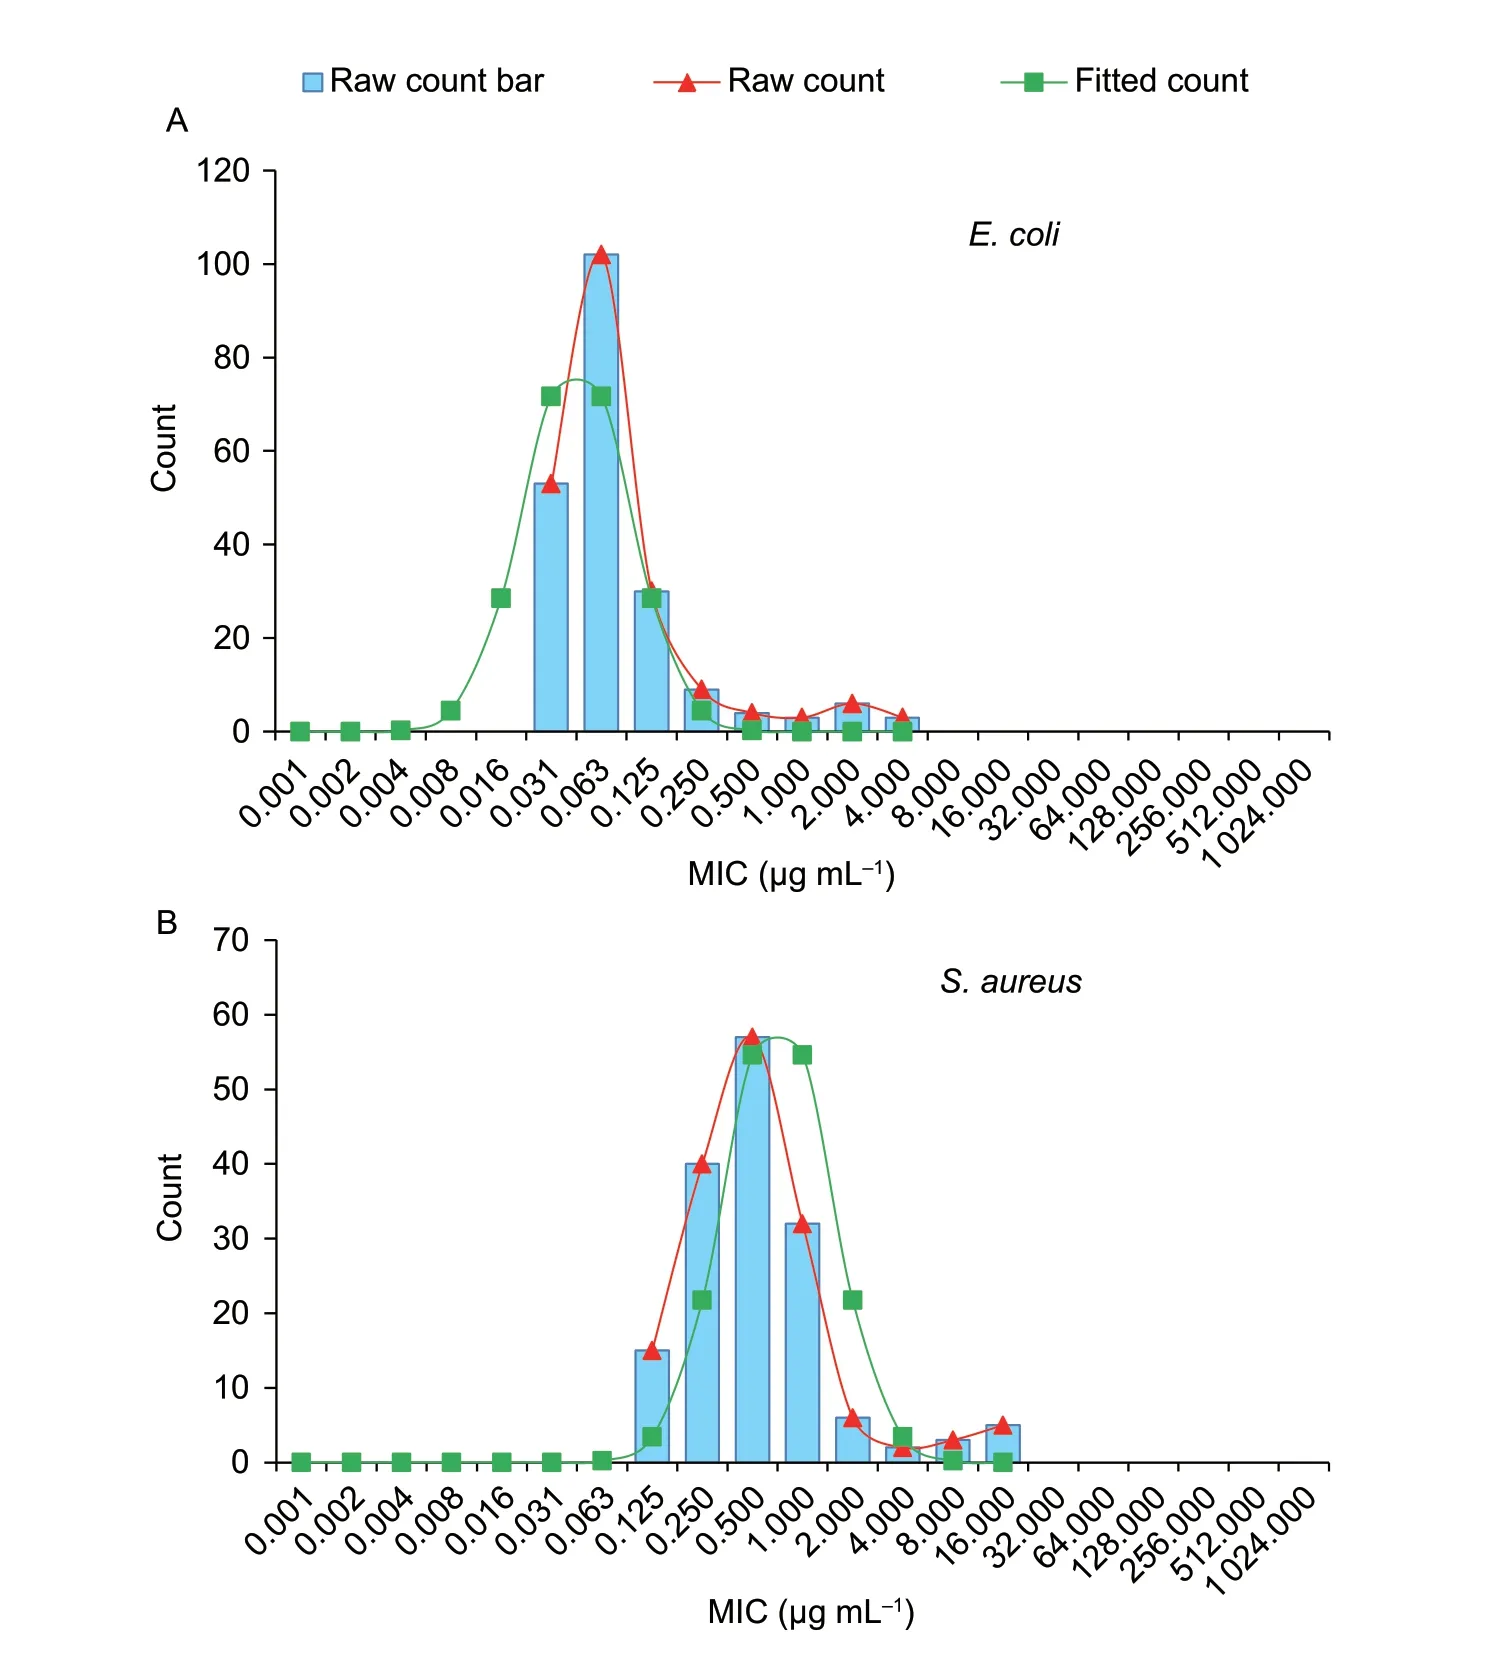
Fig.3 Wild-type cut-off (COWT) of cefquinome against Escherichia coli (A) and Staphylococcus aureus (B) using the ECOFFinder method.
In this study,the resistance rates to cefquinome were 11.9% (25/210) forE.coliand 6.25% (10/160) forS.aureusin Guangdong Province from 2014 to 2018.
3.3.Pharmacokinetic/pharmacodynamic cut-off of Cefquinome against E.coli and S.aureus
As shown in Table 3,the target value (52.68%) could be reached by a single-dose administration of 2 mg kg–1with the strains with MIC≤0.25 μg mL–1.Therefore,the COPDof cefquinome againstE.coliwas 0.25 μg mL–1.The probability density distribution of PTA withE.colistrains in each MIC range are shown in Fig.4.The target value of 52.68%could be reached for more than 90% of the strains during each dosing interval.

Table 1 Analysis of wild-type cut-off (COWT) for cefquinome against Escherichia coli from pigs1)

Table 2 Analysis of wild-type cut-off (COWT) for cefquinome against Staphylococcus aureus from pigs1)

Table 3 PTA of cefquinome 2 mg kg–1 against Escherichia coli in each MIC range after first dose1)
As shown in Table 4,under the treatment with the recommended dose of 2 mg kg–1,the target value (42.91%)could be reached with strains MIC≤0.25 μg mL–1.The COPDof cefquinome toS.aureuswas 0.25 μg mL–1.When the dosage was adjusted to4.5 mg kg–1,the target value 42.91% could be achieved for the strains with MIC of 1 μg mL–1(the MIC90value of 160S.aureusstrains) after the first dose (Table 5).The probability density distribution of PTA withS.aureusstrains in each MIC range,which indicated the therapeutic effects of the cefquinome doses of 2 and 4.5 mg kg–1,respectively (Figs.5 and 6).
4.Discussion
Previous studies demonstrated that the statistical method was a reliable and scientific method for susceptibility breakpoint determination (Ahmadet al.2015;Zhanget al.2016).The ECOFFinder method was used to verify the results in this paper.In this study,the COWTof cefquinome againstE.coliwas 0.125 μg mL–1,and the MIC50and MIC90were 0.06 and 0.25 μg mL–1,respectively.A previous study showed the COWTof cefquinome againstE.coliin black swans was 0.2 μg mL–1,and the MIC50and MIC90were 0.06 and 0.5 μg mL–1,respectively (Zhaoet al.2017).Sheldonet al.(2004) also indicatedE.coliwere susceptible to cefquinome with the MIC50<0.06 μg mL–1.However,the MIC50of 204E.colistrains collected from healthy pigs in Henan Province was 0.5 μg mL–1(Liet al.2018).This discrepancy due to variations in the MIC distribution of strains from different geographical regions or at different times,since the strains analyzed in this study were isolated from 2014 to 2018 (Perez-Tralleroet al.2004).In accordance with the results of our study,the COWTof cefquinome againstS.aureusisolated from cattle was 2 μg mL–1calculated by partial least-squares regression method (Ahmadet al.2015).The MIC90range of cefquinome againstS.aureusshould be in the range from 0.5 to 1 μg mL–1(Perez-Tralleroet al.2004).Alejandroet al.(2017) suggested the MIC50and MIC90of cefquinome againstS.aureusstrains in llamas were 0.25 and 0.5 μg mL–1,respectively.The MIC50and MIC90of cefquinnme againstS.aureusstrains in this study were 0.5 and 1 μg mL–1,respectively,which confirmed the existence of some resistance to cefquinome inS.aureusstrainsfrom pigs in Guangdong Province.Antimicrobial susceptibility testing showed the resistance rate ofS.aureusto cefquinome was 6.25% (10/160).
Pharmacokinetic/pharmacodynamic cut-off is usually determined using a Monte Carlo simulation in Crystal Ball(Sunet al.2015;Zhanget al.2016;Yanget al.2019).The data required for the fitting were dosage,PK/PD target value and pharmacokinetics formula (Maglioet al.2005).However,this method was highly dependent on the pharmacokinetics formula and was limited by the compartment model.As a result,the COPDcalculation for time-dependent drugs was limited to the intravenous administration route (Zhanget al.2017).Tianet al.(2016)developed a new method to determine COPDusing the PK/PD parameter %T>MIC for orally administered drugs.This method replaced the pharmacokinetics formula with a bestfit equation acquired from fitting the true value of %T>MIC under different MIC values using a nonlinear regression method.However,the calculation of %T>MIC in each MIC range using this method is very time-consuming and the equation does not represent the concentration-time changes in each dosing period for multiple doses.Therefore,we modified this method by performing the linear and nonlinear regression analyses to obtain the best-fit equations for the absorption and elimination phases in each dosing period.In addition,multiple doses of cefquinome were considered in this study,thus providing improved fitting accuracy and more informative results.
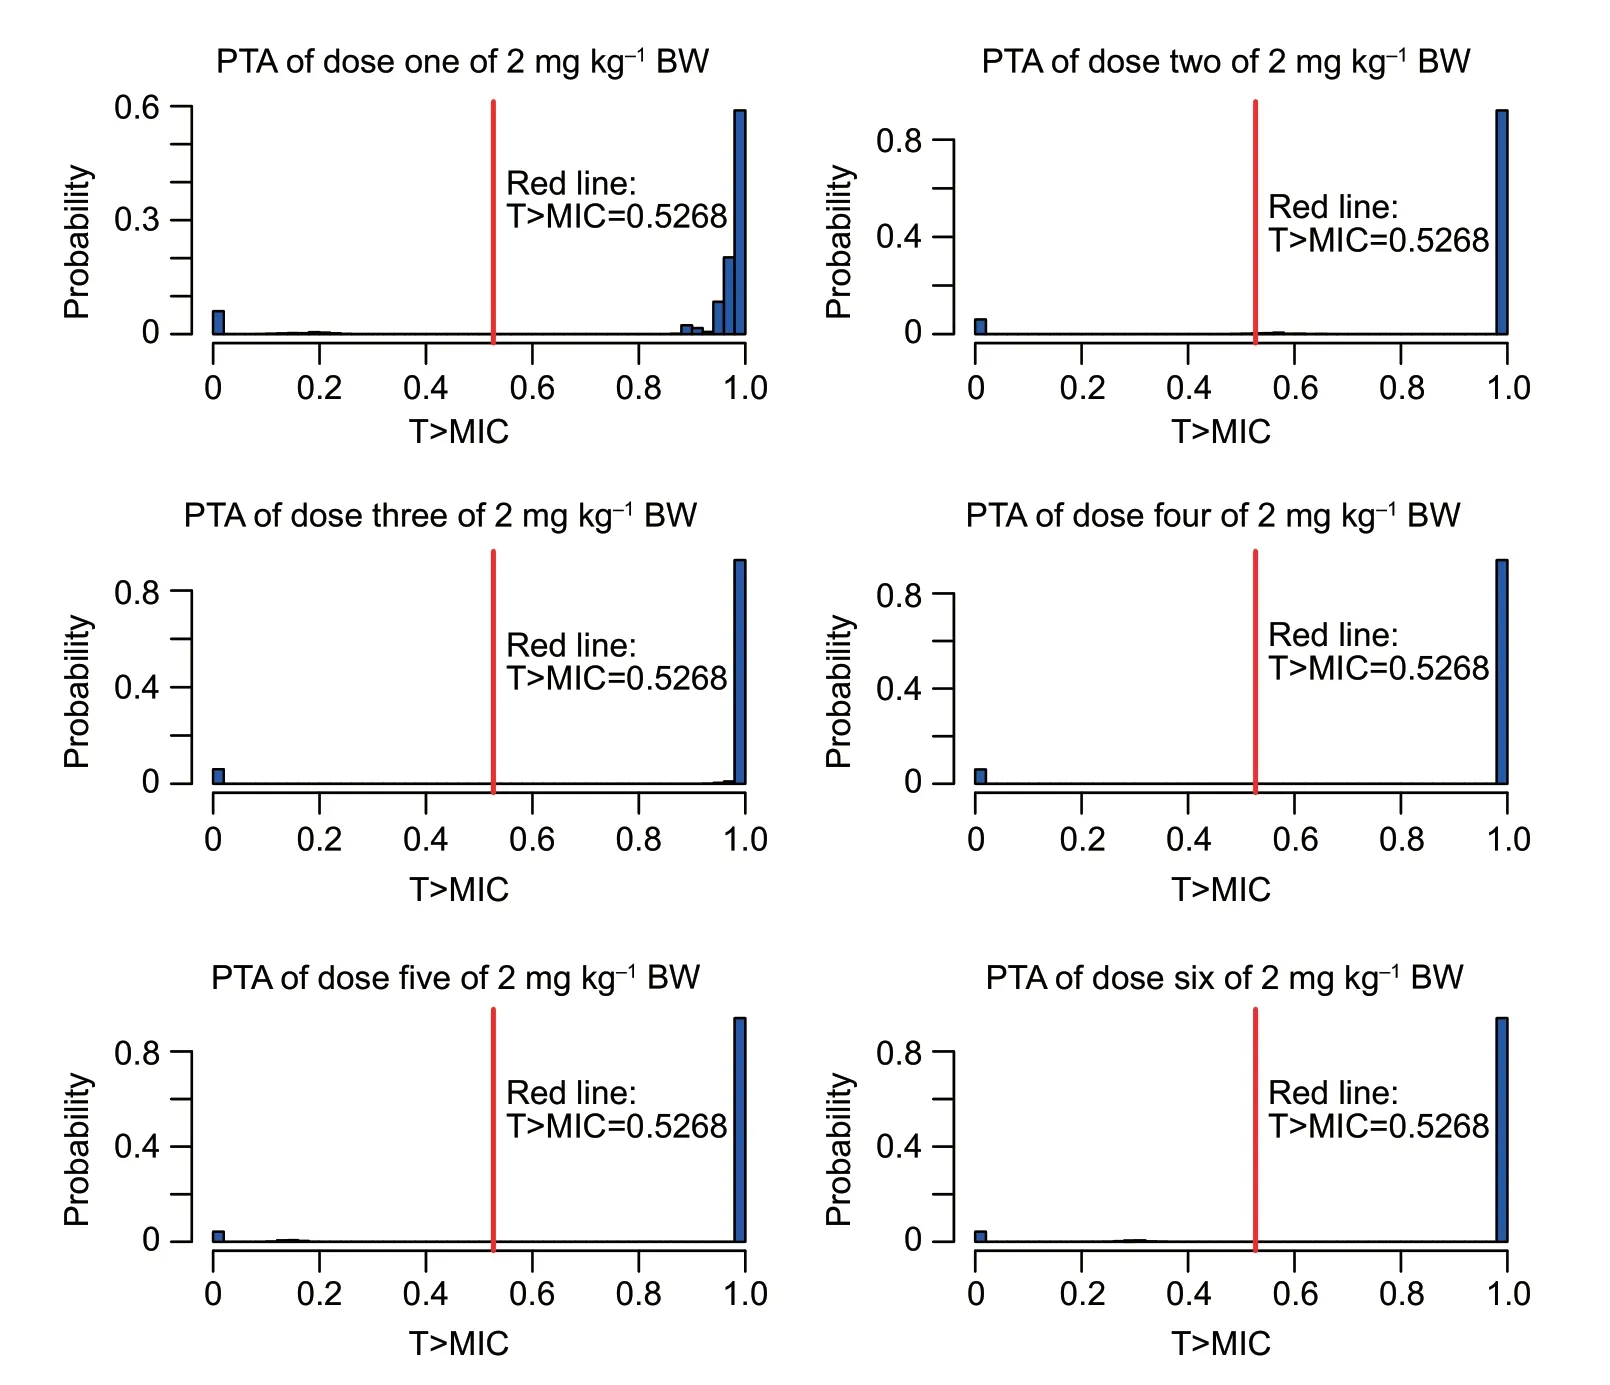
Fig.4 The probability density distribution of probability of target attainment (PTA) of cefquinome 2 mg kg–1 against Escherichia coli in each minimum inhibitory concentration (MIC) range and each treatment period.

Table 4 PTA of cefquinome 2 mg kg–1 against Staphylococcus aureus in each MIC range after first dose1)
The COPDof cefquinome againstE.coliwas 0.25 μg mL–1,which indicated a bactericidal effect could be achieved in strains with MIC≤0.25 μg mL–1.In this study,the range of strains corresponding to COPD(0.25 μg mL–1) of cefquinome againstE.coliwas within the distribution range of the WT strain (COWT=0.125 μg mL–1;Fig.7-A).Furthermore,clinical infections (>90%) could be treated effectively by the recommended dose (Fig.4),thus confirming the reliability of the results of this study.A previous study of the effect of cefquinome onE.coliaccording to the Monte Carlo simulation and indicated that the target value(%T>MIC=50%) could not be achieved by treatment at a dose of 2 mg kg–1,once a day,and a therapeutic effect onE.coliwith MIC≤0.5 μg mL–1may be achieved by adjusting the dosage to 2 mg kg–1twice a day (Zhaoet al.2017).
The COPDof cefquinome againstS.aureuswas 0.25 μg mL–1.That is,the current test dose of 2 mg kg–1can be used to treat infections withS.aureuswith MIC≤0.25 μg mL–1.However,the MICs of mostS.aureuswere higher than 0.25 μg mL–1(Fig.1-B);therefore the predicted treatment efficacy of cefquinome againstS.aureuswas not ideal(Fig.5).Considering the resistance rate ofS.aureuswas relatively low (6.25%),the treatment effect will be slightly affected by drug-resistant bacteria;therefore MIC90was used in the calculation.Sensitivity tests showed the MIC90ofS.aureuswas 1 μg mL–1.When the dosage was adjusted to 4.5 mg kg–1,effective treatment was achieved with 3log10reduction in bacterial count.Furthermore,cefquinome could effectively treat more than 90% of clinical infections caused byS.aureus(Fig.6).Wanget al.(2014) also indicated when cefquinome was used to treat infections caused byS.aureuswith an MIC90of 1.56 μg mL–1,the dosage regimen should be adjusted to 5–6 mg kg–1,twicea day.However,this dose was too high for clinical use.Yanget al.(2019) speculated that the COPD(0.03 μg mL–1)of danofloxacin againstE.coliwas much lower than the epidemiological cut-off value (8 μg mL–1) due to the lower dose of drug administered to pigs.The COPDof cefquinome againstS.aureuswas much lower than the COWT(Fig.7-B)calculated in this study.Several reasons could account for these results.Cefquinome is often used clinically as local treatment (such as breast perfusion) to achieve the effective concentration in the target tissue.In the present study,the concentration was determined in the interstitial fluid using the tissue-cage model,which may be lower than the concentration in the target tissue.In addition,we tested only a small number strains,and there may be some unknown resistance mechanisms in these strains.Further studies based on target tissue concentration and a greater number of strains are required to verify our findings.

Table 5 PTA of cefquinome 4.5 mg kg–1 against Staphylococcus aureus in each MIC range after first dose1)
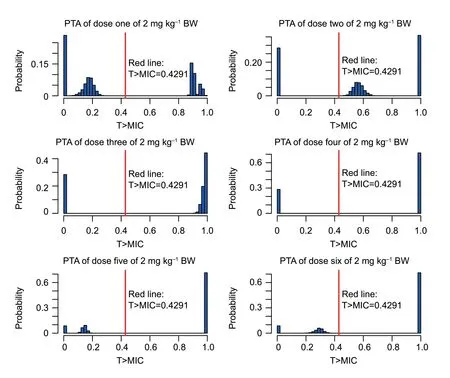
Fig.5 The probability density distribution of probability of target attainment (PTA) of cefquinome 2 mg kg–1 against Staphylococcus aureus in each minimum inhibitory concentration (MIC) range and each treatment period.
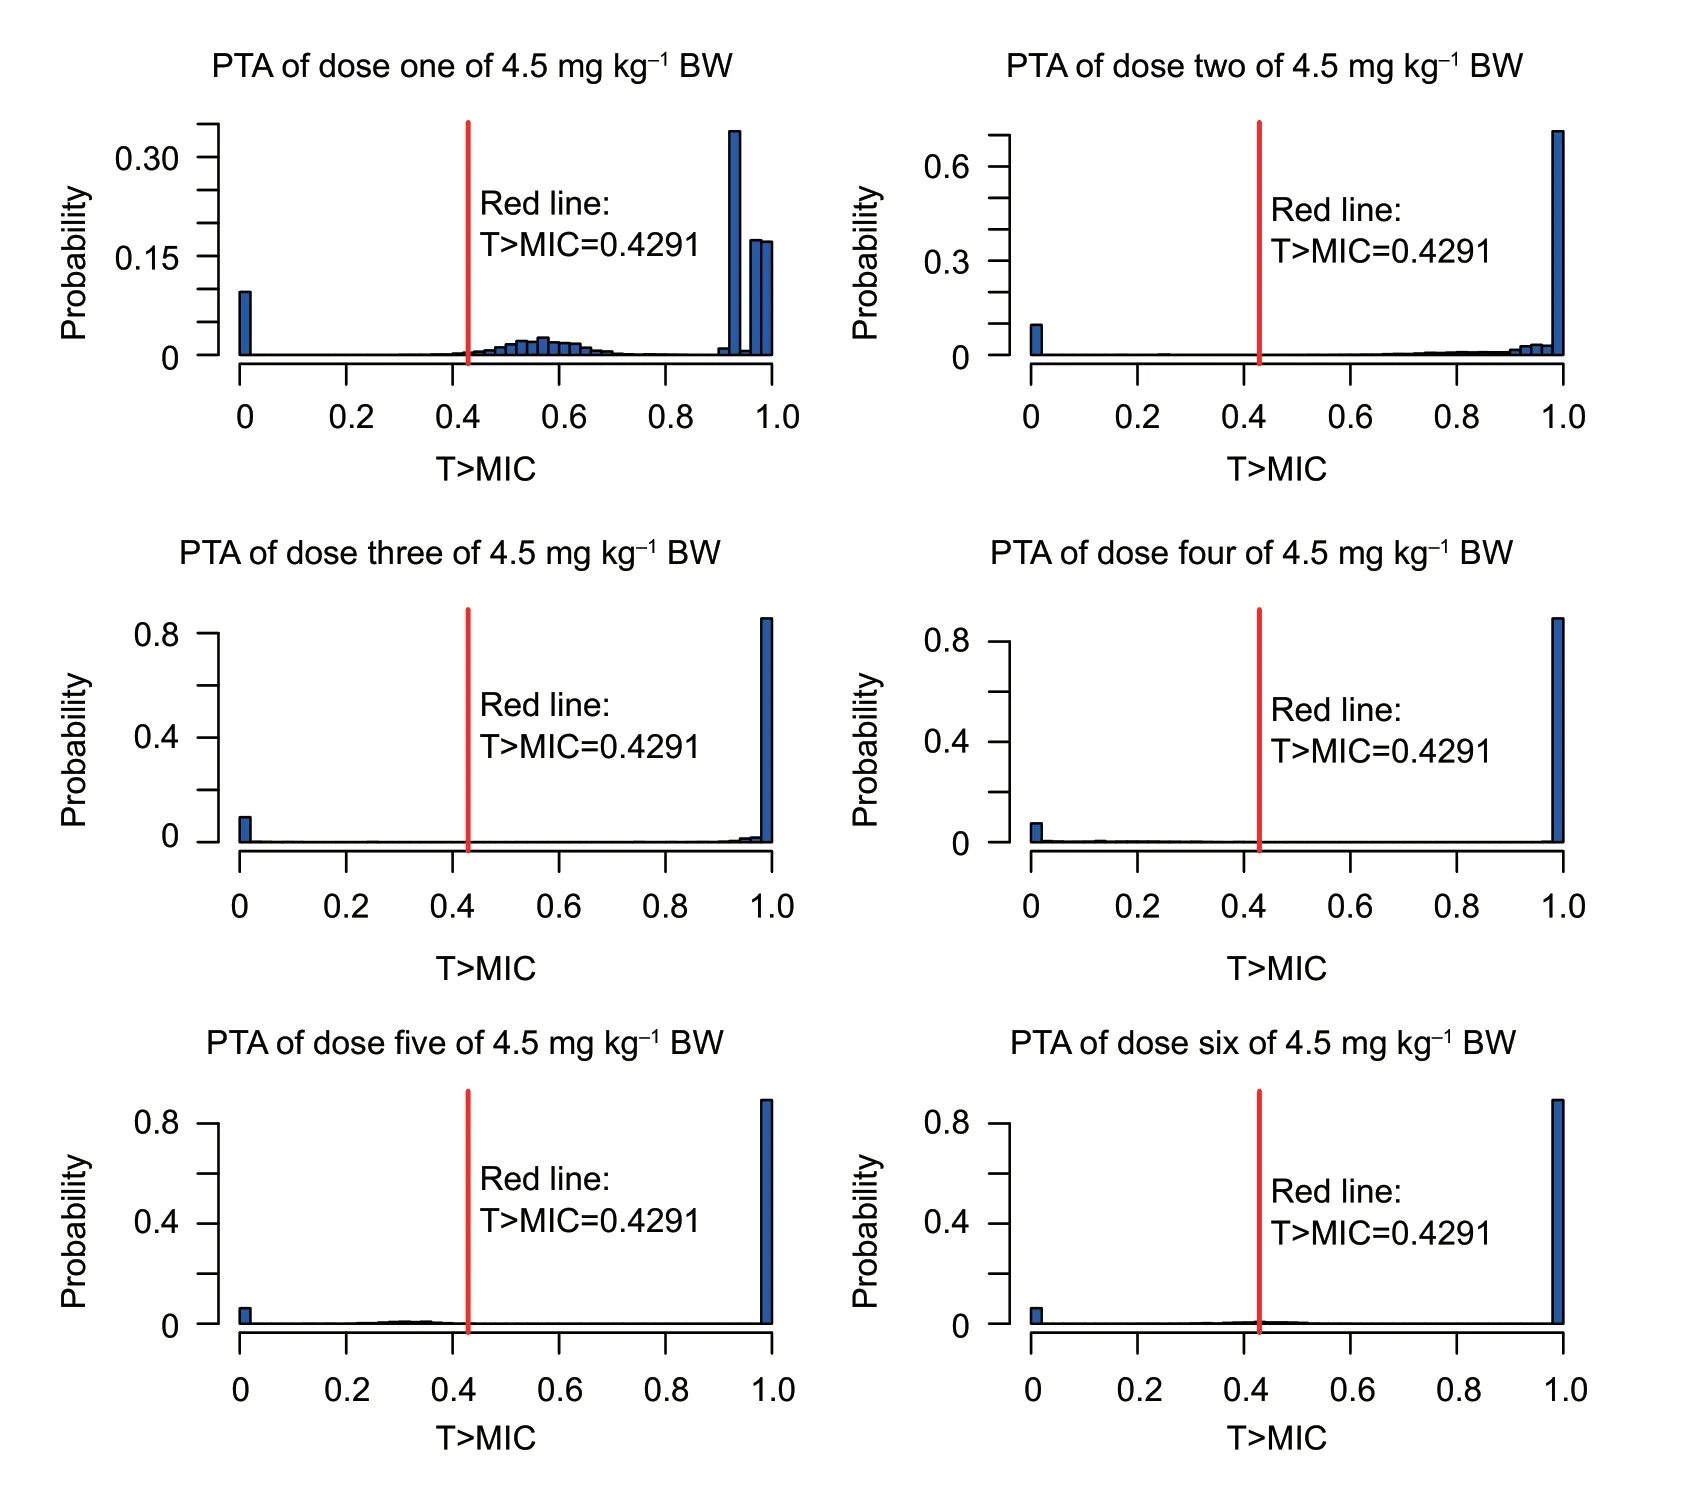
Fig.6 The probability density distribution of probability of target attainment (PTA) of cefquinome 4.5 mg kg–1 against Staphylococcus aureus in each minimum inhibitory concentration (MIC) range and each treatment period.
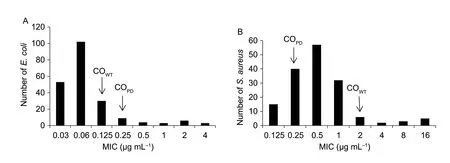
Fig.7 Wild-type cut-off (COWT) and pharmacokinetic/pharmacodynamic cut-off (COPD) for cefquinome against 210 pig-derived Escherichia coli strains (A) and 160 pig-derived Staphylococcus aureus strains (B).MIC,minimum inhibitory concentration.
5.Conclusion
In this work,statistical analysis and the ECOFFinder program showed that the COWTvalues for cefquinome againstE.coliandS.aureuswere 0.125 and 2 μg mL–1,respectively.The COPDwas calculated using a Monte Carlo simulation with modification for time-dependent drugs and multiple doses administration.The COPDvalue for cefquinome againstE.coilandS.aureuswas 0.25 μg mL–1under the recommended dose (2 mg kg–1,twice a day for 3 days).Following adjustment of the dosing regimen to 4.5 mg kg–1,effective treatment was achieved forS.aureusinfections with MIC901 μg mL–1.The difference between COWTand COPDindicates that the resistance of bacteria may cause the failure of clinical treatment.The study suggested that the final sensitivity breakpoint of cefquinome is 0.25 μg mL–1(COPD) forE.coliand 2 μg mL–1(COWT) forS.aureus,and only in this case can effective treatment be achieved in clinical practice.
Acknowledgements
This work was supported by the National Natural Science Foundation of China (31972733).
Declaration of competing interest
The authors declare that they have no conflict of interest.
Ethical approval
All applicable internaltional,national and institutional guidelines for the care and use of animals were followed.
杂志排行
Journal of Integrative Agriculture的其它文章
- Receptor-like kinase OsASLRK regulates methylglyoxal response and content in rice
- Heredity and gene mapping of a novel white stripe leaf mutant in wheat
- Construction of a high-density adzuki bean genetic map and evaluation of its utility based on a QTL analysis of seed size
- Effects of temperature and solar radiation on yield of good eatingquality rice in the lower reaches of the Huai River Basin,China
- Difference in corn kernel moisture content between pre-and postharvest
- The effect of elevating temperature on the growth and development of reproductive organs and yield of summer maize
