High plant density increases seed Bt endotoxin content in Bt transgenic cotton
2021-06-02CHENYuanLIUZhenyuHENGLiLeilaTAMBELCHENDehua
CHEN Yuan,LIU Zhen-yu,HENG Li,Leila I.M.TAMBEL,CHEN De-hua
1 Jiangsu Key Laboratory of Crops Genetics and Physiology/Jiangsu Key Laboratory of Crop Cultivation and Physiology/Agricultural College,Yangzhou University/Jiangsu Co-Innovation Center for Modern Production Technology of Grain Crops,Yangzhou 225009,P.R.China
2 Agricultural Research Cooperation,Biotechnology and Biosafety Research Center,Khartoum 999129,Sudan
Abstract Plant density is the cultivation practice usually employed to manipulate boll distribution,boll setting and yield in cotton production.In order to determine the effect of plant density on the insecticidal protein content of Bacillus thuringiensis (Bt)cotton plants,a study was conducted in Yangzhou University of China in 2015 and 2016.Five plant densities (PD1–PD5,representing 15 000,30 000,45 000,60 000,and 75 000 plants ha–1) were imposed on two Bt cotton cultivars,Sikang 1 (the conventional cultivar,SK-1) and Sikang 3 (the hybrid cultivar,SK-3).The boll number per plant,boll weight and boll volume all decreased as plant density increased.As plant density increased from 15 000 to 75 000 plants ha–1,seed Bt protein content increased,with increases of 66.5% in SK-1 and 53.4% in SK-3 at 40 days after flowering (DAF) in 2015,and 36.8%in SK-1 and 38.6% in SK-3 in 2016.Nitrogen (N) metabolism was investigated to uncover the potential mechanism.The analysis of N metabolism showed enhanced soluble protein content,glutamic-pyruvic transaminase (GPT) and glutamate oxaloacetate transaminase (GOT) activities,but reduced free amino acid content,and protease and peptidase activities with increasing plant density.At 20 DAF,the seed Bt toxin amount was positively correlated with soluble protein level,with correlation coefficients of 0.825** in SK-1 and 0.926** in SK-3 in 2015,and 0.955** in SK-1 and 0.965** in SK-3 in 2016.In contrast,the seed Bt protein level was negatively correlated with free amino acid content,with correlation coefficients of–0.983** in SK-1 and–0.974** in SK-3 in 2015,and–0.996** in SK-1 and–0.986** in SK-3 in 2016.To further confirm the relationship of Bt protein content and N metabolism,the Bt protein content was found to be positively correlated with the activities of GPT and GOT,but negatively correlated with the activities of protease and peptidase.In conclusion,our present study indicated that high plant density elevated the amount of seed Bt protein,and this increase was associated with decreased boll number per plant,boll weight and boll volume.In addition,altered N metabolism also contributed to the increased Bt protein content under high plant density.
Keywords:Bt cotton,plant density,Bt insecticidal protein,nitrogen metabolism
1.Introduction
SinceBacillus thuringiensis(Bt) transgenic cotton was first commercialized in the mid-1990s,it has been extensively planted worldwide (Huanget al.2010;James 2013;Qiaoet al.2017).The application of Bt cotton reduced chemical use,and thus decreased environmental pollution and enhanced worker safety.Besides the environmental benefit,the use of Bt cotton also increased the income of growers by reducing the insecticidal damage and pesticide inputs (Wuet al.2008;Qiaoet al.2017).However,in cotton production regions around world,failed or unstable performance of insecticidal resistance due to adverse environments or different growth periods have been reported (Olsenet al.2005;Dong and Li 2007;Shenet al.2010;Stone 2011;Chenet al.2012;Zhanget al.2012;Wanget al.2019).Thus,it is important to realize the full transgenic genetic potential in Bt cotton production to promote insect resistance management.
As an easily adjusted cultivation practice,plant density is an efficient factor for manipulating the boll distribution and occurrence (Gwathmey and Clement 2010;Yang and Zhou 2010).Along with its effect on boll distribution,plant density could also influence yield components such as boll weight and boll number (Siebert and Stewart 2006;Boquet and Clawson 2009).It was reported that high plant density is related to smaller individual plants and bolls(Nicholset al.2004).According to previous research,boll size could affect the boll insecticidal protein content (Wanget al.2009),and other boll physiological parameters such as boll number and boll volume were also closely related to the Bt protein amount (Chenet al.2019).Therefore,it is highly possible that plant density would influence the boll physiological parameters,and thus the Bt content in cotton bolls.However,limited attention has been paid to the impact of plant density on insecticidal protein content in cotton bolls,which contributes to final yield.In addition,previous studies found that nitrogen (N) metabolism was closely related with insecticidal concentration in Bt cotton.Decreased Bt toxin level usually occurred under high temperature,salinity stress,N deficit,and drought stress,and this reduction was a result of reduced N metabolism capacity due to adverse environments(Chenet al.2012,2018,2019,2021;Wanget al.2018).Thus,it is important to study the N metabolism under altered plant density to illustrate the underlying mechanism in this process.Therefore,we hypothesized that plant density would affect the seed insecticidal protein level,and altered N metabolism may play an important role in this process.The primary objective of this study was to determine the effect of plant density on the amount of Bt protein;and the second objective was to study the N metabolism in this process to uncover the potential mechanism.
2.Materials and methods
2.1.Plant materials and field design
In 2015 and 2016,randomized complete block designs with three replications were applied at Yangzhou,China(32°30´N,119°25´E).Five plant densities (PD1–PD5,15 000,30 000,45 000,60 000,and 75 000 plants ha–1) were imposed on two Cry1Ac transgenic cotton cultivars (Sikang 1(SK-1,conventional) and Sikang 3 (SK-3,hybrid)).Each plot consisted of eight rows with 6-m rows spaced 0.9 m apart.To avoid border effects,samples were taken in the middle four rows of each plot.Seeds were spaced evenly within a row.
Seeds were sown on April 6th in 2015 and April 9th in 2016 in the greenhouse.Seedlings were transplanted to the field on May 19th in 2015 and May 17th in 2016.The soil had a sandy loam texture (typical fluvaquents,entisols),and contained 21.9 and 22.5 g kg–1organic matter,available N-P-K of 20.8,21.6 and 20.9 mg kg–1in 2015;and 87.0,85.6 and 86.8 mg kg–1in 2016.N (60 kg ha–1as N),P(300 kg ha–1as single superphosphate) and K (120 kg ha–1as KCl) were applied before transplanting.N (54 kg ha–1as N),P (300 kg ha–1as single superphosphate) and K(120 kg ha–1as KCl) were top-dressed at early flowering.N as urea was again top-dressed at early boll developing stage (126 kg ha–1as N) and at peak boll stage (30 kg ha–1).Furrow irrigation was used to water plants when necessary during the growing season.Disease prevention,and insect and weed control were performed according to the local recommendations.
2.2.Sample collection
A total of 250 white flowers from the 1st sympodial fruiting position of the 4th to 6th fruiting branches were tagged per plot at peak flower period.Tags of different colors were used to differentiate the various tagging dates.Bolls were collected at 10,20,30,and 40 days after flowering(DAF) and subjected to measurements.Fifteen bolls from each plot were sampled at each time period for seed Bt protein contents,boll growth parameters and N metabolism measurement.Five bolls were frozen with liquid N,and used for Bt protein content and N metabolic chemical measurements,and the remaining 10 bolls were used for boll weight and boll volume determination.Boll numbers from 10 plants in each plot were recorded.
2.3.Data collection
Boll volume was determined by submerging the boll into water in a measuring cylinder and recording the resulting water displacement.Bt endotoxin content was analyzed by immunological analysis (ELISA) according to Chenet al.(1997).Total free amino acid content was analyzed by ninhydrin assay according to Yemmet al.(1955).We detemined total soluble protein concentration by Coomassie blue dye-binding assay according to Bradfordet al.(1976).Seed samples (0.2 g) were homogenized in 5 mL of 0.05 mmol L–1Tris-HCl buffer (pH 7.2) and the homogenate was centrifuged at 26 100×g at 4°C for 10 min.The supernatant was used to determine GPT and GOT activities according to Tonhazyet al.(1950).Seed samples (0.8 g)were homogenized at 4°C in 1 mL of β-mercaptoethanol extraction buffer,and the supernatant was collected to analyze protease activity (Vance and Johnson 1979).Seed samples (0.5 g) were homogenized in 8 mL Tris-HCl buffer at 4°C and analyzed for peptidase activity following the procedure described by Setlow (1975).
2.4.Statistics analysis
The statistical significance between means was analyzed by analysis of variance (ANOVA) using PROC GLM in SAS 9.4(SAS Institute,NC,USA).Multiple mean comparisons were evaluated by LSD test atP<0.05.The Pearson correlation coefficient was calculated to determine the relationship between two parameters.
3.Results
3.1.Plant density and boll growth characteristics
The boll number per plant increased during the growth season in both years.However,with increasing plant density,fewer bolls per plant were detected in both cultivars(Table 1).At 40 DAF,with increasing plant density from PD1 to PD5,the decrease in the boll number was 72% in SK-1 and 85% in SK-3 in 2015.In 2016,a similar trend was observed but the decrease was not as great as in 2015.The decrease in the boll number in PD5 was 40% in SK-1 and 51% in SK-3,relative to PD1.A greater decline caused by high plant density was noted in SK-3 than in SK-1,which indicated that SK-3,the hybrid cultivar with greater boll numbers,was more sensitive to the altered plant density.
In the growth seasons of 2015 and 2016,individual boll volumes decreased as plant density increased in both cultivars (Table 2).In 2015,compared with PD1,thedeclines in PD2,PD3,PD4,and PD5 were 4.0,4.8,6.4,and 8.1% in SK-1 and 3.4,6.8,10.2,and 14.4% in SK-3 at 40 DAF.In 2016,the decreases in PD2,PD3,PD4,and PD5 were 7.7,15.2,20.5,and 28.1% in SK-1 and 5.6,13.9,18.5,and 22.1% in SK-3 at 40 DAF.The extent of decrease of the boll volume was greater in 2016 than in 2015.

Table 1 The effect of plant density on boll number per plant during the boll developing period in 2015 and 2016

Table 2 The effect of the plant density on boll volume (cm3) during the boll developing period in 2015 and 2016
The individual boll dry weights also decreased under high plant density in both tested cultivars (Table 3).In 2015,in comparison to PD1,the boll dry weight in PD5 was reduced by 39.6% in SK-1 and by 26.7% in SK-3 at 40 DAF.In 2016,the decrease in PD5 was 24.5% in SK-1 and 23.2%in SK-3 at 40 DAF.A greater decrease in boll dry weight was observed in SK-1,indicating SK-1 was more sensitive to elevated plant density.
3.2.Plant density and seed Bt protein content
The seed Bt protein amount increased during the growth season,and it was elevated with increasing plant density in both cultivars (Table 4).The highest Bt protein content was detected under PD5,and the lowest content was detected under PD1.In 2015,PD5 treatment increased the seed Bt protein content by 66.5% in SK-1 and by 53.4% in SK-3 relative to PD1 at 40 DAF.In 2016,the elevation of seed Bt protein content caused by PD5 was 36.8% in SK-1 and 38.6% in SK-3 compared to PD1 at 40 DAF.The extent of increase in seed Bt protein content caused by enhanced plant density was greater in 2015 than in 2016.
3.3.The correlation between boll growth characteristics and Bt protein level in cotton seeds
At 20 DAF,the seed Bt protein level was negatively correlated with boll number per plant in 2015 (r=−0.966**)and 2016 (r=−0.854*).Similarly,seed Bt protein level was negatively correlated with boll volume in 2015 (r=−0.862**)and 2016 (r=−0.800**),and seed Bt protein level was negatively correlated with boll dry weight in 2015 (r=−0.956**)and 2016 (r=−0.744**) (Fig.1).Across the whole growth season,the negative correlation was the highest between boll weight and Bt protein amount,followed by boll number and Bt protein amount,and the lowest was between boll volume and Bt protein amount (data not shown).There were stronger correlations in 2015 than 2016,but no differences were observed between cultivars SK-1 and SK-3 (data not shown).Therefore,a stronger correlation was noted between boll dry weight and seed Bt level,especially in 2015.

Table 3 The effect of the plant density on boll dry weight (g) during the boll developing period in 2015 and 2016

Table 4 The effect of the plant density on the seed Bt protein level (ng g–1 FW) during the boll developing period in 2015 and 2016
3.4.Plant density and seed N metabolism
Elevations in both free amino acid and soluble protein levels in seeds were detected during the growth season.In contrast,the trends of free amino acid and soluble protein levels varied with different plant densities,seed free amino acid level declined but the seed soluble protein content was enhanced under higher plant density (Figs.2 and 3).The increase of soluble protein content in PD5 was 27.8%in SK-1 and 19.9% in SK-3 in 2015,and the enhancement was 33.3% in SK-1 and 17.3% in SK-3 in 2016,compared to PD1.In contrast,the decline of free amino acid caused by PD5 was 22.2% in SK-1 and 33.9% in SK-3 in 2015,and the decrease was 19.1% in SK-1 and 30.4% in SK-3 in 2016,relative to PD1.
As the key enzymes in amino acid synthesis,GPT and GOT activities were both enhanced under high plant density(Figs.4 and 5).Compared to PD1,the increase of GPT activity in PD5 was 37.2% in SK-1 and 18.4% in SK-3 in 2015,and the enhancement was 22.3% in SK-1 and 15.4%in SK-3 in 2016.Similarly,GOT activity was enhanced by 31.0% in SK-1 and 18.4% in SK-3 in 2015,and the increase was 44.9% in SK-1 and 15.4% in SK-3 in 2016.Greater increases of GOT and GPT activities were observed in SK-1 than SK-3 when plant density was elevated.
The activities of protease and peptidase,the enzymes involved in protein decomposition,were elevated during the growth season,but declined under higher plant density(Figs.6 and 7).In comparison to PD1,PD5 treatment decreased protease activity by 22.5% in SK-1 and 42.3%in SK-3 in 2015,and by 23.9% in SK-1 and 45.6% in SK-3 in 2016.For the activity of peptidase,the decrease in PD5 was 15.0% in SK-1 and 36.4% in SK-3 in 2015,and 15.0%in SK-1 and 38.8% in SK-3 in 2016.Greater decreases of protease and peptidase activities were observed in SK-3 than in SK-1 with increasing plant density.
3.5.The correlation of Bt protein amount with N metabolism parameters
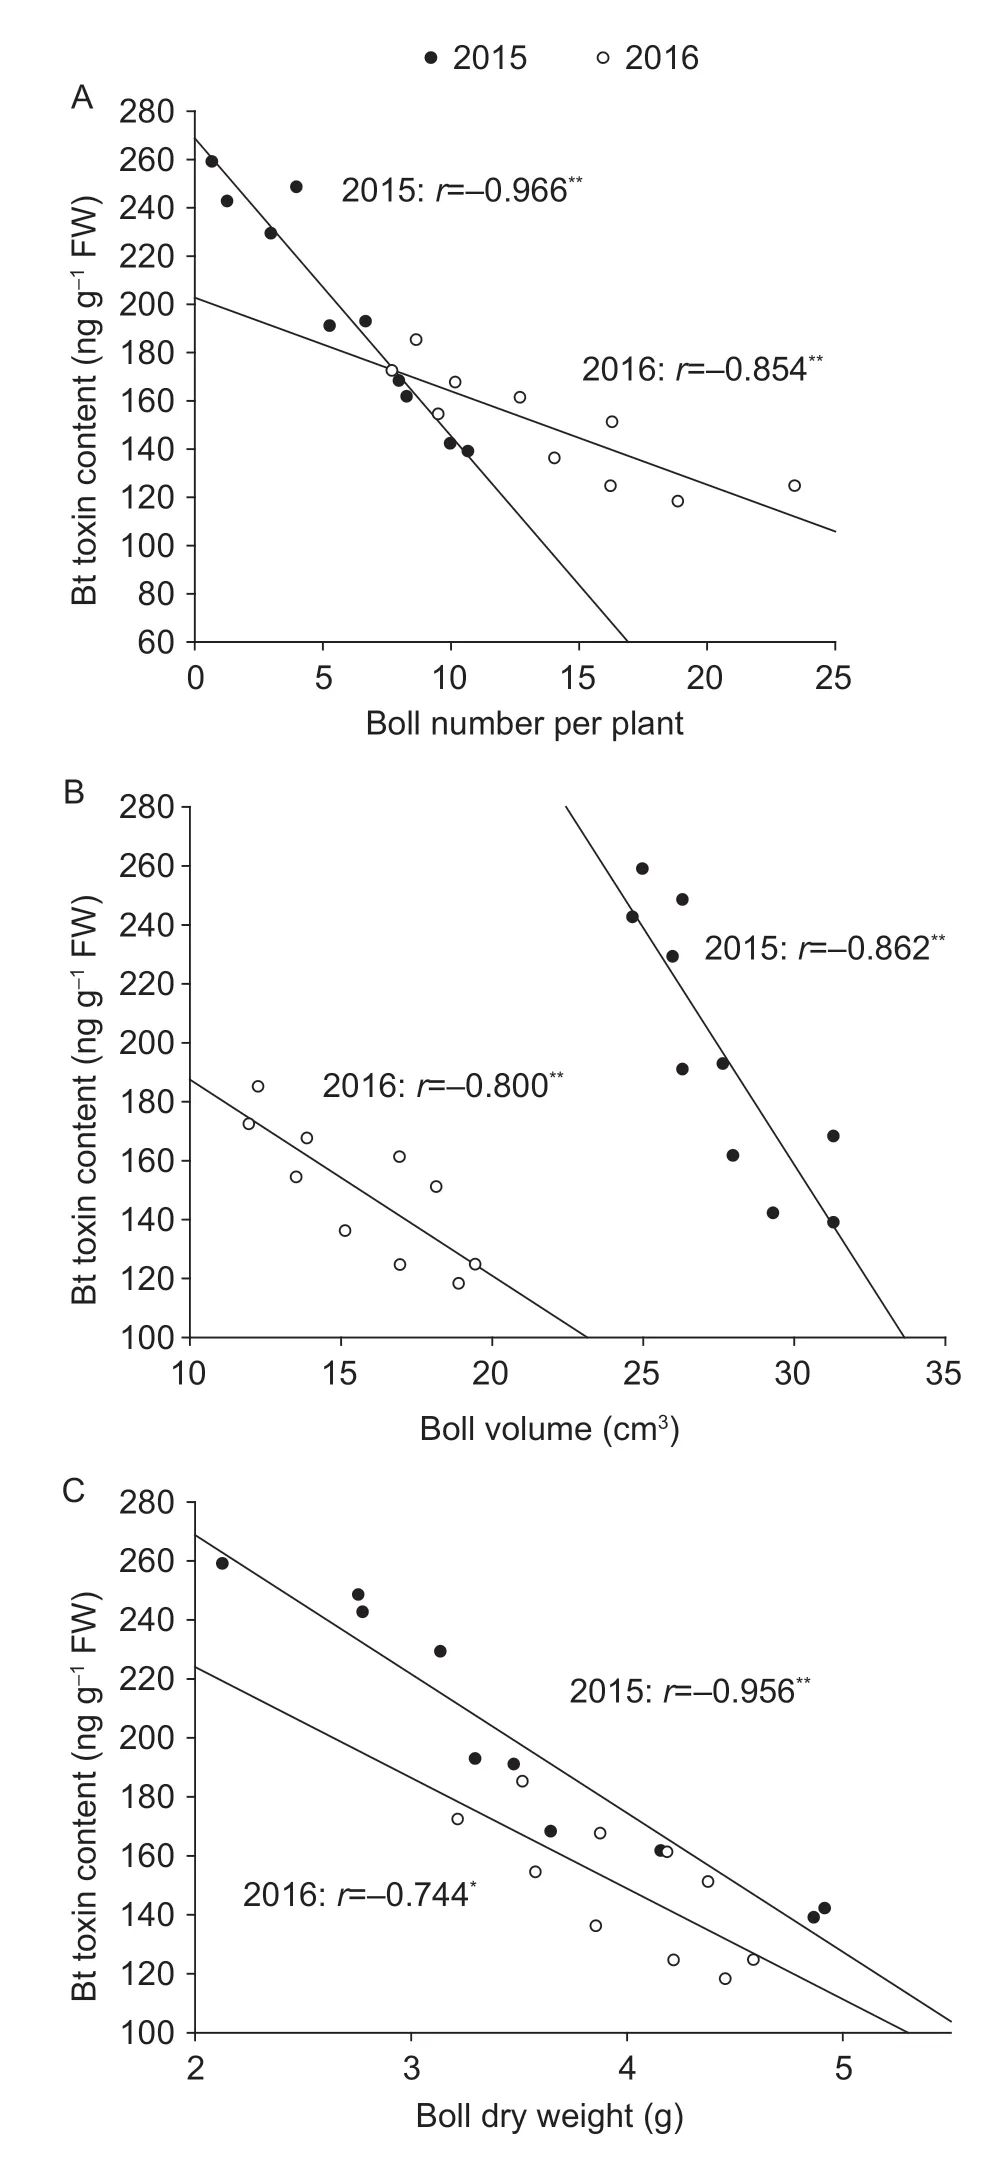
Fig.1 Correlations between seed Bt protein level and boll number per plant (A),boll volume (B) and boll dry weight (C)at 20 days after flowering in 2015 and 2016.Asterisks indicate significance at the 0.05 (*) and 0.01 (**) levels.
Across the whole growth season in each year,there was a significant positive correlation between soluble protein level and seed Bt toxin level,with values of 0.825**for SK-1 and 0.926**for SK-3 in 2015,and 0.955**for SK-1 and 0.965**for SK-3 in 2016.In addition,seed Bt toxin level was significantly positively correlated with activities of GPT and GOT,but negatively correlated with free amino acid level,as well as activities of protease and peptidase (Table 5).
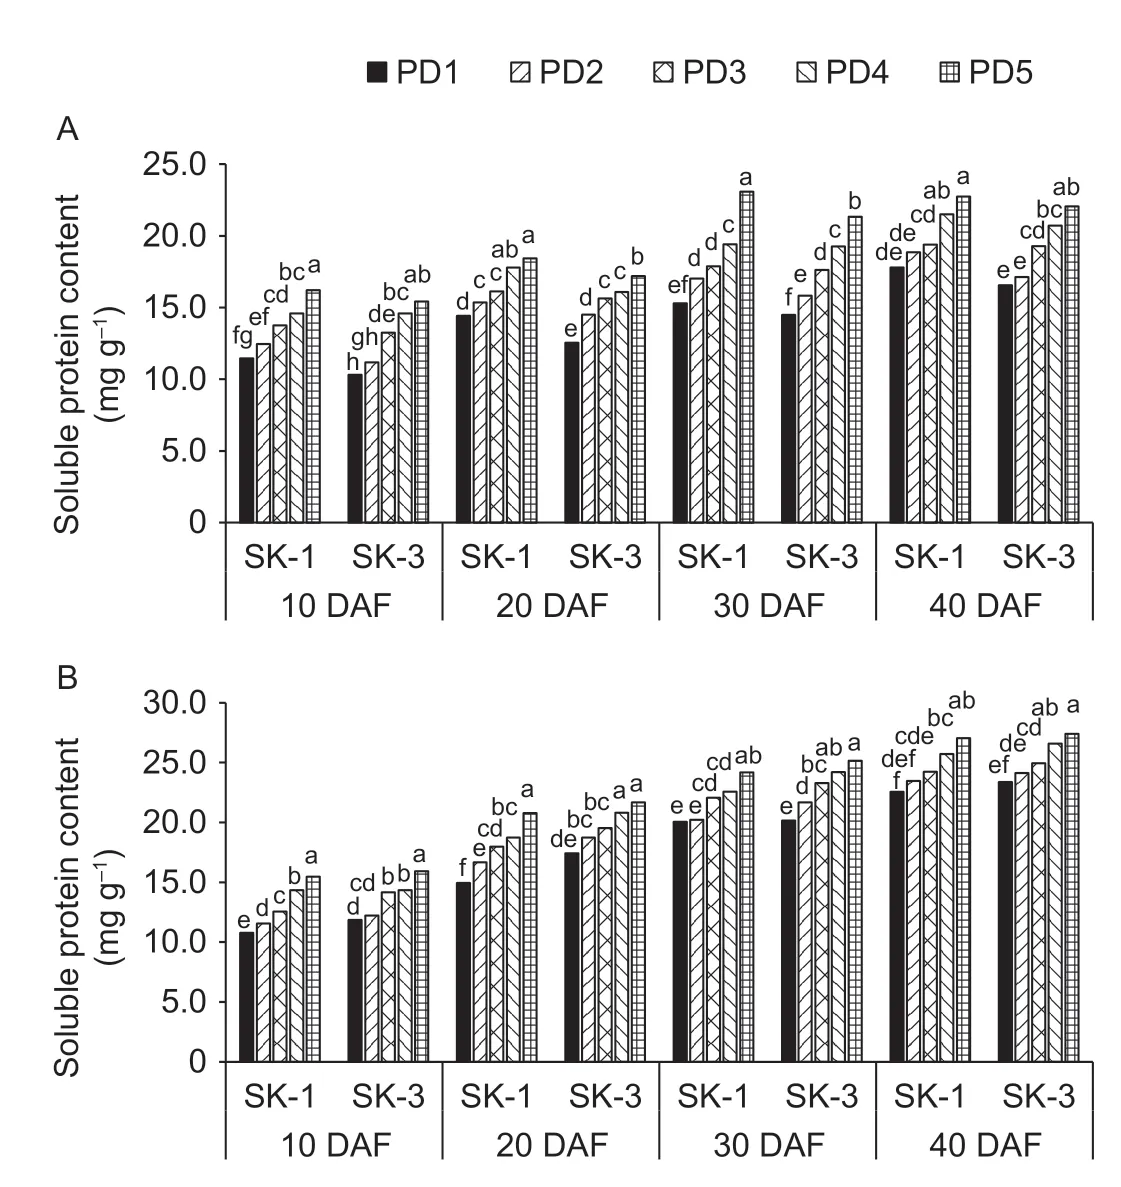
Fig.2 The effect of the plant density on seed soluble protein level during the boll developing period in 2015 (A) and 2016 (B).SK-1 and SK-3,Sikang 1 and Sikang 3,respectively.PD1–5,15 000,30 000,45 000,60 000,and 75 000 plants ha–1,respectively.DAF,days after flowering.The same letters among treatments within the two cultivars at each sampling date represent non-significant differences (LSD test at 0.05 significant level).
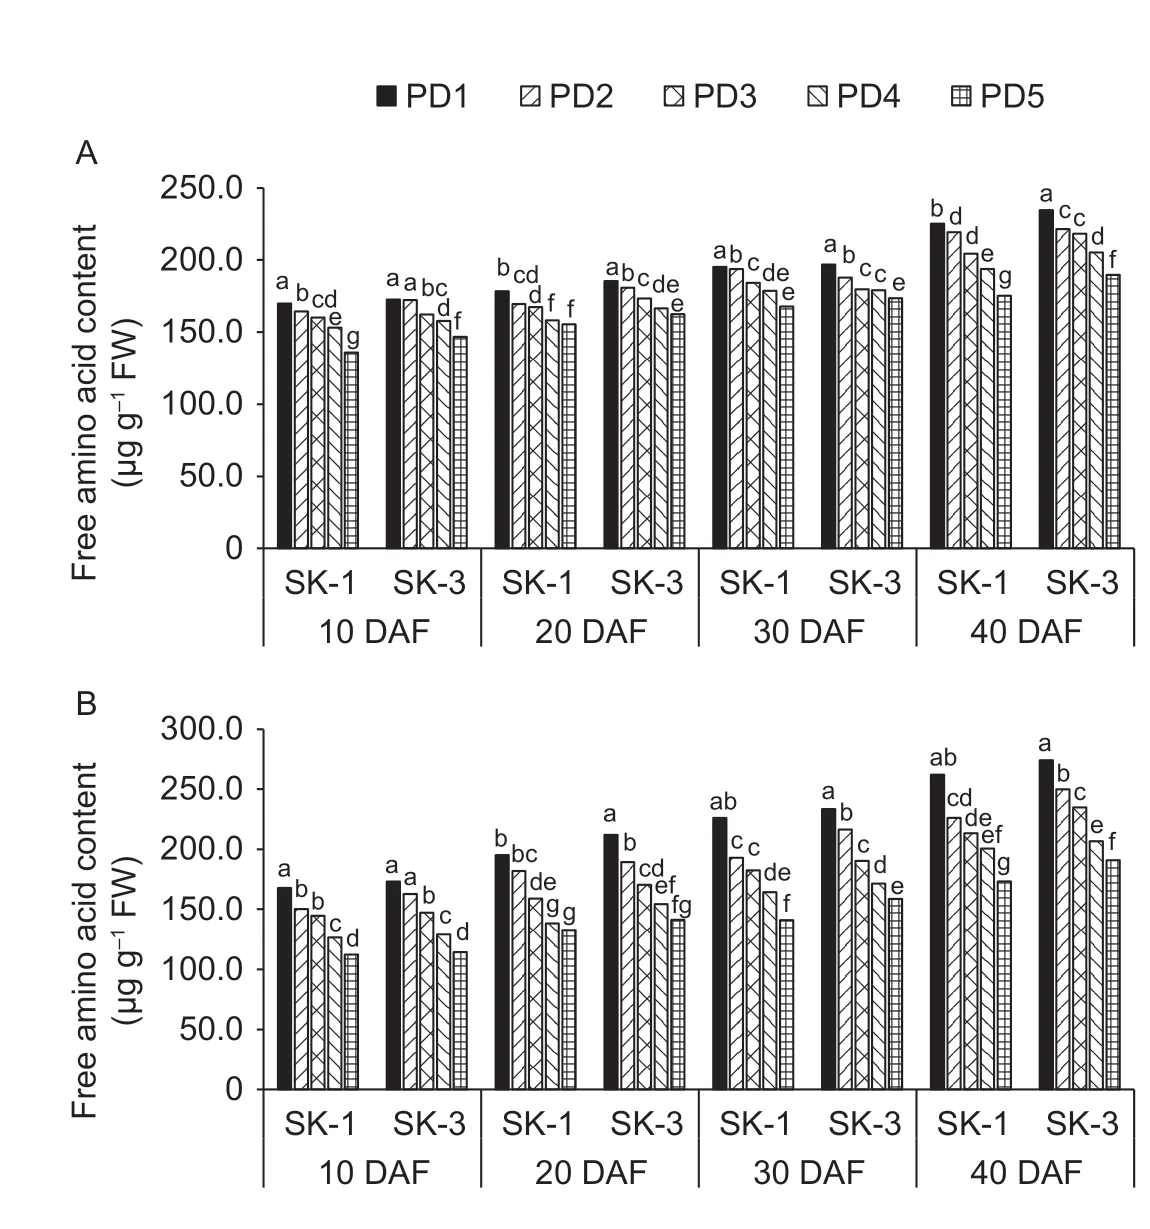
Fig.3 The effect of the plant density on seed free amino acid content during the boll developing period in 2015 (A) and 2016 (B).SK-1 and SK-3,Sikang 1 and Sikang 3,respectively.PD1–5,15 000,30 000,45 000,60 000,and 75 000 plants ha–1,respectively.DAF,days after flowering.The same letters among treatments within the two cultivars at each sampling date represent nonsignificant differences (LSD test at 0.05 significant level).
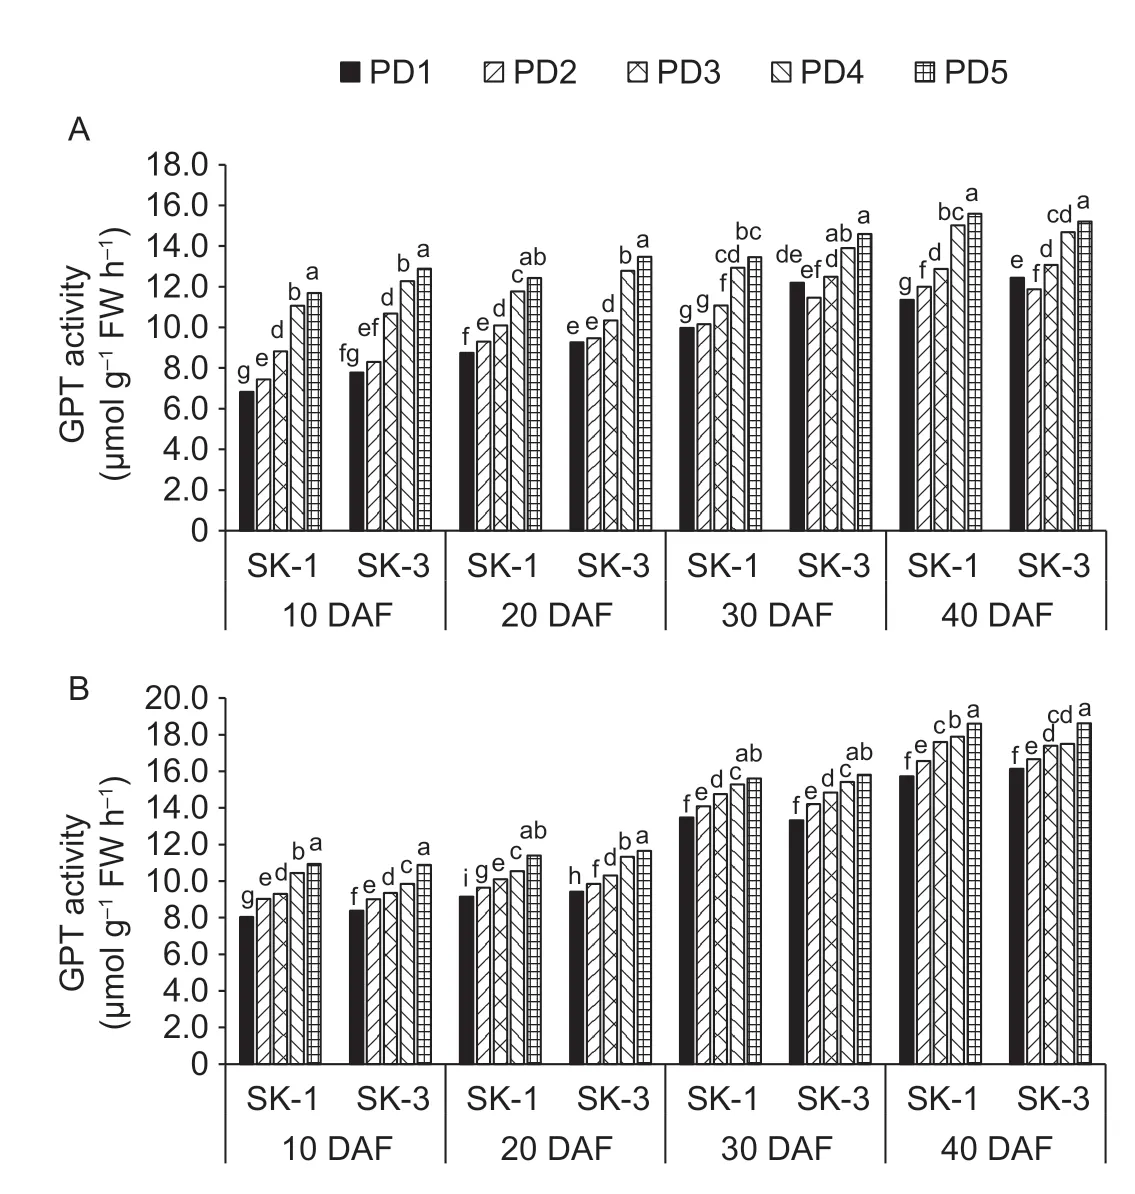
Fig.4 The effect of the plant density on seed glutamic-pyruvic transaminase (GPT) activity during the boll developing period in 2015 (A) and 2016 (B).SK-1 and SK-3,Sikang 1 and Sikang 3,respectively.PD1–5,15 000,30 000,45 000,60 000,and 75 000 plants ha–1,respectively.DAF,days after flowering.The same letters among treatments within the two cultivars at each sampling date represent non-significant differences (LSD test at 0.05 significant level).
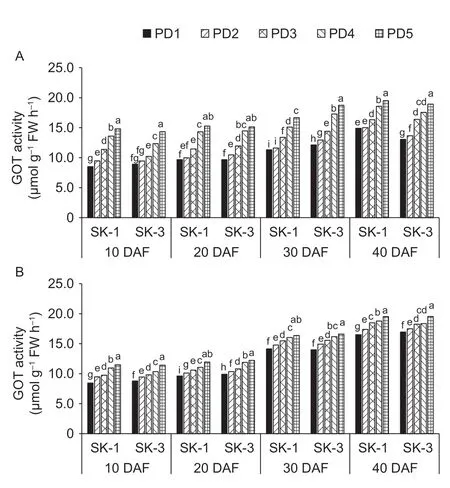
Fig.5 The effect of the plant density on seed glutamic-oxaloacetic transaminase (GOT) activity during the boll developing period in 2015 (A) and 2016 (B).SK-1 and SK-3,Sikang 1 and Sikang 3,respectively.PD1–5,15 000,30 000,45 000,60 000,and 75 000 plants ha–1,respectively.DAF,days after flowering.The same letters among treatments within the two cultivars at each sampling date represent non-significant differences (LSD test at 0.05 significant level).
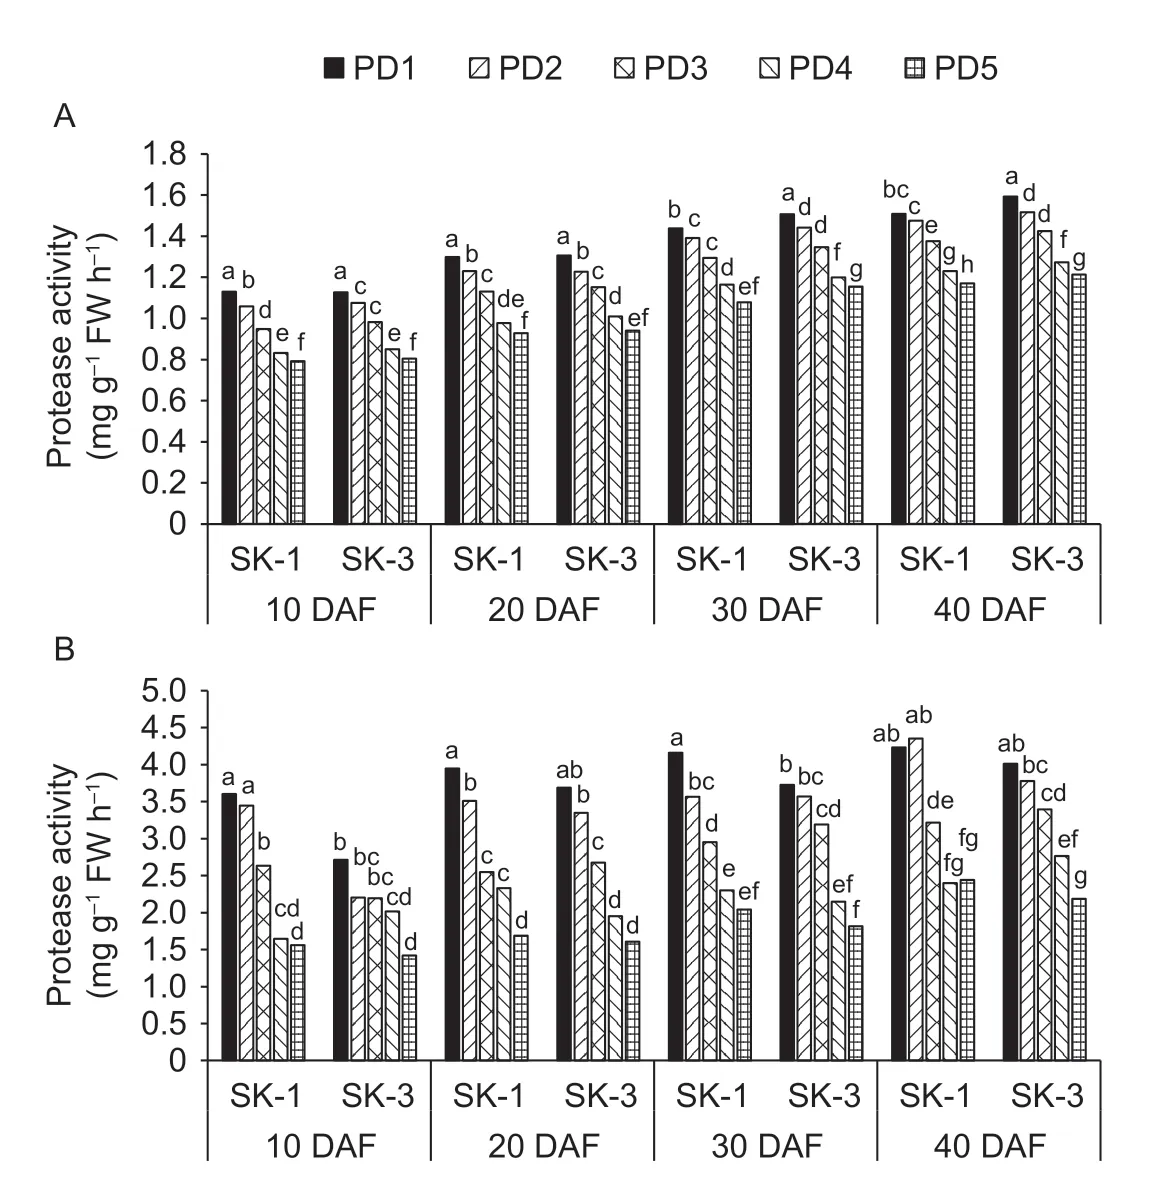
Fig.6 The effect of the plant density on seed protease activity during the boll developing period in 2015 (A) and 2016 (B).SK-1 and SK-3,Sikang 1 and Sikang 3,respectively.PD1–5,15 000,30 000,45 000,60 000,and 75 000 plants ha–1,respectively.DAF,days after flowering.The same letters among treatments within the two cultivars at each sampling date represent non-significant differences (LSD test at 0.05 significant level).
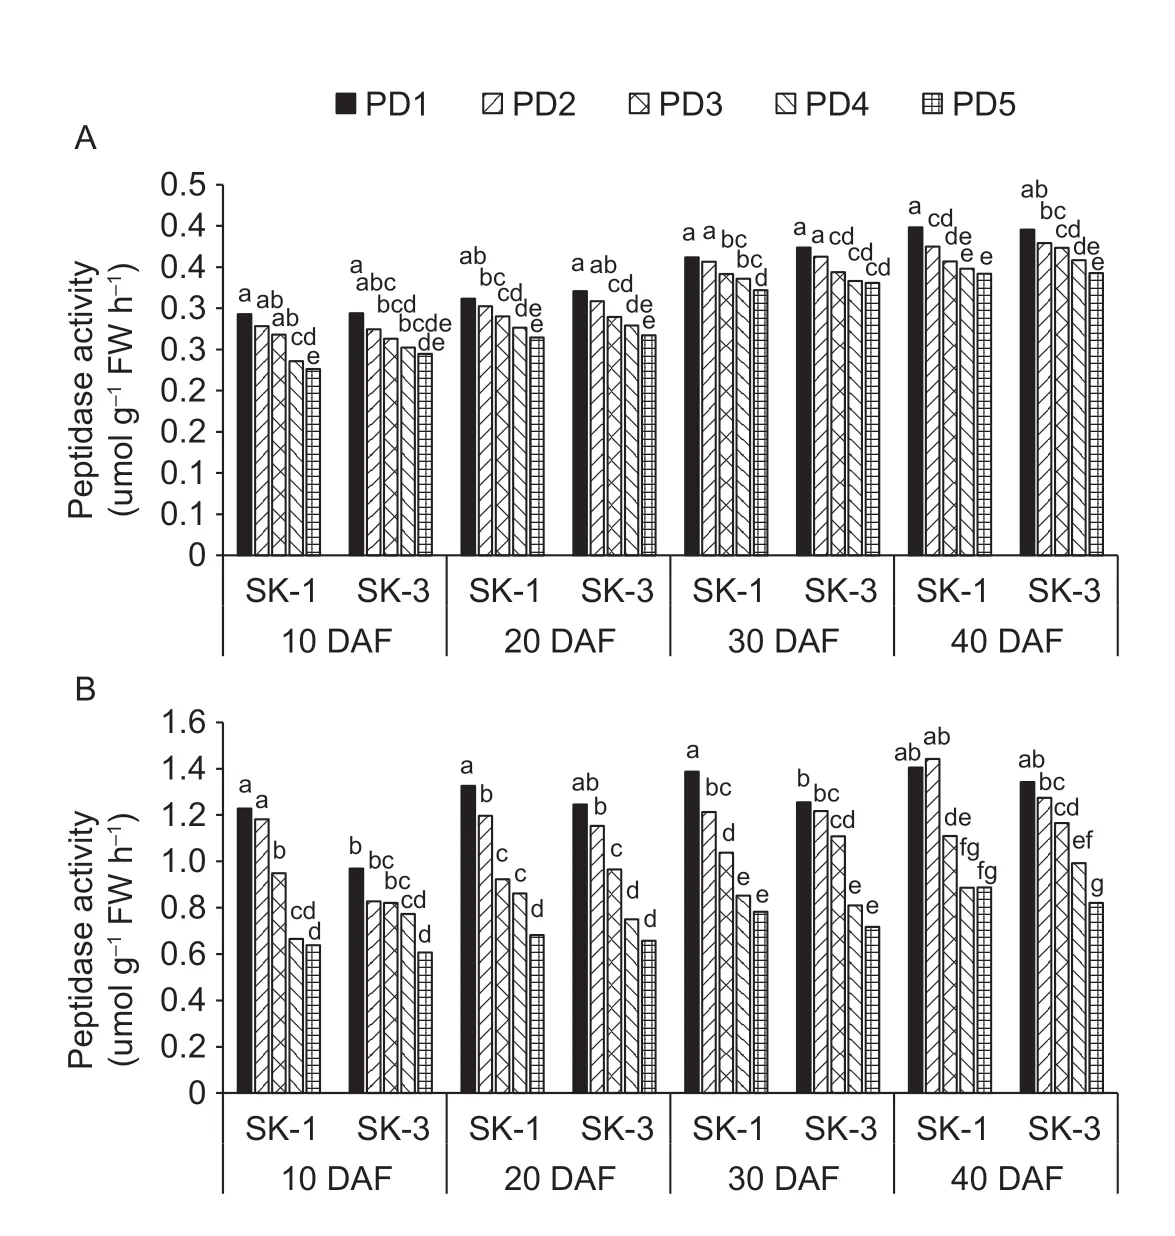
Fig.7 The effect of the plant density on seed peptidase activity during the boll developing period in 2015 (A) and 2016 (B).SK-1 and SK-3,Sikang 1 and Sikang 3,respectively.PD1–5,15 000,30 000,45 000,60 000,and 75 000 plants ha–1,respectively.DAF,days after flowering.The same letters among treatments within the two cultivars at each sampling date represent non-significant differences (LSD test at 0.05 significant level).

Table 5 The correlations of Bt protein amount with nitrogen metabolism parameters1)
4.Discussion
4.1.High plant density increased seed Bt toxin concentration
Our present results revealed that higher plant density led to significantly decreased boll weight,boll volume and boll number per plant,but an elevated amount of seed Bt protein,with the greatest Bt protein content detected under the highest plant density.According to previous research,both plant structure and final yield of cotton plants could be influenced by plant density (Siebert and Stewart 2006;Boquet and Clawson 2009).Through the manipulation of boll development and boll formation by changing plant density,the cotton yield was relatively stable across a range of plant densities (Bednarzet al.1962;Jones and Wells 1998;Donget al.2010).At optimum plant density,the maximum lint yield could be obtained,and this optimum plant density was associated with the specific cultivar,local climate conditions and cropping system applied (Bridgeet al.1973;Elshinnawyet al.1990;Hallikeriet al.2010).In addition,boll distribution was also affected by high plant density,with increased inner boll formation and decreased outer boll formation observed under high density (Siebert and Stewart 2006;Gwathmey and Clement 2010).Therefore,adjusting plant density is usually used in cotton production for managing yield and manipulating yield distribution,and in our present study,it was found that plant density also affected the amount of Bt toxin.
Our analysis confirmed significant negative correlations of seed Bt toxin level with cotton growth parameters.This result was comparable to that of Chen (2018),who found that a higher dose of N application elevated boll growth parameters,but reduced the amount of shell Bt toxin,and the shell Bt toxin level was negatively correlated with growth parameters.Moreover,Wanget al.(2009) adjusted boll volume by leaf cuts and square cuts and found a significant negative correlation between shell Bt toxin level and boll volume in Bt cotton.Thus,plant density could influence boll growth characteristics such as boll number,boll weight and boll volume,and thus affect seed Bt toxin content.In addition,previous research reported that high plant density would decrease square Bt protein content (Chenet al.2017).Thus,together with our present study,plant density can affect Bt protein content in reproductive organs.
4.2.N metabolism level affected Bt content
The increased plant density significantly decreased the activities of protease and peptidase,but increased the activities of GPT and GOT in cotton seeds.Moreover,free amino acid content was reduced but soluble protein content was enhanced as plant density increased.According to the correlation analysis,across the whole growth season,the amount of seed Bt toxin was positively correlated with soluble protein level and the activities of GPT and GOT.In contrast,the level of seed Bt protein was negatively correlated with free amino acid level and the activities of protease and peptidase.Thus,the enhancement of Bt protein content with increasing plant density may be a result of altered N metabolism,increased protein synthesis and decreased protein degradation.This result was consistent with previous studies,which indicated that N metabolism is related to Bt toxin protein level (Donget al.2000;Chenet al.2004,2005;Zhanget al.2007).It was reported that extreme humidity (RH90% and RH50%) could alter leaf insecticidal protein content,compared to RH70%,through its effect on N metabolism in cotton leaves (Chenet al.2012).A sharp reduction in Bt toxin level usually occurred under high temperature,and this decrease was a result of reduced N metabolism strength in Bt cotton (Chenet al.2012).Salinity stress could also influence the protein cycle,and thus decrease insecticidal protein content (Wanget al.2018).N fertilizer application increased Bt protein content(Yanget al.2005;Wanget al.2012),but N deficit reduced toxin content (Chenet al.2019),and the changes in Bt protein content due to N fertilizer dose have been attributed to altered N metabolism.Thus,seed Bt toxin protein content is related to the N metabolism process in cotton plants.
5.Conclusion
When plant density was increased,boll volume,boll weight and boll number per plant all decreased,but the seed Bt protein level increased.The analysis of N metabolism showed enhanced soluble protein amount and GPT and GOT activities,but reduced free amino acid content and protease and peptidase activities under high plant density.Our present study indicated that high plant density increased Bt protein content,and this increase was associated with decreased boll volume,boll weight and boll number per plant.In addition,altered N metabolism may also contribute to the increased Bt protein content under high plant density.In cotton production,hybrid cotton cultivars that have larger bolls are preferred for their higher yields.However,according to our present results,lower Bt protein content was observed in bigger bolls.Therefore,there is a conflict between high yield and high insect resistance,and it is important to balance these two requirements.
Acknowledgements
This study was supported by the National Natural Science Foundation of China (31901462 and 31671613),the National Key Research and Development Program of China(2018YFD0100406 and 2018YFD1000907),the Natural Science Foundation of the Jiangsu Higher Education Institutions,China (18KJB210013 and 17KJA210003),and the Natural Science Foundation of Jiangsu Province,China(BK20191439).
Declaration of competing interest
The authors declare that they have no conflict of interest.
杂志排行
Journal of Integrative Agriculture的其它文章
- Receptor-like kinase OsASLRK regulates methylglyoxal response and content in rice
- Heredity and gene mapping of a novel white stripe leaf mutant in wheat
- Construction of a high-density adzuki bean genetic map and evaluation of its utility based on a QTL analysis of seed size
- Effects of temperature and solar radiation on yield of good eatingquality rice in the lower reaches of the Huai River Basin,China
- Difference in corn kernel moisture content between pre-and postharvest
- The effect of elevating temperature on the growth and development of reproductive organs and yield of summer maize
