Influence of fracture width on borehole radar response
2021-05-26YANWeicunLIUSixinCHANGXinghaoRANLiminZHAOYonggangandLIJianwei
YAN Weicun, LIU Sixin*, CHANG Xinghao, RAN Limin,ZHAO Yonggang and LI Jianwei
1. College of Geo-Exploration Science and Technology, Jilin University, Changchun 130026, China;2. North China Petroleum Engineering Company, SINOPEC, Zhengzhou 457000, China
Abstract: Fracture is a common underground structure phenomenon, which can provide space and passage for the storage and migration of oil and gas. Borehole radar is a fast and high-resolution geophysical detection method, which has been widely used in engineering, exploration and other fields. This paper mainly uses theoretical analysis and numerical simulation to study the variation law of the characteristics of the received borehole radar signal with the variation of fracture width. The Ricker wavelet is used as the pulse signal of the borehole radar. The results show that the amplitude of the signal received by the borehole radar first increases, then decreases, and finally tends to be a stable value with the increase of fracture width. The results have guiding significance for the detection of underground fractures and the estimation of fracture width by borehole radar.
Keywords: borehole radar; fracture width; amplitude; numerical simulation
0 Introduction
Ground penetrating radar (GPR) is a fast, non-destructive, and high-resolution detection method, which has been widely used to detect anomalies in subsurface (Zengetal., 2010; Liu & Qian, 2015; Lietal., 2014). However, the detection depth of surface GPR is limited, so borehole radar becomes cru-cial, because it can closely approach targets (Slobetal., 2010; Liu, 2002).
In Europe, America, Japan and other regions, the research and development of borehole radar system has been carried out since the early 1970s (Lestarietal., 2010). German Rubinetal.(1978) performed pulse radar experiments by means of single-hole mea-surement and cross-hole measurement, respectively, and successfully identified underground rock formations(Olssonetal., 1992). Since the 1990s, Tohoku University developed full-polarimetric borehole radar (Miwaetal., 1999; Sato & Miwa, 2000). Wänstedtetal. (2000) used borehole radar data combined with other geophysical data to realize the three-dimensional visualization of underground pollutants such as underground nuclear waste. Domestic research on borehole radar started late, and most of the relevant articles are introductory (Chen & Chen, 2008; Kongetal., 2003; Zhaoetal., 2005). China University of Mining and Technology first introduced borehole radar instruments from abroad (Wangetal., 2005). Zhongetal. (2011) obtained the borehole radar response characteristics of point adverse geological bodies through numerical simulation.
In terms of fracture detection, GPR measurements were carried out on the vertical wall of a welded tuff rock quarry with the objective of studying the applicability of GPR to the mapping of the distribution and continuity of fractures inside the rock. By using GPR, reflected waves from fractures within the base rock were detected to a depth of about 4 m (Toshiokaetal., 1995). In 2005, Liuetal. (2005b) proved that it is feasible to detect fractures by borehole radar through physical experiments. Liuetal. (2005a) used GPR to determine the fractures in concrete structures, and checked and evaluated the distribution and depth of fractures through GPR. The investigation results show that GPR can detect the fractures of tunnel lining accurately and effectively. GPR is also effective in detecting fractures in the sloping clay core, and proves to pose less impact on the normal operation of the detected hydraulic projects, be more efficient, and capable of retrieving more comprehensive detection data, compared with the method of artificial observation through holes drilled from the ground (Xuetal., 2010). FDTD numerical modelling has been employed to help understanding a range of GPR vertical fracture responses observed in a variety of pavements (Nectaria & Divid, 2010). Liuetal. (2014) use sub-cell FDTD technique to synthesize borehole radar response to fractures from 0.000 5 m to 0.02 m wide, which are filled with water or air. It was found that water-filled vertical fracture is easier to be detected than air-filled fracture, and the fracture width affect the reflected signal very much. The wider the fracture, the stronger the reflected signals.
The above experts and scholars have made outstanding contributions to the practical application of domestic borehole radar and laid a solid foundation for the widespread application of borehole radar in China. However, the previous research mainly used ground penetrating radar to detect the existence of underground fractures, and roughly identify the location and direction of the fractures. And more research has been done on ground penetrating radar rather than borehole radar. On the basis of previous studies, this paper studies the response characteristics of the signal received by the borehole radar when the width of underground fractures changes by theoretical analysis and numerical simulation. This paper focuses on the analysis of the variation law of the amplitude of the signal received by the borehole radar with the variation of the fracture width.
1 Theoretical analysis
The time-domain borehole radar generally uses radar pulses similar to Ricker wavelet. The Ricker wavelet used in this paper is shown in Fig.1. Its domi-nant frequency is 500 MHz, and its maximum amplitude is 1. It is assumed that there is a vertical fracture near the borehole, with strike parallel to the borehole when using borehole radar for the detection (Fig. 2). Due to the influence of fractures, the borehole radar will receive two reflected signals because there are two interfaces between the fracture and the surrounding rock. It is assumed that the surrounding rock is limestone with relative permittivity of 8 and the conductivity of 0.000 02 S/m, and the fracture is filled with air (the relative permittivity is 1 and the conductivity is 0 S/m). According to plane wave theory, the reflection coefficient and transmission coefficient are defined as follows (assuming vertical polarization) (Zengetal., 2010):
(1)
(2)
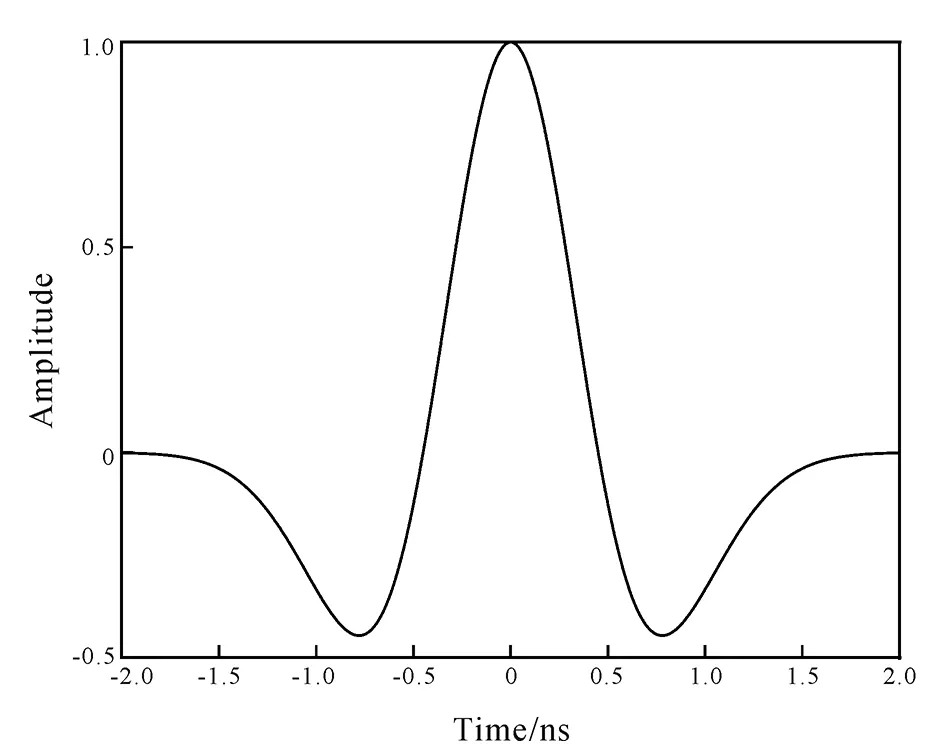
Fig.1 Waveform of Ricker wavelet
In the formula,Rrepresents the reflection coefficient,Trepresents the transmission coefficient,η1andη2represent the intrinsic impedance of the surrounding rock and the filling material in the fracture, respectively, and anglesθiandθtare the angles of incidence and transmission, respectively (the value is 0 for vertical incidence).
According to the above formula, we can calculate the two reflected signals received by the borehole radar (without considering the influence of medium dispersion and attenuation). With the change of fracture width, the distance between the two reflected signals received by radar system will also change, and the superimposed signals received by borehole radar will change accordingly. We constantly change the width of the fracture, and then observe the changes of two reflected signals and their superimposed signals received by borehole radar. Ten of them are extracted and shown as follows (Fig. 3).
In Fig. 3, the left figure shows two reflected signals corresponding to different fracture widths, and the right figure shows the superimposed signals received by borehole radar. In Fig. 3, the ordinate represents the amplitude, the abscissa represents the time, and λ represents the wavelength of the filling material in the fracture. It can be seen from Fig. 3 that the waveform and amplitude of signal received by borehole radar will change with the fracture width. The maximum amplitude corresponding to each width is extracted and plotted verse the fracture width (Fig. 4).
It can be seen from Fig. 4 that when the fracture width is less than 0.2 λ, the amplitude of signal received by borehole radar increases with the increase of fracture width. When the fracture width is approximately equal to 0.2 λ, the amplitude reaches the maximum value. When the fracture width is greater than 0.2 λ and less than 0.5 λ, the amplitude decreases with the increase of fracture width. When the fracture width exceeds 0.5 λ, the amplitude tends to be a stable value. Two reflected signals corresponding to the maximum amplitude in Fig. 4 are extracted and plotted in Fig. 5a. It can be seen from Fig. 5a that when the peak of reflected wave of the first interface of the fracture coincides with that of the second interface (the fracture width is about 0.2 λ at this time), the amplitude of the signal received by the borehole radar reaches the maximum value. When the fracture width is less than the critical value, the coherence enhancement of the two reflected waves always changes from weak to strong with the increase of the fracture width, while the amplitude of the reflected signal changes from small to large. When the fracture width is greater than the critical value, the coherence enhancement of the two reflected waves begins to change from strong to weak with the increase of the fracture width, while the amplitude of the reflected signal changes from large to small. We extract the two reflected signals corresponding to the amplitude approaching a stable value in Fig. 4 and plot them into a graph (Fig. 5b). It can be seen from Fig. 5b that when the reflected wave of the second interface of the fracture is about to separate from the peak of reflected wave of the first interface (at this time, the fracture width is about 0.5 λ), the amplitude of signal received by the borehole radar begins to tend to be a stable value. Even if we continue to increase the fracture width, the amplitude of signal received by borehole radar will not change. It can also be seen from Fig. 3e that when the fracture width reaches this value, two reflected signal waveforms from the signal received by the borehole radar can be distinguished, and two reflection interfaces can be distinguished from the borehole radar profile.
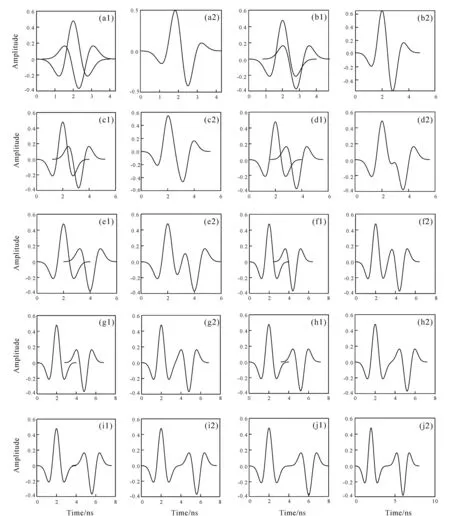
(a)-(j) Fracture width: 0.1, 0.2, 0.3...1 λ.Fig.3 Two reflected signals and superimposed signals received by borehole radar corresponding to different fracture widths
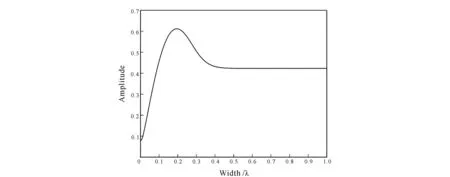
Fig.4 Relationship between amplitude of signal received by borehole radar and fracture width
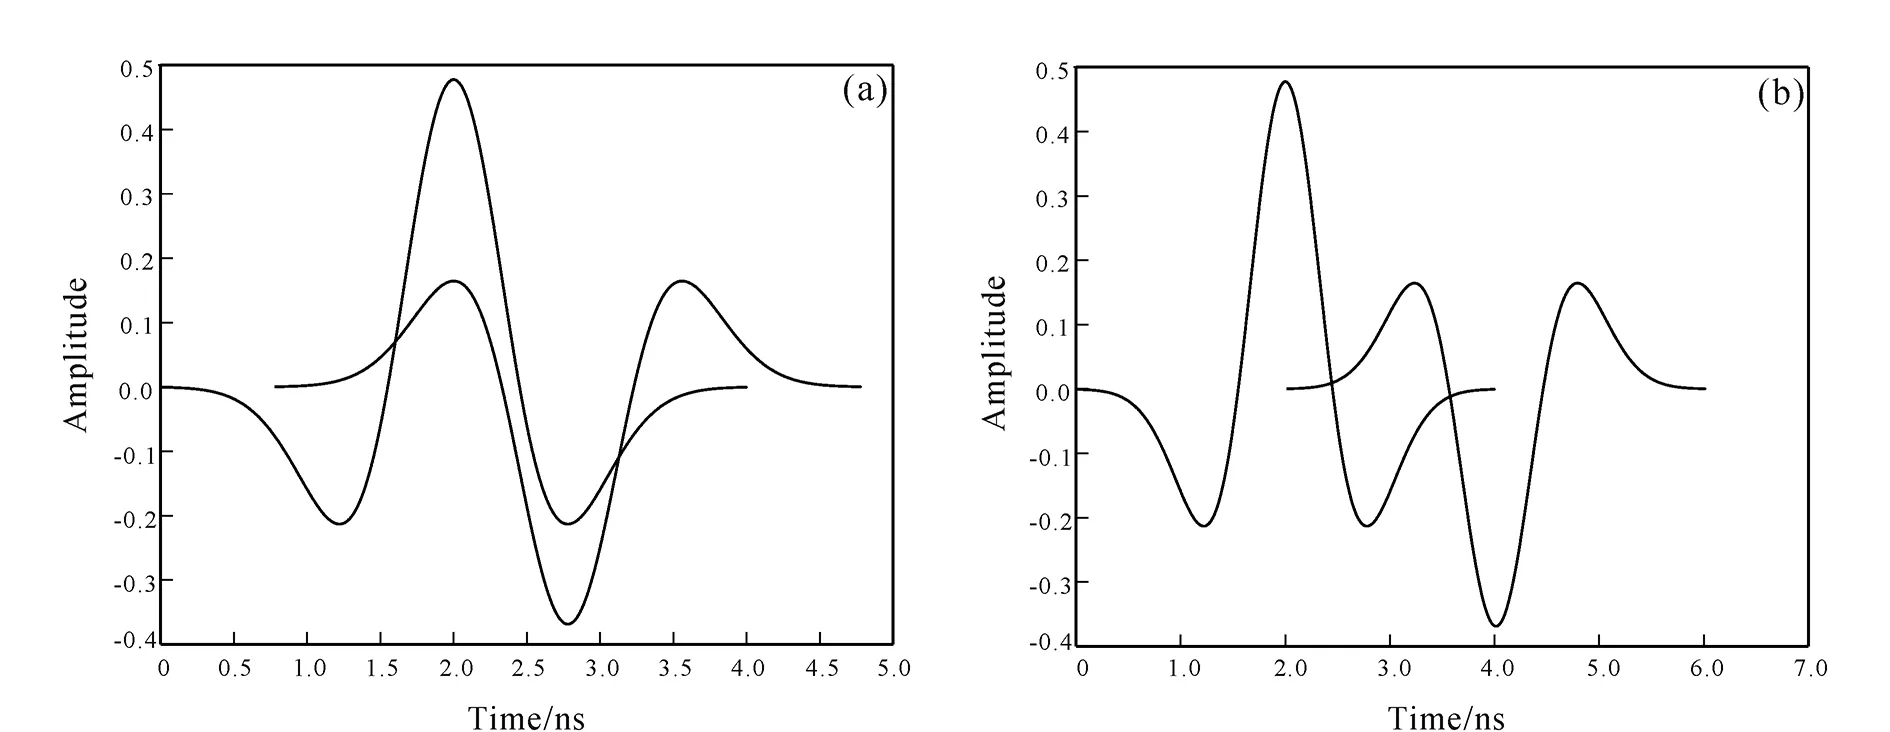
Fig.5 Two reflected signals corresponding to maximum amplitude point (a) and to amplitude stabilization point (b)
2 Forward Modeling
In this paper, GPRMAX 3.0 (Warrenetal., 2016) is used to carry out numerical simulations. A three-dimensional model is established for forward simulation (the vertical profile of the model is shown in Fig. 6). The length, width and depth of the model are 2.2 m, 0.1 m and 0.6 m, respectively (the length, width and depth of all models in this paper correspond to thex,yandzdirections of the model in the figure, respectively). The borehole is located atx=0.1 m,y=0.05 m. The distance between the fracture and the borehole is 1 m. The fracture widths are 0.003 m, 0.005 m, 0.01 m, 0.02 m, 0.05 m, 0.08 m, 0.09 m, 0.1 m, 0.11 m, 0.12 m, 0.15 m, 0.2 m, 0.3 m, 0.4 m, 0.5 m, 0.6 m, 0.8 m, 1 m, respectively. We assume that the surrounding rock is limestone (the relative permittivity is 8 and the conductivity is 0.000 02 S/m), and the fracture is filled with air (the relative permittivity is 1 and the conductivity is 0 S/m). The grid size is 0.001 m × 0.001 m × 0.001 m. The distance between the transmitting and receiving antennas is 0.5 m. The dominant frequency of the antenna is 500 MHz, and a Ricker wavelet is used.
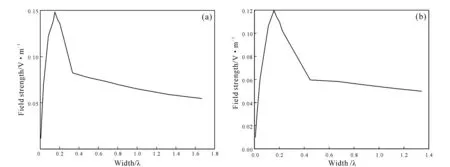
After the simulation is completed, single trace data are extracted from the simulation results and drawn into a graph (Fig. 7), where the first obvious signal is the direct wave signal, but what we need is the second effective signal (take the fracture width of 0.2 m as an example). We can extract the amplitude of the reflected wave of borehole radar, and then plot the amplitude verse the fracture width (Fig. 8a). The unit of abscissa in the figure has been converted to the wavelength of the filling material in the fracture (at this time, the filling material is air). It can be seen from Fig. 8a that when the fracture width is less than 0.15 λ, the amplitude of reflected signal received by borehole radar increases with the increase of fracture width. When the fracture width is approximately equal to 0.15 λ, the amplitude reaches the maximum value. When the fracture width exceeds 0.15 λ, the amplitude decreases gradually with the increase of fracture width and then tends to be a stable value. The simulation results are basically consistent with the theoretical analysis results Now the filling in the fracture is changed to oil (the relative permittivity is 1.8 and the conductivity is 0.000 001 S/m). The fracture widths are 0.003 m, 0.005 m, 0.01 m, 0.02 m, 0.05 m, 0.07 m, 0.08 m, 0.09 m, 0.1 m, 0.2 m, 0.3 m, 0.4 m, 0.5 m, 0.6 m, respectively, with other simulation parameters remain unchanged, and we re-run the simulation experiment and plot the figure according to the above steps. Then we can get the simulation result as shown in Fig. 8b. The unit of abscissa in the figure has been converted to the wavelength of the filling material in the fracture, i.e., oil. It can be seen from Fig. 8b that the simulation results are basically consistent with those when the fractures are filled with air. This further verified the accuracy of the simulation experiment.

Fig.6 Vertical profile of numerical simulation model
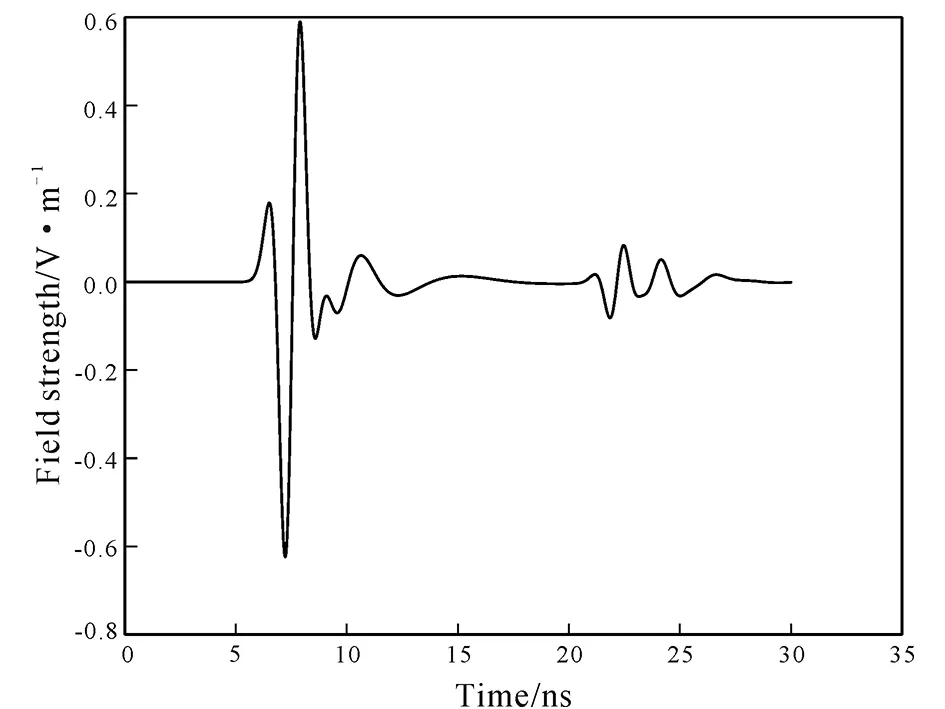
Fig.7 Single trace data of numerical simulation results (Fracture width is 0.2 m)
The filling material in the fracture: (a) air; (b)oil.Fig.8 Relationship between amplitude of signal received by borehole radar and fracture width
When we use borehole radar for detection, the emitted electromagnetic wave will be dispersive and attenuated when entering into the stratum. And this may be the reason why the position of the maximum amplitude in the simulation experiment result is slightly different from the theoretical analysis result. Another simulation experiment is undertaken to pick up the waveform signal at the interface between the fracture and surrounding rock. The results are shown in Fig. 9.
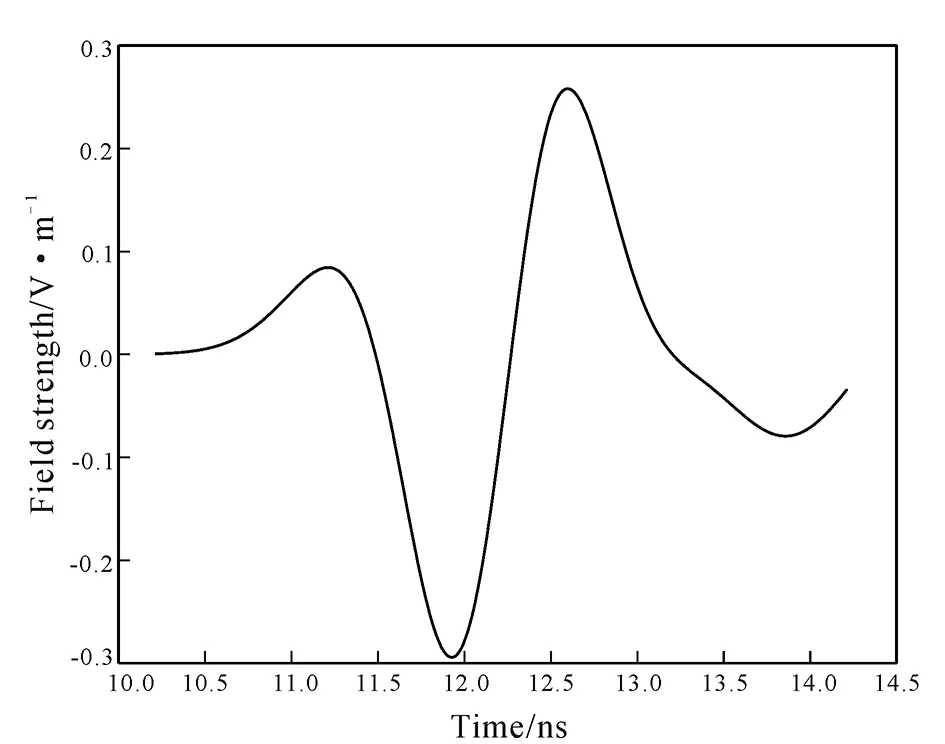
Fig.9 Waveform signal at interface between fracture and surrounding rock
It can be seen from Fig. 9 that some changes have taken place in the waveform of Ricker wavelet due to the influence of dispersion and attenuation. Using this waveform to perform experiments according to the steps of theoretical analysis, we can then get the results as shown in Fig. 10. It can be seen from the figure that the general trend of the curve is consistent with the results of theoretical analysis and numerical simulation, and the fracture width corresponding to the maximum amplitude is closer to the result of numerical simulation, which also proves the correctness of the above speculation. The reason for the difference between the two curves is that dispersion and attenuation occur when the electromagnetic wave passes through the fracture.
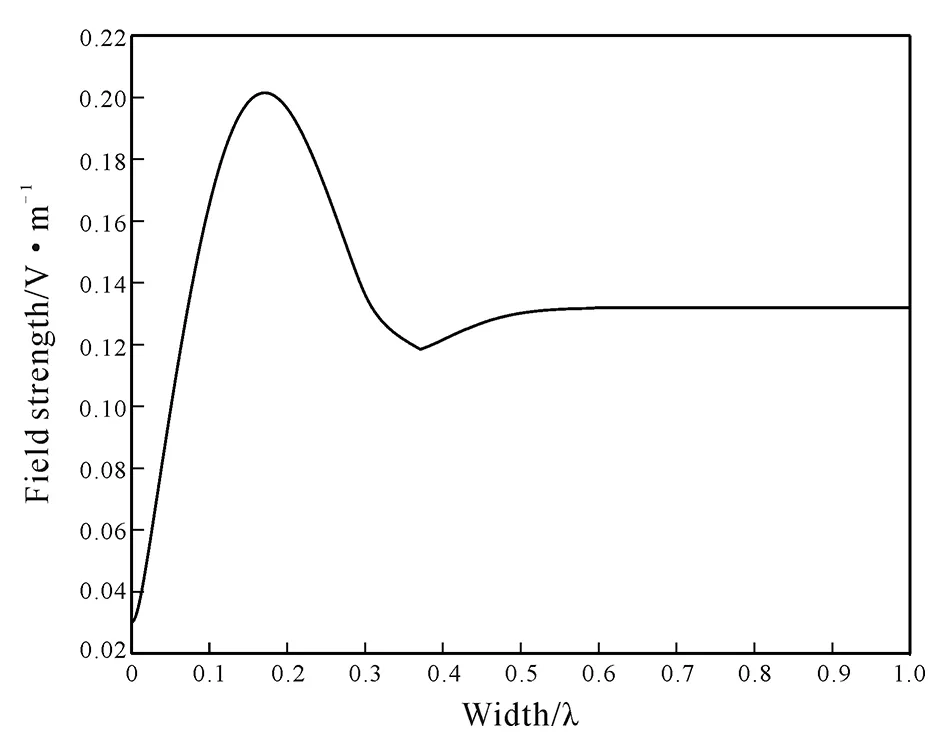
Fig.10 Relationship between amplitude of signal received by borehole radar and fracture width (analog waveform)
3 Conclusions
In this paper, we first discuss the relationship between the amplitude of signal received by borehole radar and the width of fractures by theoretical analysis. The results show that the amplitude of the signal received by borehole radar first increases, then decreases, and finally tends to be a stable value with the increase of fracture width. Subsequently numerical simulation is used to verify the analysis results. The trend of the curve obtained from the simulation results is completely consistent with that of the theoretical analysis. Due to the dispersion and attenuation of electromagnetic wave in the formation, the peak position of the curve has a little deviation, but this does not affect the trend distribution of the result curve. The research results have guiding significance for the detection of underground fractures and the estimation of fracture width by borehole radar. However, the complexity of the actual underground medium was not considered during the experiments in this article. Only a single homogeneous medium was tested, and the effect of borehole environment was not considered. Therefore, the experimental results are from ideal situation and further research is needed.
杂志排行
Global Geology的其它文章
- Chemical indexes of Paleoproterozoic sedimentary rocks from Liaohe Group, North China Craton: Implications for paleoclimate and provenance
- Origin of ore-forming fluids in Qinggouzi stibnite deposit,NE China: Constraints from fluid inclusions and H-O-S isotopes
- Geochemical characteristics and sedimentary environment significance of carbonate rocks in Nanfen Formation of Qingbaikou System in Tonghua, Jilin Province
- Evolution characteristics of hydrological connectivity pattern of marsh wetland in Naoli River Basin
- Common offset ground penetrating radar data inversion based on ray theory
- Application of Gaussian beam pre-stack depth migration in rugged seabed
