Origin of ore-forming fluids in Qinggouzi stibnite deposit,NE China: Constraints from fluid inclusions and H-O-S isotopes
2021-05-26BAKHTShahzadSUNFengyueWANGLinlinXUChenghanYELinaZHUXinranandFANXingzhu
BAKHT Shahzad, SUN Fengyue, WANG Linlin, XU Chenghan, YE Lina,ZHU Xinran and FAN Xingzhu
College of Earth Sciences, Jilin University, Changchun 130061, China
Abstract: The Qinggouzi stibnite deposit is located in Huashan Town, Jilin Province, in the northeastern margin of North China Craton (NCC). It is controlled by fault structures, hosted within structurally controlled felsic dykes, predominantly surrounded by phyllite, schist and quartzite. This study presents the results of fluid inclusions studies, intending to determine the source of the fluid responsible for ore-formation, hence exploring its metallogenesis. The aqueous biphase inclusions are identified in the stibnite-bearing quartz veins of the deposit. Moreover, aqueous biphase inclusions are further classified into ① biphase liquid-rich inclusions (1a) and ② biphase gas-rich inclusions (1b) depending upon liquid to gas ratio trapped within the fluid inclusions. Homogenization temperatures for (1a) and (1b) range between 114.8℃ to 422℃ and 128.3℃ to 267.5℃, respectively. 1a and 1b have salinities of 0.18% to 16.14% NaCleqv and 1.22% to 12.88% NaCleqv, and density range from 0.43 to 1.02 g/cm3 and 0.81 to 0.98 g/cm3, respectively. Sulfur isotopic analysis indicates δ34SV-CDT from 4.4×10⁻³ to 6.5×10⁻³, with an average of 5.2×10⁻³, whereas H isotopes values on δDV-SMOW standard are -100.8×10⁻³ and -107.5×10⁻³, while O isotopes data on δ18OV-SMOW standard range between 20.1×10⁻³ and 20.4×10⁻³. Fluid inclusions study, combining with sulfur and H-O isotopic data reveal that the ore-forming fluids originated from deep source and were subsequently contaminated by meteoric water. Hydrostatic pressure calculation shows that the minimum and maximum pressures are 11.65 and 42.33 MPa, and relevant depths of deposit are estimated to be 1.16 and 4.23 km. Finally, we inferred that Qinggouzi stibnite deposit is a medium-low temperature, low salinity hydrothermal deposit, which is formed by deep source and later contaminated by meteoric water, and is classified as epizonal deposit in terms of orogenic series.
Keywords: fluid inclusions; S isotopes; H-O isotopes; metallogenesis; Qinggouzi stibnite deposit; orogenic deposits
0 Introduction
The stibnite mineral is one of the major mineral resources in China, which mainly occurs in the central Hunan Province, south of China, but rare in the north. The Qinggouzi stibnite deposit belongs to Qinggouzi Village, Huashan Town, 7.5 km away from the Northwest of Linjiang County. The Qinggouzi stibnite deposit was discovered in the late 1960s and has reached medium-sized prospective reserve of 30k to 50k tons (Fengetal., 1993; Lietal., 2017). The research level of stibnite deposits in Jilin Province is relatively low, however, there have been some studies on the deposits in the past, with very little research work on the Qinggouzi stibnite deposit. Thus, the composition and origin of the hydrothermal fluids responsible for stibnite mineralization in Qinggouzi are poorly understood. The fluid inclusions captured in hydrothermal minerals are the most direct indications of the mineralization process of hydrothermal deposits (Geetal., 2011; Roedder, 1984). In this article, we performed fluid inclusions study on the Qinggouzi stibnite deposit to determine its mineralization conditions, and isotopic studies are conducted to determine a possible source of fluid and material responsible for the ore-forming process.
1 Regional geological background
1.1 Geotectonics and regional geology
The Qinggouzi stibnite deposit is located in southeastern Jilin Province at the northeastern margin of North China Block (NCB), also known as North China Craton (NCC) in the Jiao-Liao-Ji belt (Keeviletal., 2019), the southeast side of Longgang block, in the east of Tanlu fault and the west of Yalu River fault. During the geological period, the study area experienced complex geological processes and strong tectonic activities. In the Late Archean period, the crust experienced strong tectonic activities, followed by submarine volcanic eruptions, basic magma intrusions, and regional metamorphism (Duetal., 2015; Liuetal., 2019; Quetal., 2018). Later on, in the Late Jurassic, northeastern China has entered a period of a tectonic movement dominated by rifting, and its stress field has fundamentally changed compared with the Early Mesozoic (Lietal., 1987; Mengetal., 2006).
The Qinggouzi stibnite deposit is mainly exposed in Paleoproterozoic Laoling Group, i.e., Linjiang Formation (Pt1l), Dalizi Formation (Pt1dl), surrounded by Neoproterozoic Baifangzi Formation (Pt3b), Triassic Changbai Formation (T3c), and Jurassic Guosong Formation (J2-3g). The Caoshan mass unit (CS) and Laotuding subunit are distributed in the west of the study area (Fig. 1). Among them, the Linjiang formation is exposed in the core of Qinggouzi anticline. It is a set of marine argillaceous debris with re-latively weak metamorphism, and belongs to greenschist facies (Wangetal., 2013). The lithology of the lower part comprises mica schist interbedded with thin layers of quartzite, sericite schist and quartz-sericite schist. The lithology of upper part comprises medium-thick layer of quartzite (marker layer) interbedded with sericite schist, and biotite-sericite schist interbedded with thin layers of quartzite (Lietal., 2017). The Sb content is very high, and it is the primary mineral source and ore-bearing horizon of stibnite ore mineralization. It has conformable contact with the overlying Dalizi Formation (Pt1dl). Whereas, Dalizi Formation (Pt1dl) is distributed on the two limbs of Qinggouzi anticline. It is a set of marine argillaceous clastics and carbonates. The metamorphism is relatively weak, belonging to low greenschist facies. The Dalizi Formation (Pt1dl) is not entirely exposed in the area, but only two lithological sections are exposed. The first section is composed of mica schist, sericite schist, and biotite-sericite schist and the second section comprises mica schist, sericite schist, phyllite and mica schist interbedded with marble.
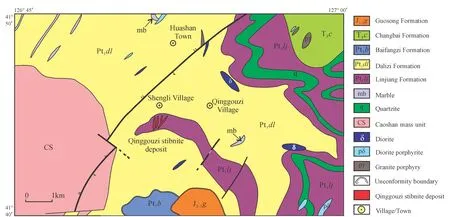
Fig.1 Geological map of Qinggouzi stibnite deposit (Modified after Li et al., 2017)
1.2 Deposit geology
The Qinggouzi stibnite deposit occurs along metamorphic brittle-ductile shear zone, mainly controlled by “fan-shaped” fault structures in the core of Qinggouzi inverted anticline (Fengetal., 1993). These fracture zones are hosting quartz veins, containing stibnite. The phyllite, sericite schist, and quartzite are the major surrounding rocks of the ore body. The continuity of the ore body in the vein belt is poor, pinch-out and the stacking of the ore in lenticular or irregular shapes are common. Six main ore veins and ten industrial ore bodies are identified in the study area (Fengetal., 1993). According to field data and thin section petrography, it is found that the Qinggouzi stibnite deposit has undergone multi-stage mineralization, but its mineral composition is moderately simple. The stibnite mineralization is associated with intense chloritization, silicification, sericitization, carbonatization, pyritization, arsenopyrite mineralization and sulphide-rich alteration zones. Stibnite, pyrite and arsenopyrite are dominant ore minerals hosted in quartz veins. Gangue minerals such as quartz, sericite, chlorite, biotite and calcite also exist (Fig. 2).
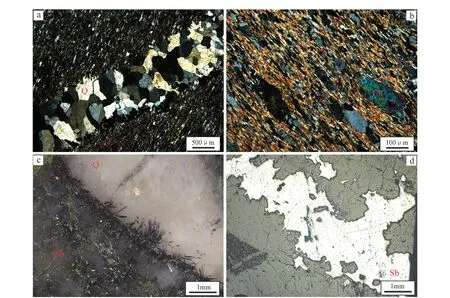
Captured in transmitted and reflected light. (a) Euhedral quartz crystal present in a quartz vein with calcite appearing at the edges of quartz crystal; (b) sericite and chlorite major minerals found in phyllite; (c) needle-like stibnite aggregates to form radial texture; (d) chemical alteration at the edge of the stibnite crystal due to metasomatism forming residual metasomatic texture. Abbreviation: Q=quartz, C=calcite, S=sericite, Ch=chlorite and Sb=stibnite.Fig.2 Photomicrographs of mineral assemblages and mineral texture of Qinggouzi stibnite deposit
2 Analytical methods
2.1 Microthermometry
For fluid inclusions studies, eighteen samples were collected from ore-bearing quartz veins from different locations within Qinggouzi stibnite deposit. Before performing fluid inclusions petrography, all the prepared samples were soaked in ethanol for 48 hours, then rinsed with clean water and dried thoroughly. Fluid inclusions petrography was performed with careful observations of shapes, the spatial distribution of fluid inclusions within the thin sections and vapor-liquid ratios. Due to a lack of larger inclusions (>3), eight samples were chosen for microthermometry.
Microthermometric measurements of the fluid inclusions were carried out using a Linkam THMSG 600 heating-freezing stage (-196℃ to 600℃) at the Geological Fluid Laboratory, College of Earth Sciences, Jilin University. Freezing and heating temperatures were measured using the same inclusion where possible, and phase transitions were observed carefully. During the temperature measurement process, temperatures were changed in steps of 5℃/min to 10℃/min and then changed slowly at steps of 0.1℃/min to 1℃/min when approaching the phase transition temperature. The salinity of the aqueous solution is calculated by an empirical formula of Halletal. (1988), and the density is calculated by empirical formula (Bodnar, 1983).
2.2 Sulfur isotope analytical method
To determine ore-forming source of the Qinggouzi stibnite deposit, three samples were collected and sent to Testing Center of Beijing Geological Research Institute of Nuclear Industry. The mass spectrometer Delta V Plus was used to analyze ore samples, where stibnite was used to determine possible material source for ore formation. The acquired data are relative to the international standard VCDT.
2.3 H-O isotope analytical method
The H-O isotope analysis was performed to determine possible source of fluid responsible for ore formation, two samples were collected and sent to Testing Center of the Beijing Geological Research Institute of Nuclear Industry. The MAT-253 model of mass spectrometer was used to analyze the hydrogen isotopes and values are obtain according to international standard VSMOW.
For oxygen isotopes, mass spectrometer Delta V advantage was used to analyze samples, results are relative to VSMOWstandard. The data of both H-O isotopes are mentioned in Table 2.
3 Results
3.1 Fluid inclusion assemblages and characteristics
Observations under a microscope indicate that the fluid inclusions were widely distributed in quartz. The petrography of the fluid inclusions was conducted by the following rules: the randomly distributed and isolated fluid inclusions hosted in quartz crystals were interpreted as primary origin, and those aligned along micro-fractures in the transgranular trails were interpreted as secondary fluid inclusions (Luetal., 2004; Roedder, 1984; Shaoetal., 2019).
According to Goldstein & Reynolds (1994), the single-fluid assemblage is a group of petrographically associated inclusions and evidently discriminated. Relating this explanation to the primary and pseudosecondary fluid inclusions observed in internal trails and clusters within stibnite-bearing quartz or calcite veins, the aqueous biphase (L-V) fluid inclusions are identified. In terms of volumetric proportions of the phases present in the fluid inclusions at room temperate, inclusions recognized in the Qinggouzi stibnite deposit are either biphase liquid-rich inclusions (1a) or biphase gas-rich inclusions (1b). Both 1a and 1b existed in all stages, while 1a were predominant by more than 90%.
1a inclusions were randomly distributed or found in a cluster within a quartz crystal and occurred mostly in an ellipsoidal and irregular shape with clear rounded vapour inside them (Fig. 3). This type of fluid inclusions consists of a vapour bubble and a liquid phase, while liquid dominated between the fluid inclusions is with a high degree of fill, i.e. (Vl/ (Vl+Vg)>0.6). These inclusions ranged approximately 4 to 20 μm in size, and are homogenized to the aqueous phase.
Whereas, 1b inclusions homogenized to the aqueous phase and were randomly distributed or found in the form of a cluster within a quartz crystal and occurred in an ellipsoidal and irregular shape with clear rounded vapour present inside them. These fluid inclusions were smaller and approximately ranged from 4 to 8 μm in size. 1b inclusions are dominated by vapour, with a low degree of fill, i.e. (Vl/ (Vl+Vg) <0.5).
3.1.1 Microthermometric data of fluid inclusions
Microthermometry was conducted at primary inclusions, and the statistics of fluid inclusions are summarized in Table 1.
To conduct microthermometry on the Qinggouzi stibnite deposit, different phases were observed through freezing (first) and heating. Phase transitions were observed. All these inclusions show initial ice melting temperatures of <-23, which are approximated eutectic melting temperatures for the system NaCl-H2O and NaCl-H2O (Hagemann & Lüders, 2003; Halletal., 1988; Sterneretal., 1988). Based on studies, final ice melting temperatures for 1a range from -12.1℃ to -0.1℃ with an average of -3.9℃. For 1a, total homogenization temperatures into the aqueous phase range from 114.8℃ to 422℃ (Fig. 4) and was mainly concentrated at 175℃ to 238℃. 1b show final melting at -9℃ to -0.7℃ with an average of -5.4℃. For 1b, total homogenization into aqueous phase range between 128.3℃ to 267.5℃ (Fig. 4), with an average of 214.7℃. Two inclusions of (1a) and (1b) display final ice melting temperatures of -9℃ to -5.3℃, respectively, with total homogenization temperatures >520℃.
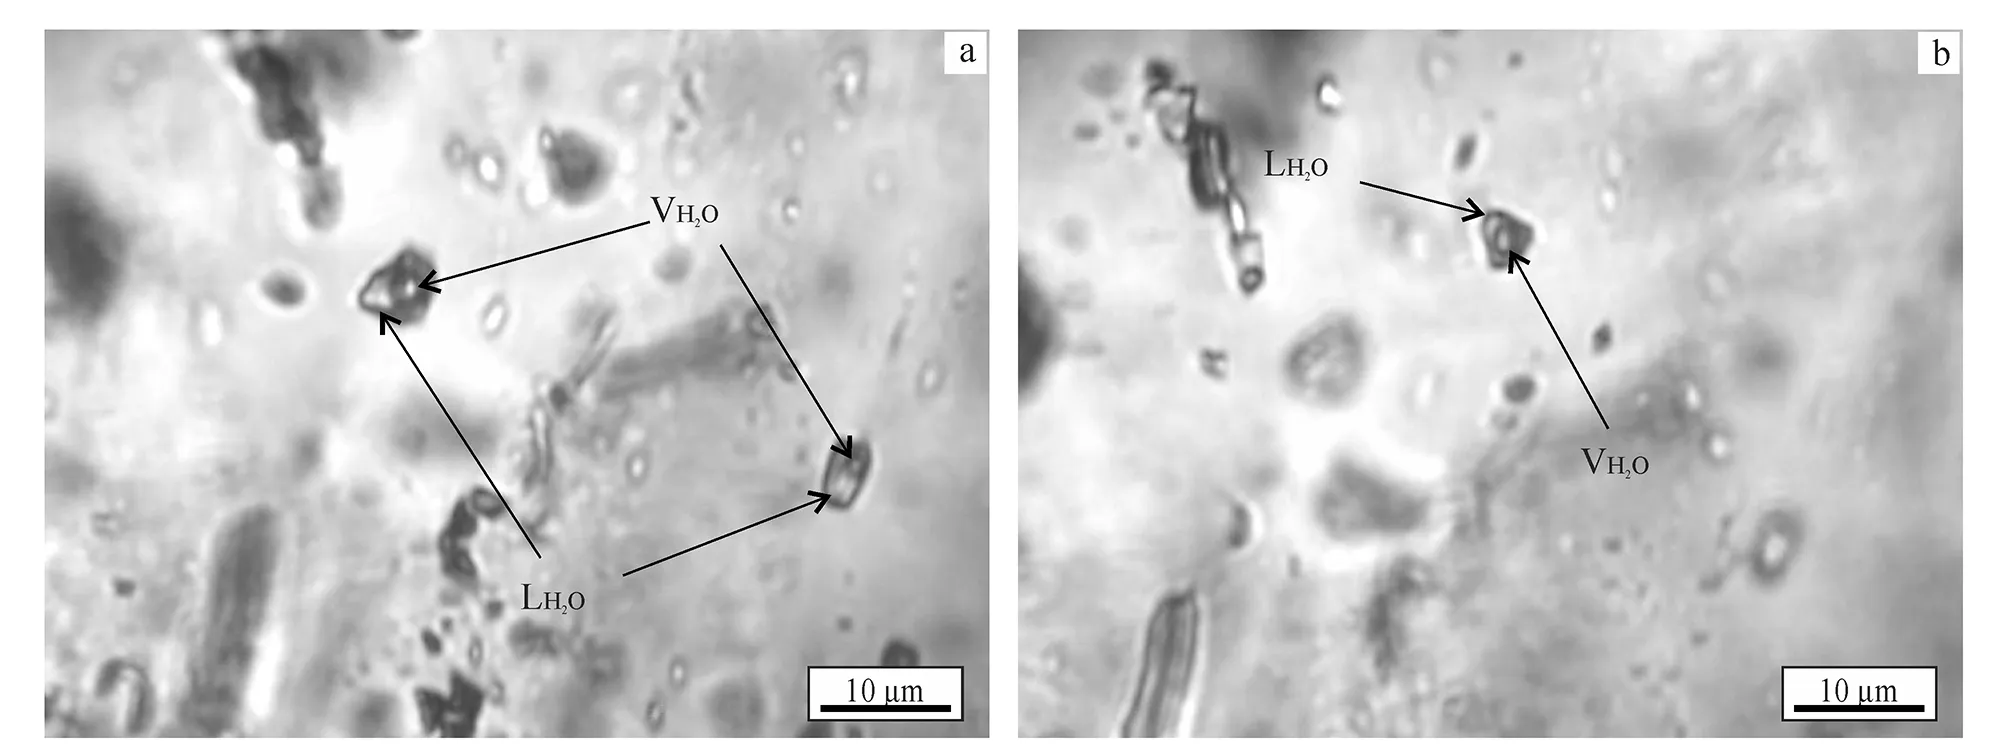
Abbreviation: LH2O=liquid H2O and VH2O=Vapour H2O.Fig.3 Photomicrographs of representative fluid inclusions in Qinggouzi stibnite deposit

Table 1 Microthermometric data of fluid inclusions in different samples of Qinggouzi stibnite deposit
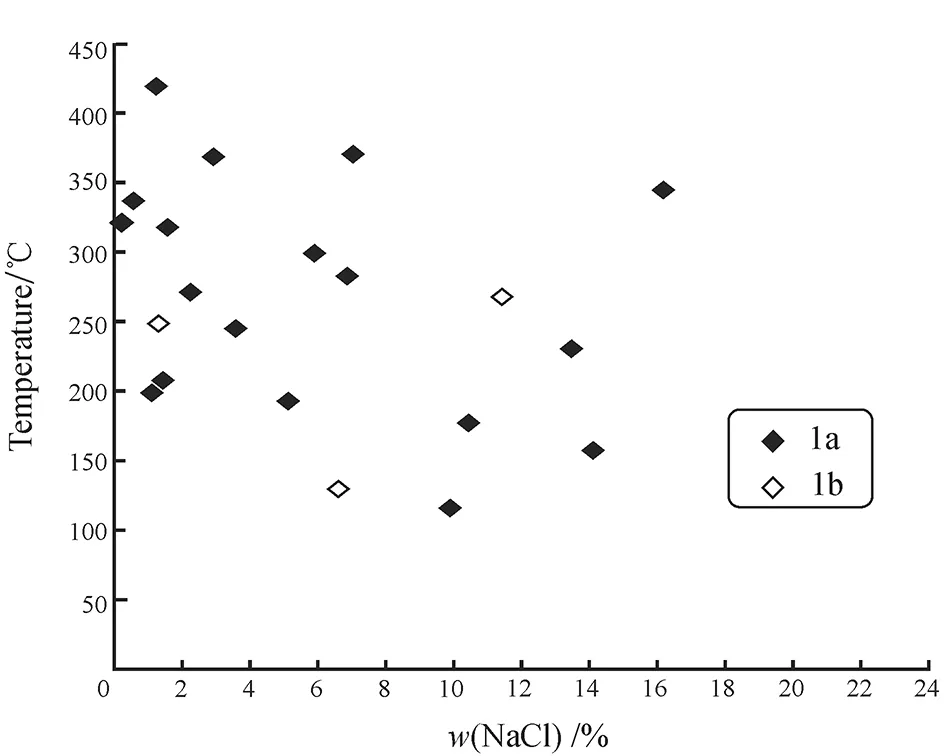
Fig.4 Salinity vs homogenization temperature of fluid inclusions in Qinggouzi stibnite deposit
3.1.2 Quantitative estimation of fluid composition and density
Salinity (eq.w(NaCl)/%) and density (g/cm3) of both types (1a and 1b) of inclusions were calculated using an empirical formula of Halletal. (1988) and Bodnar (1983), respectively.
Note that eutecticum in aqueous biphase inclusions were not observed; thus, the final ice melting temperature was used to determine the salt system. For 1a, Salinity range from 0.18% to 16.14% (Fig. 4), the density is 0.43 to 1.02 g/cm3(Fig. 5). For 1b, Salinity range from 1.22% to 12.88% (Fig. 4), the density range from 0.81 to 0.98 g/cm3(Fig. 5).
3.2 Isotope geochemistry
3.2.1 Sulfur isotope
The results of the S isotope are obtained from three stibnite samples (B-16-S, B-18-S, B-22-S) in Qinggouzi stibnite deposit. The measurements of sulfur are made relative to the VCDT standard. The δ34S values are 4.4×10⁻³, 4.7×10⁻³and 6.5×10⁻³, respectively, with an average of 5.2×10⁻³.
3.2.2 H-O isotopes
The H-O isotopic data are listed in Table 2. Based on acquired data, δDV-SMOWvalues are -100.8×10⁻³and -107.5×10⁻³, whereas δ18OV-SMOWvalues are 20.1×10⁻³and 20.4×10⁻³, and the calculated δ18OV-H2Ovalues are 11.7×10⁻³and 12×10-3(Fig. 6).
In the Qinggouzi stibnite deposit, the δ18OV-H2Ovalues are calculated using the fractionation equation (Claytonetal., 1972): 1000lnα=3.38×10⁶/T2-3.4, where “α” is the fractionation factor and “T” is the homogenization temperature of fluid inclusions.

Table 2 δDV-SMOW, δ18OV-SMOW and δ18OV-H2O values of quartz in Qinggouzi stibnite deposit
4 Discussion
4.1 Characteristics of ore-forming fluids and material
4.1.1 Source of fluids
The ore-forming fluids have the characteristics of medium-low temperature (114℃ to 422℃) and low salinity, averaging 6.24% NaCleqvwith only biphase liquid-rich and gas-rich inclusions. According to (Taylor, 1980), oxygen and hydrogen isotopic compositions of quartz in hydrothermal deposits are better representatives to determine the source of the ore-forming fluids. Thus, the hydrogen-oxygen isotope of the Qinggouzi stibnite deposit was tested, and the results are shown in Table 2. In Fig. 6, δDV-SMOWand δ18OV-H2Odiagram using data from Fengetal. (1993) is plotted along with our current results in order to better understand the origin of fluids. From the calculated hydrogen and oxygen isotope composition of fluids in quartz in the Qinggouzi stibnite deposit, it is concluded that the ore-forming fluids at Qinggouzi mainly derived from deep magmatic-hydrothermal fluids, which are probably contaminated by the meteoric water (Lietal., 2017).
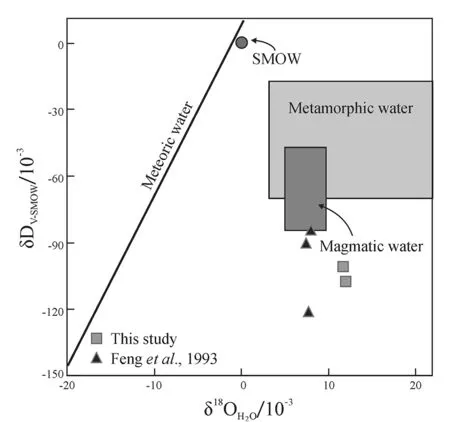
Fig.6 δDV-SMOW and δ18OV-H2O diagram for a possible fluid source of Qinggouzi stibnite deposit (from Sheppard, 1986)
Oxygen isotopes from the Qinggouzi stibnite deposit range from δ18OV-SMOW20.1×10-3to 20.4×10⁻³, and oxygen isotope compositions greater than 8×10⁻³are interpreted as the result of near-surface processes such as diagenesis or low-temperature hydrothermal alteration (Taylor, 1980), which means the composition of fluid may not be exclusively magmatic (McCuaig & Kerrich, 1998).
4.1.2 Source of sulfur
According to Lietal. (2017), the Qinggouzi stibnite deposit shows a small variation in sulfur isotopic characteristics, δ34S range from 2.1×10⁻³to 5.1 ×10⁻³with an average of 3.0 ×10⁻³. In this study, our data of δ34SV-CDTrange between 4.4×10⁻³to 6.5×10⁻³, with an average of 5.2×10⁻³. It is inferred that sulfur in the ore deposit is mainly derived from the magmatic-hydrothermal fluid. Besides, by the movement of hydrothermal fluids and chemical alteration, some part of the formation sulfur is added to the ore-forming fluids.
The data from sulfur isotope and H-O isotopes indicate that the primary ore-formation fluids may have derived from the deep source fluids. Based on the fluid inclusions investigation and combining with previous data, it is suggested that the primary ore-bearing fluids were most likely derived from the deep source fluids, and a small amount of metamorphic fluids and meteoric water may be an additional component in the ore-forming processes.
4.2 Mineralization depth
The homogenization temperature of fluid inclusions is essential to predict the depth of the mineralization, as the homogenization temperature within trapped fluid inclusions is equal to the temperature at which the mineral was formed (Roedder & Bodnar, 1980). In this study, the measured homogenization temperature is used to calculate pressure values, which are between 11.65 and 42.33 MPa (Table 1). Thus, the depth of formation is inferred by the geothermal gradient, and assuming a pressure gradient, the hydrostatic pressure gradient of 0.01 MPa/m is used to estimate the mineralization depth, and minimum and maximum depths are estimated at about 1.16 and 4.23 km, respectively.
Based on geological characteristics, microthermometry, and the isotopic analysis, the Qinggouzi stibnite deposits exhibit general features in common with other orogenic gold deposits globally, such as Kalgoorlie gold field, Yilgarn Block, Western Australia (Grovesetal., 2018), and the Superior Province of Canada (Goldfarbetal., 2005; 2001; Grovesetal., 2003; 1998; Hagemann, 2000; Robertetal., 2005). Both deposits are: ① related to orogeny; ② controlled by structures; ③ hosted in a variety of rocks including volcanic, sedimentary, and metasedimentary rocks; ④ associated with hydrothermal alteration, with pyrite and arsenopyrite etc.
5 Conclusions
(1) The Qinggouzi stibnite deposit is related to the shear zone and hosted within a meta-sedimentary succession of greenschist facies.
(2) The microthermometry of the fluid inclusions combined with isotopic data indicate that the ore-forming fluids have the characteristics of medium-low temperature and low salinity.
(3) The main components of the ore-forming fluids were probably derived from a deep source, and small amount metamorphic fluid and meteoric water may be involved in the ore-forming processes.
(4) Overall, the deposit is a medium-low temperature hydrothermal mineral deposit, and based on its mineralization depth, considered as an epizonal deposit in terms of orogenic deposit series.
杂志排行
Global Geology的其它文章
- Chemical indexes of Paleoproterozoic sedimentary rocks from Liaohe Group, North China Craton: Implications for paleoclimate and provenance
- Geochemical characteristics and sedimentary environment significance of carbonate rocks in Nanfen Formation of Qingbaikou System in Tonghua, Jilin Province
- Evolution characteristics of hydrological connectivity pattern of marsh wetland in Naoli River Basin
- Common offset ground penetrating radar data inversion based on ray theory
- Influence of fracture width on borehole radar response
- Application of Gaussian beam pre-stack depth migration in rugged seabed
