Evolution characteristics of hydrological connectivity pattern of marsh wetland in Naoli River Basin
2021-05-26WANGHaonanHOUGuangleiYANGChangbaoandSONGXiaolin
WANG Haonan, HOU Guanglei, YANG Changbao and SONG Xiaolin
1. College of Geo-Exploration Science and Technology, Jilin University, Changchun 130026, China;2. Northeast Institute of Geography and Agricultural Ecology, Chinese Academy of Sciences, Changchun 130102, China
Abstract: As an important indicator of the structural and functional stability of wetland landscapes, hydrological connectivity plays an important role in maintaining the stability of wetland ecosystems. Large-scale human activities have led to significant changes in the hydrological connectivity pattern of wetlands in Naoli River Basin since 1950s. Combined with the availability of wetland habitat and the spreading capacity of aquatic birds, hydrological connectivity indices of marsh wetlands were calculated in the studied area, and the temporal and spatial changes were analyzed from 1950s to 2015. The results indicate that: (1) the hydrological connectivity index of the marsh wetlands shows a growth trend with increasing distance threshold. All patches of marsh wetlands linked together when the distance threshold reached 35-40 km; (2) the optimal distance of hydrological connectivity is about 10 km for marsh wetlands of whole Naoli River Basin; (3) the total hydrological connectivity of marsh wetlands decreased in the Naoli River Basin from 1950s to 2015. Although the hydrological connectivity index increased after 2005, the fragmentation of the landscape has not been improved. The analysis of the wetland hydrological connectivity can provide a scientific basis for the ecological restoration and protection of the wetland in the Naoli River Basin.
Keywords: Naoli River Basin; hydrological connectivity; pattern evolution; distance threshold
0 Introduction
For the wetland ecosystem, hydrological connectivity is the basic conditions for the realization of the wetland ecosystem service function, and is also an important factor for maintaining the stability of the wetland ecosystem which affects the evolution of the wetland ecosystem structure (Cuietal., 2016; Zhangetal., 2019). Hydrological connectivity is an important driving factor for wetland ecological processes, and also the spatial allocation of material and energy in wetland ecosystem, thus affects the change of wetland hydrological process. With the intensification of human activities, the fragmentation and islanding of wetland landscape have become increasingly serious, which has changed the hydrological connectivity between and within wetland patches, blocked the material and energy cycles of wetland ecosystems, and thus affected the biodiversity of wetland ecosystems(Zhangetal., 2018; Liuetal., 2010; Zhuetal., 2008). Therefore, it is of great significance to undertake research on the changes in the hydrological connectivity of wetland ecosystems for maintaining the stability and sustainability of wetland ecosystem functions.
At present, researches on hydrological connecti-vity are mainly carried out from hydrology, aquatic ecology and landscape ecology and other disciplines, and some related indicators such as functional connectivity index (Dengetal., 2018), directional connectivity index (Larsenetal., 2012), area connectivity index(Leibowitzetal., 2018), as well as the tree connectivity indices(Coteetal., 2009) are proposed. These indices are used for the evaluation of rivers, wetlands, and urban pipeline networks, but most of these indices are for single time assessment of landscape connectivity, or lack of uniformity evaluation system, resulting in different evaluation results for the same ecosystem. Some scholars considered hydrological connectivity from the spatial dimension, and defined as vertical connectivity, horizontal connectivity, vertical connectivity and periodic changes in the time dimension (Cuietal., 2016; Wardetal., 1989; Zhao, 2008) ,with the aim to explore the impact of connectivity on wetland ecosystem function. The spatial-temporal allocation of water resources in wetland ecosystem was evaluated by calculating connectivity index, in order to estimate impact on wetland ecosystem service function. However, most of the impacts of hydrological connectivity on wetlands are static or unidirectional. In particular, the hydrological connectivity of wetlands is disturbed by climate change and human activities. Especially in recent decades, large-scale human activities have changed the landscape structure of wetlands, resulting in observable changes of wetland hydrological connectivity pattern. Therefore, it is necessary to further explore the variation characteristics of hydrological connectivity patterns, so as to provide a scientific basis for understanding the impact of wetland hydrological connectivity on wetland ecosystem processes. In addition, a group of linked nodes is usually defined as a component according to the distance threshold amongst analysis of landscape connectivity. As part of the overall composition of the landscape, the distance threshold directly determines the strength of the landscape patch connectivity in the study area. Because different protected areas have different protected species with diverse moving distance, the distance threshold is always determined by the maximum moving distance of protected species (Duetal., 2019; Buetal., 2020; Xiongetal., 2008). Therefore, it is important to confirm the optimal distance threshold for protected areas, which can be used as a basis for the establishment of corridors and landscape restoration.
The Naoli River Basin is located in the central of the Sanjiang Plain (Yaoetal., 2011), and the marsh wetlands are widely distributed. Since the mid-1950s, high strength human activities such as large-scale reclamation of the marsh wetlands has been carried out, resulting in fragmented wetland landscape, thereby changing the hydrological connectivity of regional wetland ecosystem. In addition, the Naoli River Basin is an important habitat for migratory birds in the East Asian during migration, so it is of great significance to investigate the optimal distance threshold of marsh wetland landscape and the changing spatial-temporal characteristics of hydrological connectivity, for the maintenance of wetland ecosystems in the region, the protection of migratory bird habitat and the formulation of relevant conservation policies.
1 Overview of the studied area
Located in the hinterland of the Sanjiang Plain, the Naoli River Basin is a typical temperate wetland ecosystem with coordinates of 132°E-134°E, 46°N-47°N, and the areas is about 23 000 km2. This area is an important natural regional unit of the Sanjiang Plain, and is also one of the most concentrated areas of freshwater marsh wetlands distribution in China. Wetlands in the region are widely developed and diverse in types. Since the 1950s, the Naoli River Basin has been undergone a large-scale agricultural development process, with a large number of ditches being built and land-use changes leading to the loss of hydrological connectivity and the fragmentation of the landscape. The Naoli River National Nature Reserve is an important docking area for precious migratory birds (oriental white stork, white crane, red-crowned crane and other national first-class protected animals), which is located in the center of the Basin. The decrease of wetland hydrological connectivity will inevitably lead to the destruction of the habitat of rare birds, resulting in reducing the function of wetland ecosystem. Therefore, it is necessary to analyze the variation characteristics of hydrological connectivity in Naoli River Basin, which can provide a scientific basis for the restoration and maintenance of wetland ecosystem and the protection of rare bird’s habitats in the Basin.
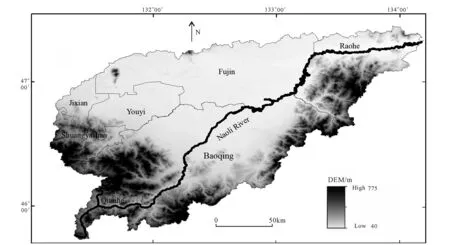
Fig.1 Location of the studied area
2 Data and methods
2.1 Data
The landscape pattern data of the Naoli River Basin in the 1950s was mainly originated from topographic maps. The maps were geometrically certificated and then digitalized to obtain the landscape data. We downloaded the Landsat MSS, TM and OLI remote sensing images of 1980s, 1995, 2000, 2005 and 2015 respectively. The spatial resolution of images was 30 m, with good imaging quality, and cloud coverage is less than 5%. Then the images were geometrically and atmospherically corrected in ENVI5.3 and the artificial interpretation was implemented based on the land classification system to obtain the landscape pattern data in in ArcGIS software. Finally, the wetland hydrological connectivity index was calculated using multi-period landscape data by Conefor 2.6 software.
2.2 Method
(1) Number of links (NL)
Number of links refers to the number of patches which connected in pairs (Liuetal., 2019). Whether two patches are connected depends on whether the distances between them are less than the distance threshold. As landscapes become more connected, the number of links increases.
(2) Number of components (NC)
A component represents a whole set of patches that are functionally or structurally interconnected (Laitaetal., 2010). The number of components represents the total number of components. An isolated node or patch is treated as a component, and there is no functional relationship between components. Therefore, the closer the links between the patches in the landscape, the fewer the number of components is(Zhaoetal., 2017).
(3) Integral index of connectivity (IIC)
IICis often used to evaluate the overall landscape connectivity level of the study area (Liuetal., 2019), the formula is as follows:
(1)
Wherenis the total number of nodes in the landscape,aiandajare the attributes of nodes,iandj,nlijis theNLin the shortest path (topological distance) between nodesiandj, andALis the maximum landscape attribute. For nodes which are not connected (belonging to different components), the numerator in theIICequation is equal to zero (nlij=∞).nlij=0 wheni=j, which is related to the concept of habitat availability applicable forIIC, where the node itself is regarded as a connected space. If the node attribute refers to area (habitat patch area), thenALis the total landscape area (total analysis area, including habitat and non-habitat patches).When all landscapes are occupied by habitats,IIC=1.
(4) Probability index of connectivity (PC)
PCrefers to the possibility of connectivity between patches (Liuetal., 2019), which is negatively related to the distance between patches, with the value ranging from 0 to 1, and it increases with the improvement of connectivity. Calculated as follows:
(2)


(5) Class coincidence probability (CCP)
CCPrefers to the probability that two random patches in the study area belong to the same component (Liuetal., 2019), with a range of 0 to 1, which increases with the increase of connectivity. The formula is:
(4)
WhereNCis the number of components in the landscape,Ciis the total component attribute (the sum of all attributes belonging to the component), andALis the maximum landscape attribute. If the node attribute is area, thenALis the total landscape area (the area of the analysis area, including Habitat and non-habitat patches),CCPis defined as the probability that two random points (animals) located in the landscape belong to the same habitat (Two points are located in habitat patches, and there is a path link through the two patches).
3 Results
The hydrological connectivity of wetland patches is related to the scale of ecosystem processes, such as the biological migration of wetland. Therefore, it is necessary to design different gradients in order to confirm the distance threshold for wetland patch connectivity. As the main protected species in the Naoli River Basin are aquatic birds, and whose average search range is 0-40 km, we set 11 distance thresholds, including 0.5, 1, 3, 5, 10, 15, 20, 25, 30, 35 and 40 km, respectively, to explore the variation characteristic of the hydrological connectivity. Then, the optimal distance threshold was determined based on the analysis of the hydrological connectivity of wetlands in the Naoli River Basin in 2015.
3.1 Analysis of hydrological connectivity of wetlands in Naoli River Basin at different distance thresholds
Based on the landscape patterns data of marsh wetland in Naoli River Basin in 2015, we used Conefor 2.6 software to calculate the variation characteristics of marsh wetland landscape connectivity index with different distance thresholds. Table 1 shows the hydrological connectivity indices of wetland landscape in the Naoli River Basin at different distance thre-sholds in 2015. From Table 1, theNLof marsh wetland in the Naoli River Basin increases along with the increase of the distance threshold, indicating that it is easier to establish links between any two patches in the landscape with larger search range (distance threshold). TheNCdecreases when the distance threshold increases, and finally theNCreduces to 1. When the distance threshold is 0.5 km, there are a fewNLbetween marsh wetland patches in Naoli River Basin, and many patches are independent. That is to say, only a part of patches can be linked to each other, and the linked patches belong to one component. When the distance threshold is 35 km, theNCequals to 1, indicating that all marsh wetland patches in the landscape can be linked to each other and belongs to
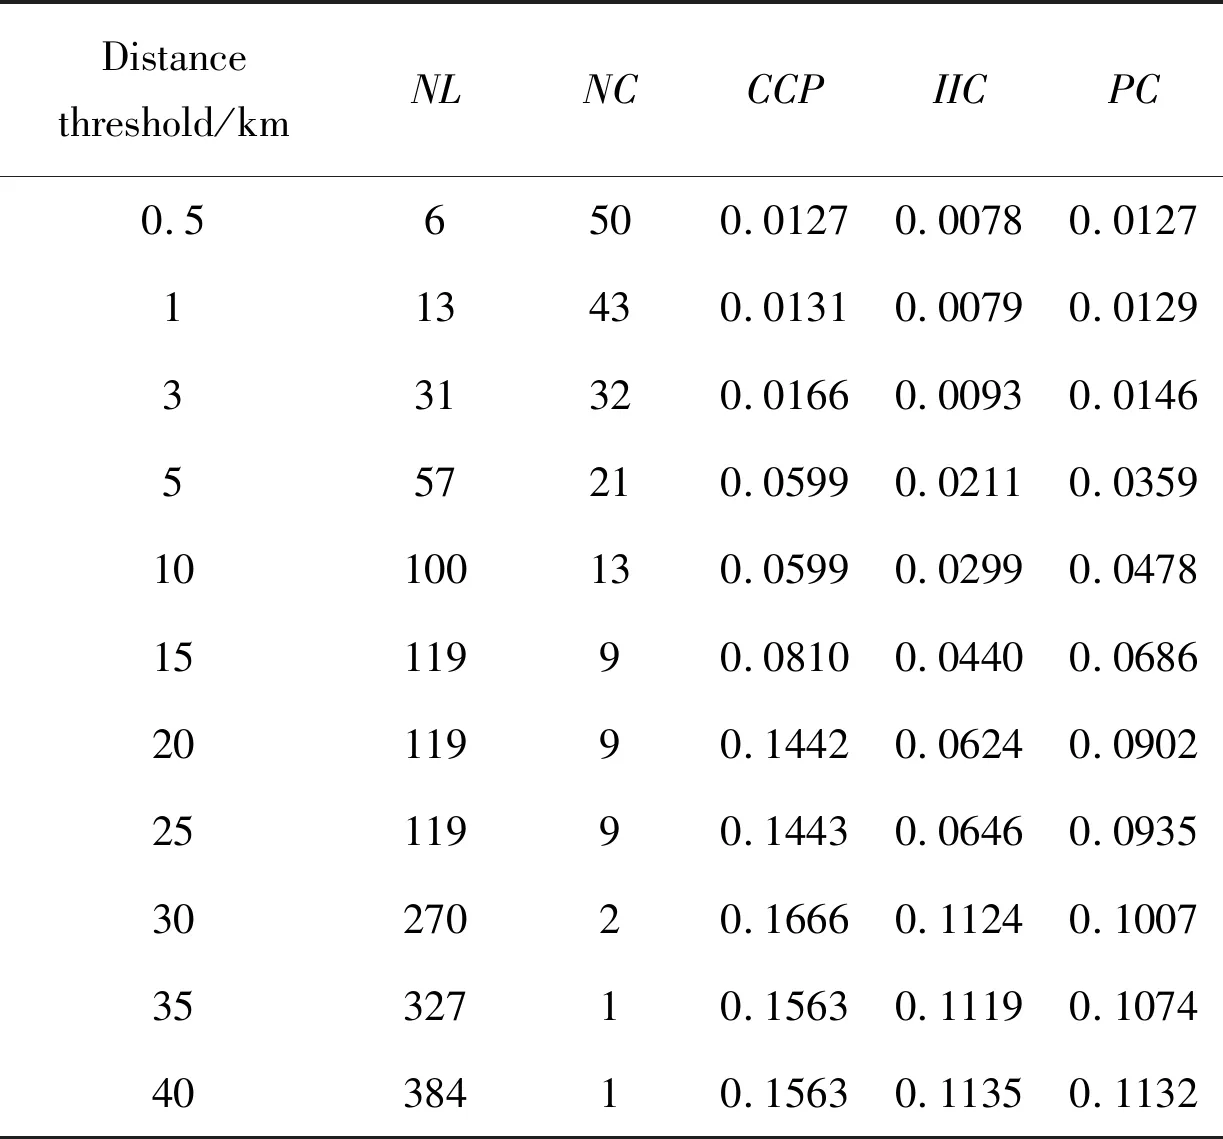
Table 1 Connectivity index of landscape marsh wetland with different distance thresholds in Naoli River Basin
the same component. As the distance threshold continues to increase to 40 km, theNCdoes not change. TheCCPindex of the marsh patches increases with the increase of distance threshold, indicating that the possibility of each patch belonging to the same component is increasing. When the distance threshold exceeds 35 km, all patches belong to one component, and theCCPindex remains unchanged. TheIICandPCincrease with the distance threshold, but the change of those indices was not consistent with theNCindex and combination probability index, which also better reflects the actual connection of the study area.
3.2 Determination of optimal distance for hydrological connectivity in Naoli River Basin
Table 2 shows the patch area, patch number and their percentage of the landscape marsh wetland with different distance thresholds. When the distance threshold is 0.5 km, the number of linked patches is only 11, accounting for 19.6% of the total patch numbers, and the linked patches area is 1 646.36 km2, accounting for 83.3% of the total marsh wetland area in the Naoli River Basin. When the distance threshold is 3 km, there are about 35 linked patches, accounting for 76% of the total number of linked patches, and the areas of the link patches is 1 913.336 km2, accounting for 97% of the total areas. When the distance threshold is 10 km, the number of linked patches is 49, accounting for 87.5% of the total number of patches, and the area of linked patches is 1 930.71 km2, accounting for 97.67% of the total area. When the distance threshold reached 35 km, the number of linked patches is 56, accounting for 100% of the total number of patches, so as the area of the linked patches (Fig.2).
Fig.2 shows the variation characteristic of numbers and areas of linked patches. The number and area of linked patches increase with the distance threshold, indicating that there are more patches to link together with a long distance threshold. Especially for the number of the linked patches, when the distance threshold increases from 0.5 km to 10 km, the proportion number of linked patches increases sharply from 19.64% to 87.5%. When the distance threshold ranges from 10 km to 40 km, the percentage of the linked patches only increases 12.5%, indicating that most of the marsh patches could be linked together with the 10 km distance threshold.
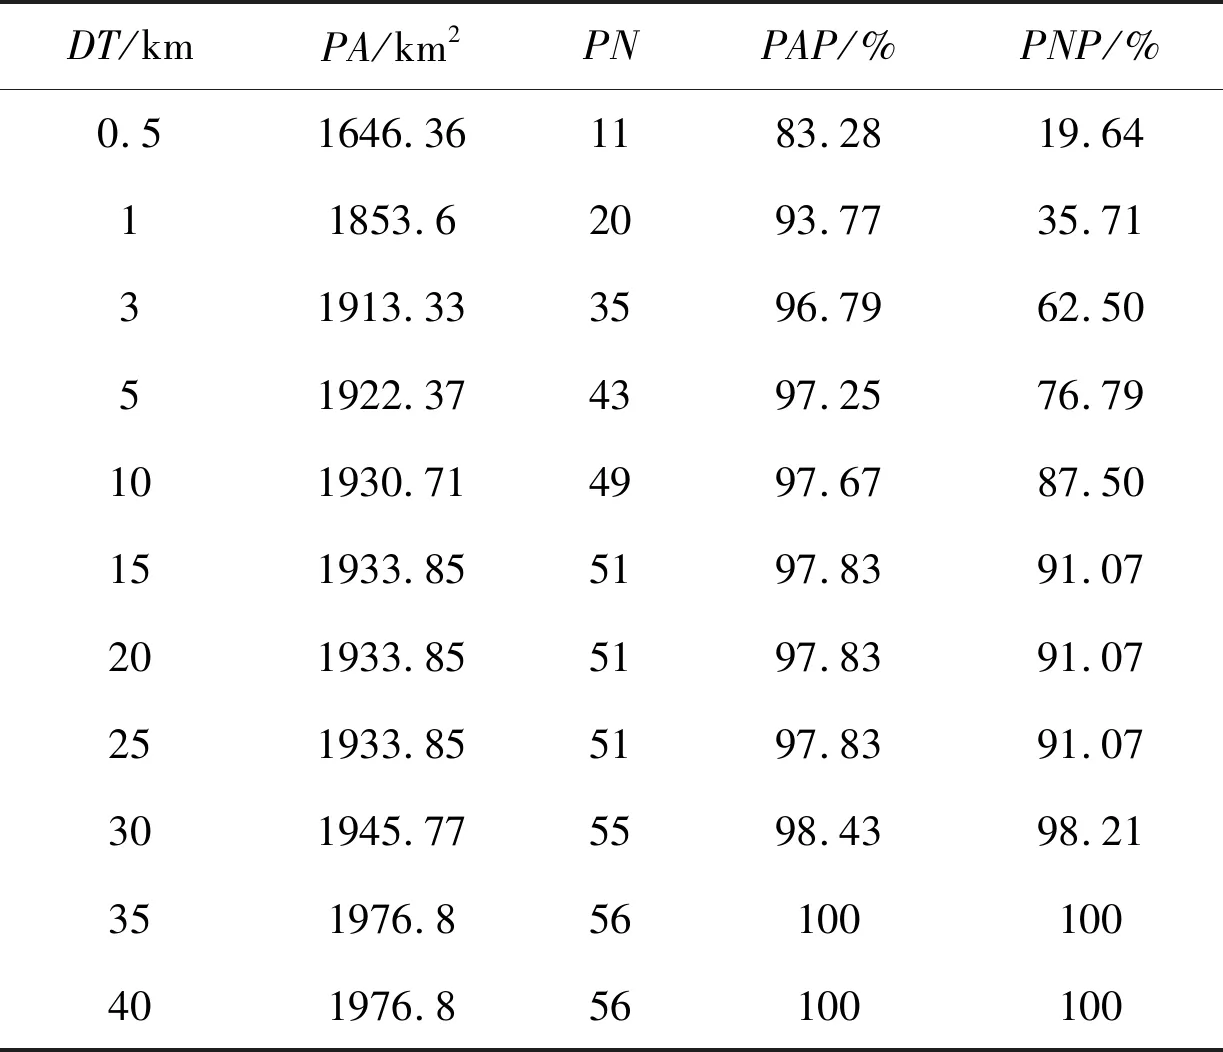
Table 2 Patch area, patch number and their percentage of landscape marsh wetland with different distance thresholds
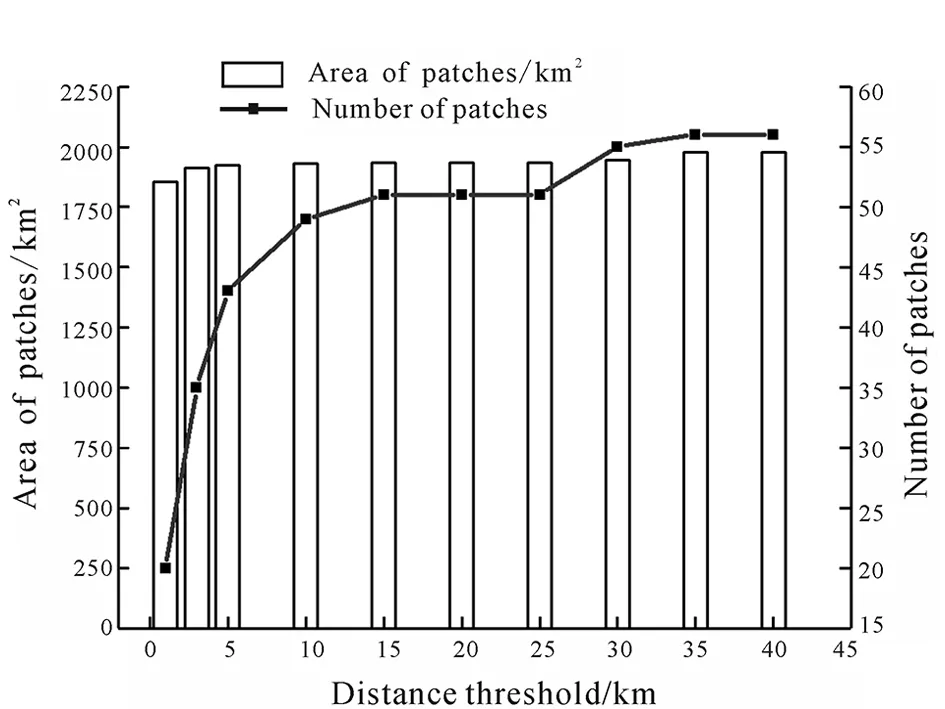
Fig.2 Area and quantity of marsh patches in Naoli River Basin at different distance thresholds
Fig.3 shows theNCand the patches in the maximum component (PMC) with different distance thresholds in the Naoli River Basin. When the distance threshold is 0.5 km, the number of components is 50, and the number of patches in the maximum component is 4. With the increase of the distance threshold, the number of components decreases gradually, and the patches in the maximum component increase gradually. When the distance threshold is 10 km, the numbers of components and the patches in the maximum component are both 13, but more than 97.67% areas of the patches are linked together. When the distance threshold is greater than 10 km, number of component steadily decreases to 1, and the percentage of patches in the maximum component gradually increases to 100%, indicating that 10 km is the optimal distance threshold for hydrological connectivity in Naoli River Basin.
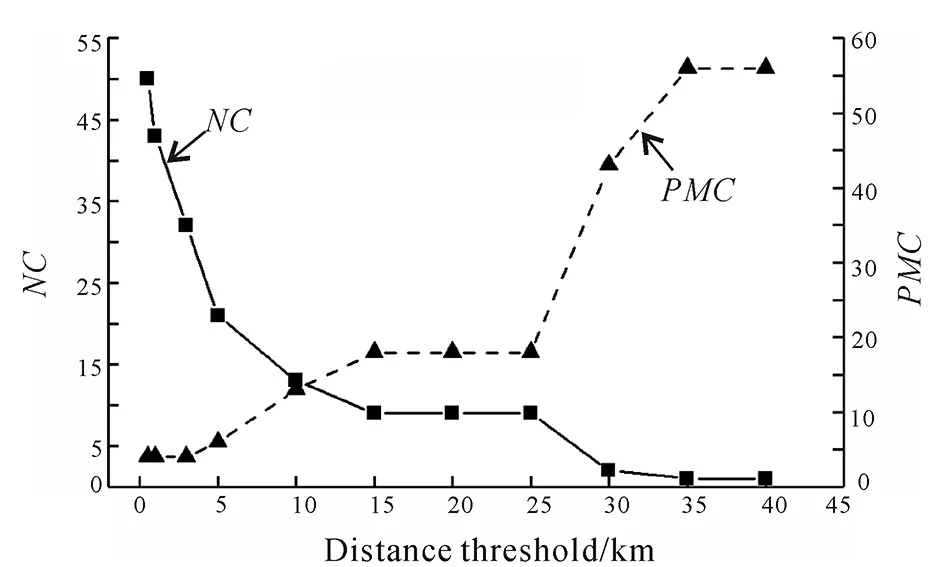
Fig.3 Number of component and patches in the maximum component (PMC) with different distance thresholds in Naoli River Basin
3.3 Temporal and spatial variation characteristics of hydrological connectivity of marsh wetland in Naoli River Basin
The hydrological connectivity indices of march wetland from 1950s to 2015 were calculated in Naoli River Basin with an optimal distance threshold of 10 km. Table 3 shows the results of hydrological connectivity indices. It can been seen that the area of marsh wetland in Naoli River Basin has obviously decreased from 18 355.05 km2to 1 751.39 km2from 1950s to 2015, and the hydrological connectivity indices, such asCCP, overallIICandPC, have also been declining. The massive march were reclaimed into paddy fields, resulting in fragmentation of wetland which hindered the hydrological connectivity of wetlands, meanwhile the increasingNCand decreasingNLindicate that the fragmentation of the marsh landscape was gradually getting serious in the Naoli River Basin during this periods. In 2015, the increasing areas of the marsh and indices ofIICandPCindicated that hydrological connectivity of marsh wetlands in the Naoli River Basin was slightly improved. But the decline indices ofNCandNLillustrated the deterioration of fragmentation of the marsh wetland continued.
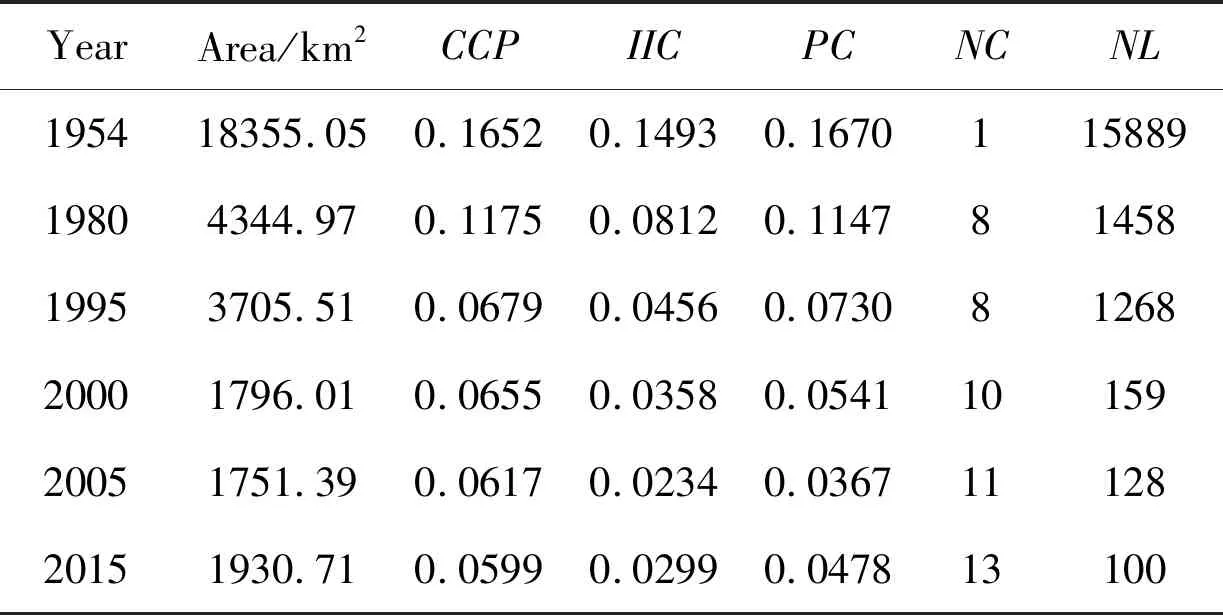
Table 3 Hydrological connectivity index of marsh wetland in Naoli River Basin from 1950s to 2015
4 Conclusions
According to the maximum activity distance of the main protected species in the Naoli River Basin, the variation characteristics of the marsh wetland hydrological connectivity were analyzed by setting 11 distance thresholds. The optimal distance threshold was 10 km which was determined by analysis of the relationship between area and number of linked patches and the relationship between theNCand thePMCwith different distance thresholds. Then we calculated hydrological connectivity indices from 1950s to 2015, in order to explore the change characteristics of the marsh wetlands hydrological connectivity in Naoli River Basin. The conclusions are follow:
(1)The hydrological connectivity index of the marsh wetlands in the Naoli River Basin showed a growth trend with increasing distance threshold. All patches of marsh wetlands linked together when the distance threshold reached 35-40 km;
(2) The variation characteristics of theNCand thePMCdetermined that the optimal distance of hydrological connectivity is about 10 km for marsh wetlands in whole Naoli River Basin;
(3) The total hydrological connectivity indices of marsh wetlands deceased in the Naoli River Basin from 1950s to 2015. Although the hydrological connectivity slightly improved in 2015, the fragmentation of the marsh wetland continued to deteriorate.
Due to high-intensity human activities in the Naoli River Basin, large-area of marsh wetlands were reclaimed to farmland, resulting in a sharp decrease in the hydrological connectivity of marsh wetlands. Through the analysis of the optimal distance threshold and hydrological connectivity index in different periods of Naoli River Basin, it can provide a scientific basis for restoring and increasing marsh wetland hydrological connectivity, and formulating a scientific policy of wetland restoration, in order to provide a suitable habitat environment for the migration, reproduction and rest of rare aquatic birds in Naoli River Basin.
杂志排行
Global Geology的其它文章
- Application of Gaussian beam pre-stack depth migration in rugged seabed
- Influence of fracture width on borehole radar response
- Common offset ground penetrating radar data inversion based on ray theory
- Geochemical characteristics and sedimentary environment significance of carbonate rocks in Nanfen Formation of Qingbaikou System in Tonghua, Jilin Province
- Origin of ore-forming fluids in Qinggouzi stibnite deposit,NE China: Constraints from fluid inclusions and H-O-S isotopes
- Chemical indexes of Paleoproterozoic sedimentary rocks from Liaohe Group, North China Craton: Implications for paleoclimate and provenance
