Common offset ground penetrating radar data inversion based on ray theory
2021-05-26XUEMeiqiLIUSixinLUQiLIHongqingWANGYuanxinCHANGXinghaoRANLiminZHAOYonggangandLIJianwei
XUE Meiqi, LIU Sixin*, LU Qi, LI Hongqing, WANG Yuanxin,CHANG Xinghao, RAN Limin, ZHAO Yonggang and LI Jianwei
1. College of Geo-Exploration Science and Technology, Jilin University, Changchun 130026, China;2. North China Petroleum Engineering Company, SINOPEC, Zhengzhou 457000, China
Abstract: The authors use the common offset ground penetrating radar (GPR) data inversion based on ray theory to estimate interval velocity and to obtain the relative permittivity. In the ray-tracing based inversion, the input data are the offset distance between antennas, the velocity of the first layer, the pick-up amplitude and re-ference amplitude of each reflection layer. The thickness and velocity of each layer are calculated by this recursive method. Firstly, the horizontal homogeneous layered medium model is established, and the ideal inversion results are obtained. Subsequently, Monte Carlo method is used to establish a randomly undulating homogeneous layered medium model. The common offset GPR data for the built geological model is then simulated by finite-difference time-domain (FDTD). It proved that this ray-tracing based inversion method is feasible for the horizontal layered geological model, even the layered geological model with random undulation. Undulation, represented by RMS height and CL (correlation length), influences the inversion results. Finally, a more complex geological model-pinch-out model was established. In the pinch-out model, the pinch-out interface can be clearly identified, though there is a false anomaly, which will not significantly affect the identification of the underground medium structure.
Keywords: ray-tracing based inversion; FDTD; rough surface; common offset; GPR data; reflection amplitude
0 Introduction
GPR is a high-resolution geophysical technology based on electromagnetic wave propagation in the frequency range between 1 MHz and 3 GHz (Forteetal., 2014). It is used for the internal imaging of various types of geological materials such as soil, rocks, and artificial materials including concrete and asphalt (Mostaphaetal., 2018; Fa, 2013). It has the advantages of high speed, high resolution, continuity and no damage, and therefore it has been widely used in geological prospecting, archaeology, roadbed detection etc. (Cassidy & Millington, 2009; Zyadaetal., 2011). The path, electromagnetic field strength and waveform of electromagnetic waves when propagating in the medium vary with the dielectric properties and geometry of the medium through which they pass. Therefore, based on the recorded electromagnetic wave travel time, amplitude and other waveform data, the geometry of the target body and shape of abnormal structure can be interpreted. In seismic processing, velocity models are usually obtained by analyzing the data collected at multiple source-receiver offsets (Forteetal., 2014). However, most commercial GPR systems are equipped with a single receiver antenna, so the acquisition of multiple offset data sets is very demanding (Forteetal., 2014; Pipanetal., 1999). GPR data collection in common offset is simple, fast, and can be used for large-scale survey along the gird or line. The obtained data show the change of the physical properties of the underground medium within a certain range. Therefore, we can use the common offset GPR data to estimate velocity.
1 Method
1.1 Monte Carlo method for stochastic rough surface modeling
Using the power spectral density, the random rough surface can be simulated and generated by the Monte Carlo method, which is also called the linear filtering method. The basic idea of Monte Carlo method is to filter it with power spectrum in frequency domain, and to get the height fluctuation of rough surface by inverse fast Fourier transform (IFFT). TheRMSheight and theCLare the two most basic and important parameters in the simulation of rough surfaces, which have a great influence on the height and frequency of rough surfaces (Salvarezzaetal., 2019).
Fig.1 shows the samples of random rough surface under differentRMSheight andCL. When theCLis the same, the greater theRMSheight, the greater the undulation degree of rough surface. When theRMSheight is fixed, the smaller theCL, the more severe the rough surface transformation, that is, the smaller the change period. It can be seen thatRMSheight and theCLrelate to the scale of the rough surface in the vertical and the horizontal direction respectively.

(a) Rough surface corresponding to different RMS height with the same CL (2 m); (b) rough surface corresponding to different CL with the same RMS height (0.1 m).Fig.1 Rough surface corresponding to different CL (a) and RMS height (b)
1.2 Forward method based on FDTD
In the field of computational electromagnetics (EM), FDTD method is one of the most popular numerical techniques for solving EM wave propagation problems (Craigetal., 2019). FDTD method differentiates Maxwell equation in time domain and space domain (Taflove & Umashankar, 1989). Using leapfrog method to calculate the electric and magnetic fields alternately in space domain, and the change of electromagnetic field is simulated by updating in time domain to achieve numerical calculation.
FDTD decomposes the forward target into a Yee unit and forms a staggered network with Yee’s unit (Yee, 1966; Shaarietal., 2010; Luebbersetal., 1993). The electric and magnetic field components are placed crosswise in space, and the relative spatial position of each component is also suitable for the difference calculation of Maxwell’s equation, which can properly describe the propagation characteristics of electromagnetic field. At the same time, the electric and magnetic fields are alternately sampled in time (Soldovierietal., 2007), and the sampling interval is half a time step apart, so that the Maxwell curl equation is discretized to form an explicit difference equation, which can be solved iteratively in time without the need for matrix inversion. Therefore, given the initial conditions of the corresponding electromagnetic problem, FDTD can gradually obtain the distribution of the spatial electromagnetic field at each time.
FDTD method is relatively simple in concept, accurate for any complex model (Irving & Knight, 2006; Balanis, 1989). This paper uses MATLAB code based on FDTD and PML absorbing boundary provided by Irving and Knight (2006).
1.3 Inversion method based on geometric ray theory
The ray-tracing based inversion method used in this paper was proposed by Forteetal. (2014). We assume that the propagation signal is a plane EM wave. Near each trace location, the underground medium is assumed to be homogeneous, isotropic, non-magnetic (μr=1), non-conductive (σ=0), and non-dispersible (Davis & Annan, 1989). The changes of antenna coupling, inherent attenuation and scattering effect are ignored. Normal GPR surveys are performed in transverse electric (TE) broadside configuration (Jol, 2009). Therefore, we only consider the TE mode. According to these assumptions, the proposed method requires offset (x), velocity of the first layer medium (v1), amplitude of direct wave (Ai1), amplitude of reflected wave (Asi) and travel time (TWTi).
Given the first layer velocity (v1), offset (x), and travel time of the first layer (TWT1), we can get the thickness of the first layer (h1) by Equation (1):
(1)
Then the angle of incidence is obtained by Equation (2):
(2)
Using the amplitude values picked up (As1andAi1), the reflection coefficient of the first layerR1can be obtained by Equation (3):
(3)
Then Snell equation gives the velocity of GPR signal in the second layer:
(4)
Whereθ2is obtained by rearranging the Fresnel equation of TE mode (Balanis, 1989):
(5)
If we know the thickness of the firstn-1 layers, the GPR signal velocities of the firstnlayers and theTWTnof thenthinterface reflected wave, then the thickness of thenthlayer (hn) is the only positive solution of the following third-degree equation (Forteetal., 2014):
(6)
(7)
(8)
(9)
In horizontally layered media, the incident angle of thekthinterface is equal to the transmitted angle of the (k-1)thinterface. Such angle (θk) is related to the horizontal projection (△xk) of the travel path in thekthlayer through the following equation (Fig.2):

Fig.2 Schematic diagram of electromagnetic wave ray path in horizontally layered media
S represents the transmitter, R represents the receiver,xis the offset,hiandviare the thicknesses and EM velocities of the layers respectively,θiand △xiare the incident angles and the horizontal projections of the travel path respectively .
Considering the small value ofθkand the Snell’s equation, we obtain:
(11)
According to geometric conditions:
(12)
Then, we can use the Fresnel equation for TE antenna configuration to calculate the firstn-1 reflection and transmission coefficients relative to thenthreflected wave:
(13)
Tk=1+Rk
(14)
withk=1,2,…,n-1.
Considering the symmetry of the travel path (Fig.2), and using the above coefficients and amplitudes we picked(AsnandAi1), the incident and reflected amplitudes of thenthinterface can be obtained by the follow equation:
(15)
(16)
Then, the reflection coefficient of thenthinterface is given by:
(17)
The velocity in the (n+1)thlayer is given by the Snell’s equation:
(18)
with
(19)
By iterating this method for all the interpreted reflections in a GPR trace, the thicknesses and velocities of all the imaged layers can be obtained.
2 Numerical examples
First, we established a horizontal homogeneous layered medium model with a size 10 m×4.5 m. The specific parameters are shown in Table 1.

Table 1 Model parameters for forward modeling
Then, numerical simulation is performed on the established model. The frequency of transmitting antenna is 100 MHz. The time window is 120 ns and the sampling interval is 0.04 ns. The starting position of transmitting antenna is 0.5 m and the ending position is 8.5 m. The starting position of receiving antenna is 1.0 m and the ending position is 9.0 m. The moving step of both antennas is 0.25 m.
After obtaining the forward results, we pick up the reflection amplitude; perform the above iterative inversion on data of all traces. The calculated results are shown in Table 2.

Table 2 Inversion results of layered models
It can be seen from the above table that the relative error will increase with depth, but the relative error of this method is not more than 6%, so this ray-tracing based inversion method is feasible.
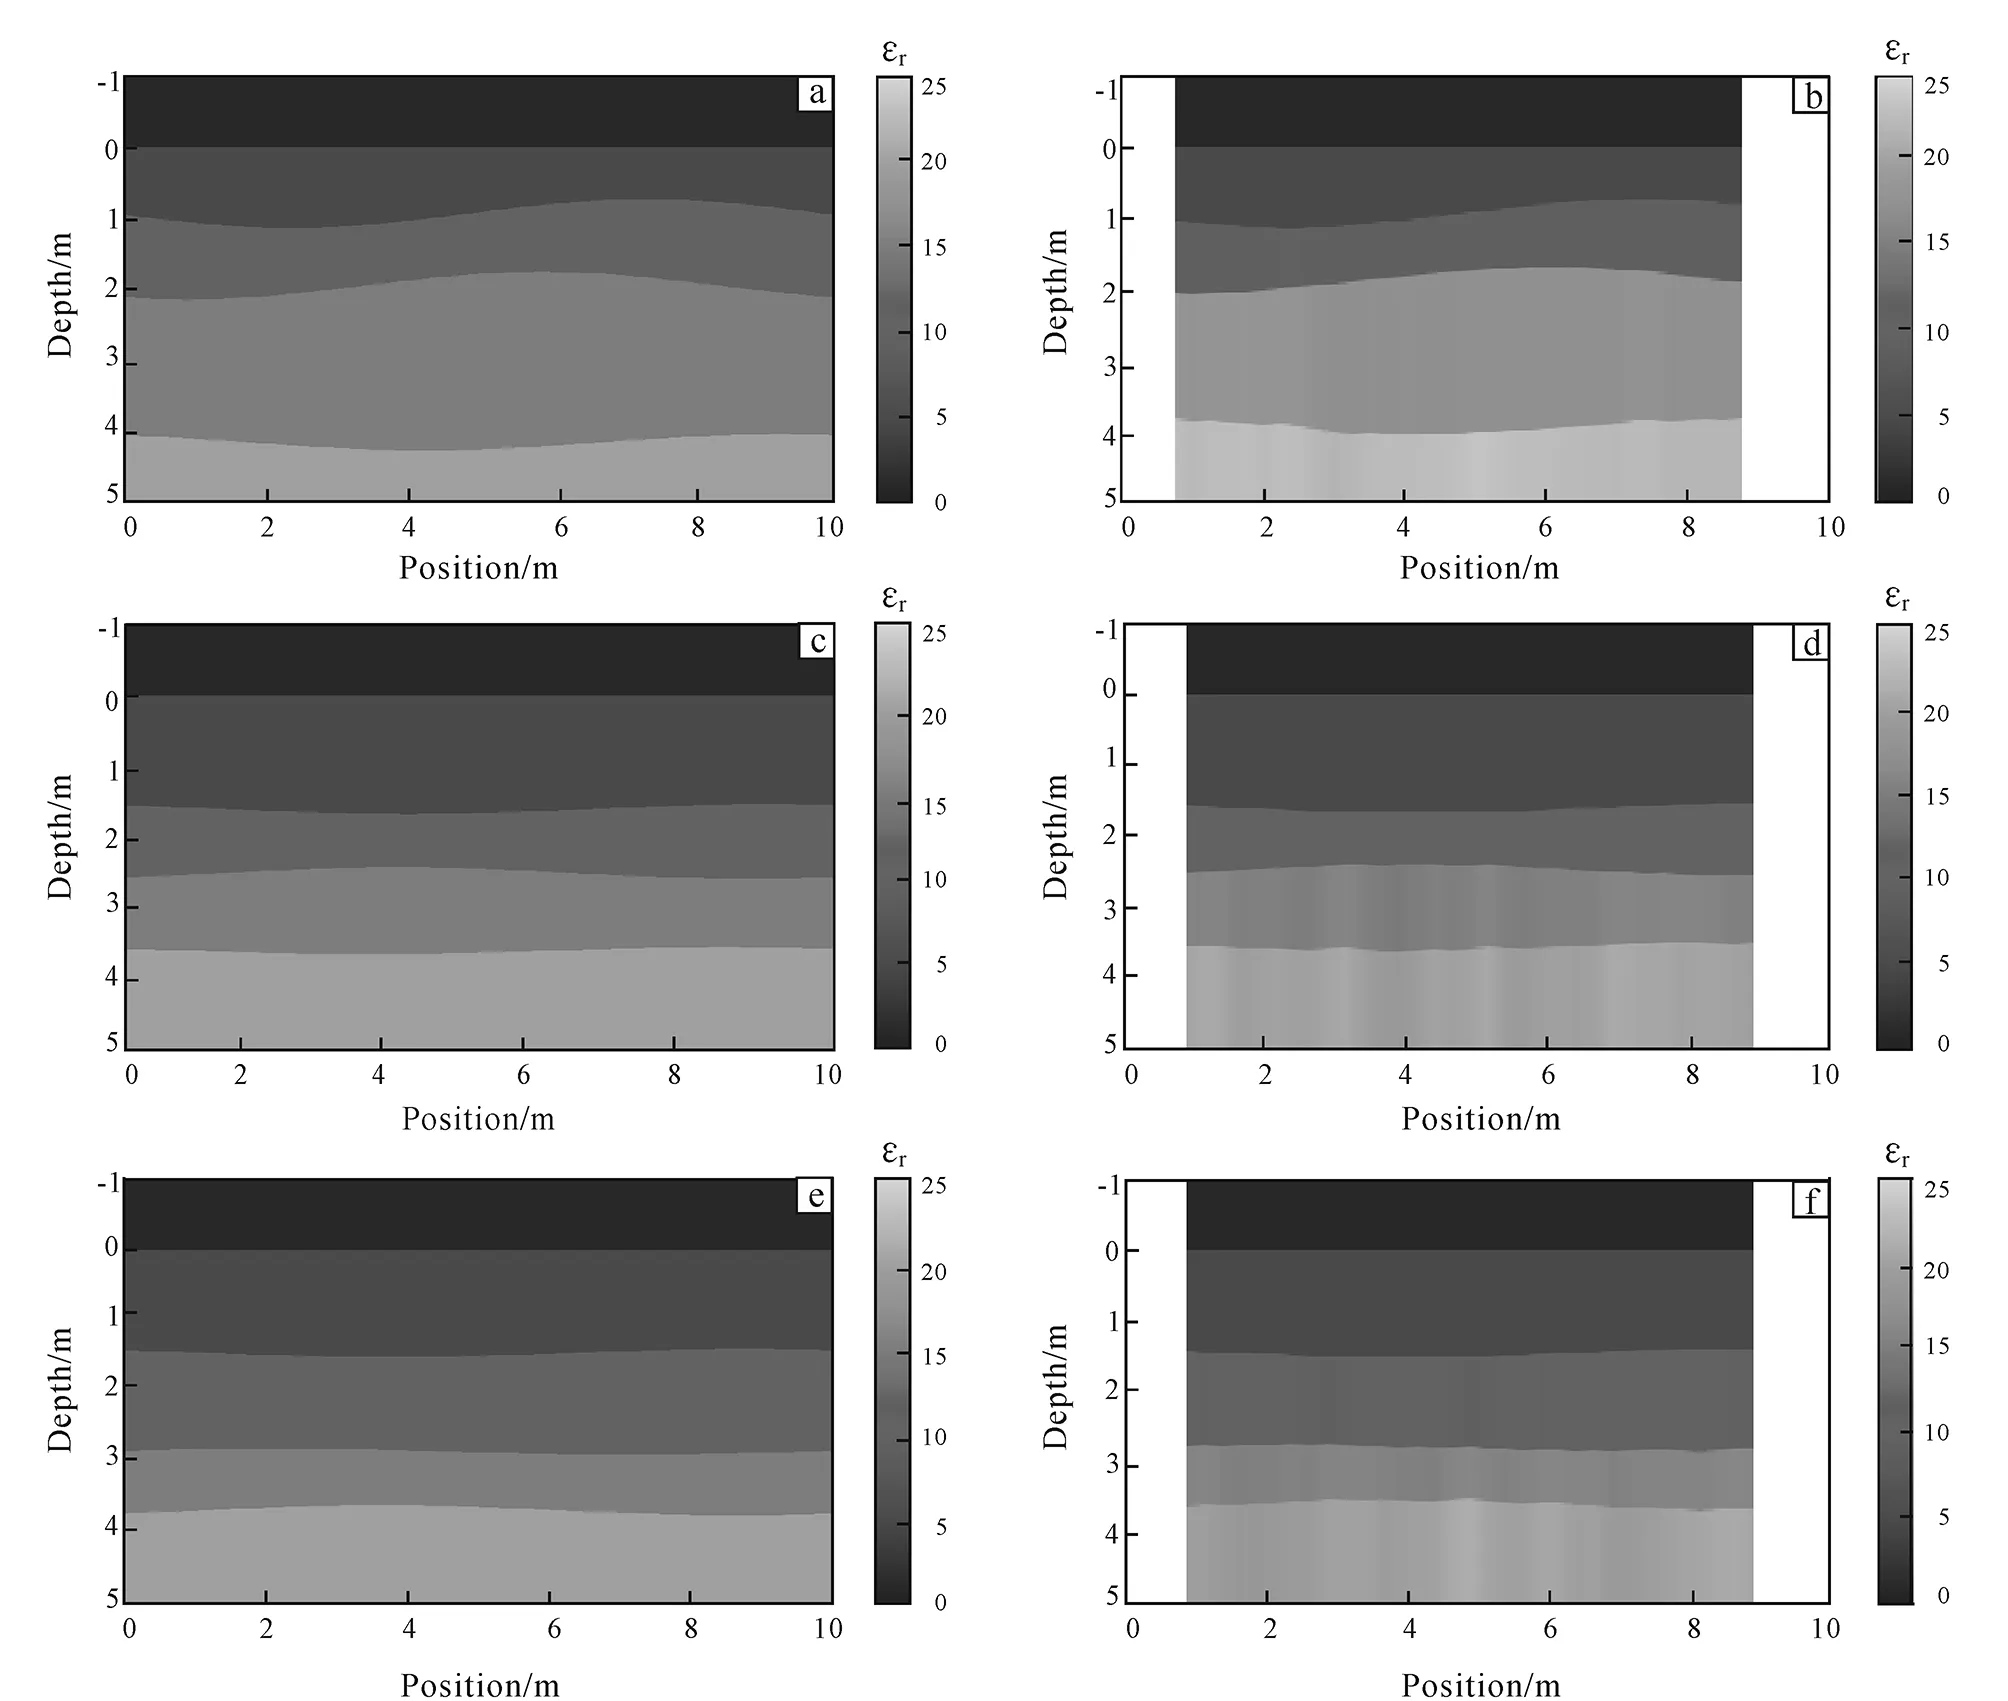
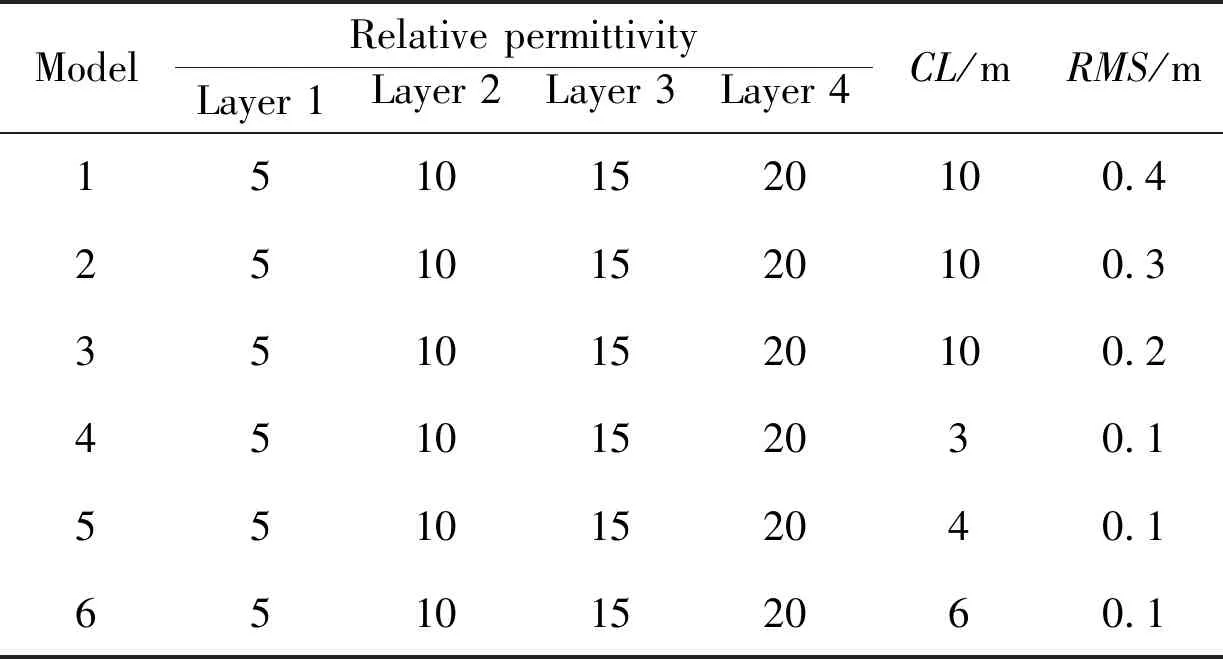
Then, we established three undulating stratum models with a size 10 m×5 m, with the sameCLand differentRMSheights. The length of each rough interface is 15 m. The specific parameters are shown in models 1-3 of Table 3.
After obtaining the forward results, we pick up the reflection amplitude, perform the above iterative inversion on all traces, and perform linear interpolation on the space between the two tracks, the numerical model and calculated result are shown in Fig.3.

(a), (c) and (e) are numerical models, RMS are 0.4 m, 0.3 m and 0.2 m, respectively; (b), (d) and (f) are calculated models, RMS are 0.4 m, 0.3 m and 0.2 m, respectively.Fig.3 Three undulating strata models with the same CL

Table 3 Model parameters of undulating strata for forward modeling
The top layer of the models is air. The transmitting and receiving antennas are located at 0 m on they-axis. Due to the position setting of transmitting antenna and the receiving antenna, we can only calculate the dielectric constant of the medium between 0.75-8.75 m.
It can be seen from above examples that this ray-tracing based inversion method can be used for the inversion of common offset GPR data. It can perfectly distinguish the shape and position of the reflection interface, but as theRMSincreases, in other words, the degree of undulation of the rough surface increases,the calculation error of the permittivity of the medium is also increasing.
Subsequently, we established three undulating stratum models with the sameCLheights and different correlation length. The specific parameters are shown in models 4-6 of Table 3.
The numerical model and calculated result are shown in Fig.4.
It can be seen from above examples, as the correlation length increases, the calculation error of the permittivity of the medium is also decreasing.Finally, we established a pinch-out model with an inclination of 30 degrees, the numerical model and calculated result are shown in Fig.5.

(a), (c) and (e) are numerical models, CL are 3 m, 4 m and 6 m, respectively; (b), (d) and (f) are calculated models, CL are 3 m, 4 m and 6 m, respectively.Fig.4 Three undulating stratum models with the same RMS heights
From Fig.5, the pinch-out interface can be clearly seen in the inversion results. However, there is an obvious false anomaly in the dielectric constant where the pinch-out strata disappeared (6.2 m). The main reason is that the diffraction wave at this place is obvious, and it is very difficult to pick up the amplitude of the reflected wave. Anyway, this false anomaly does not affect our identification on the true structure of the underground medium.

Fig.5 Diagrams of numerical pinch-out model (a) and calculated pinch-out model (b)
3 Conclusion
It is proven that the ray-tracing based inversion is feasible in the horizontal homogeneous layered medium model, even in the layered geological model with random undulation. In the horizontal homogeneous layered medium model, the error will increase with depth. In the layered geological model with random undulation, as theRMSincreases, that is, the degree of undulation of the reflection interface increases, the calculation error of the permittivity of the medium is also increasing. As the correlation length increases, that is, the degree of undulation of the reflection interface decreases, the calculation error of the permittivity of the medium is also decreasing. In the pinch-out model, the pinch-out interface can be clearly identified, although there is a false anomaly, which will not significantly affect the identification of the underground medium structure. In general, it is feasible to use this method to invert common offset ground penetrating radar data.
杂志排行
Global Geology的其它文章
- Application of Gaussian beam pre-stack depth migration in rugged seabed
- Influence of fracture width on borehole radar response
- Evolution characteristics of hydrological connectivity pattern of marsh wetland in Naoli River Basin
- Geochemical characteristics and sedimentary environment significance of carbonate rocks in Nanfen Formation of Qingbaikou System in Tonghua, Jilin Province
- Origin of ore-forming fluids in Qinggouzi stibnite deposit,NE China: Constraints from fluid inclusions and H-O-S isotopes
- Chemical indexes of Paleoproterozoic sedimentary rocks from Liaohe Group, North China Craton: Implications for paleoclimate and provenance
