Landscape of cell heterogeneity and evolutionary trajectory in ulcerative colitis-associated colon cancer revealed by single-cell RNA sequencing
2021-05-19QuanWangZhuWangZhenZhangWeiZhangMengmengZhangZhanlongShenYingjiangYeKeweiJiangShanWang
Quan Wang,Zhu Wang,Zhen Zhang,Wei Zhang,Mengmeng Zhang,Zhanlong Shen,Yingjiang Ye,Kewei Jiang,Shan Wang
1Department of Gastroenterological Surgery,Peking University People’s Hospital,Beijing 100044,China;2 Laboratory of Surgical Oncology,Beijing Key Laboratory of Colorectal Cancer Diagnosis and Treatment Research,Peking University People’s Hospital,Beijing 100044,China;3Department of Gastrointestinal Surgery,Shandong Provincial Hospital Affiliated to Shandong First Medical University,Jinan 250021,China
Abstract Objective:The goal of this study was to get preliminary insight on the intra-tumor heterogeneity in colitisassociated cancer (CAC) and to reveal a potential evolutionary trajectory from ulcerative colitis (UC) to CAC at the single-cell level.Methods:Fresh samples of tumor tissues and adjacent UC tissues from a CAC patient with pT3N1M0 stage cancer were examined by single-cell RNA sequencing (scRNA-seq).Data from The Cancer Genome Atlas (TCGA)and The Human Protein Atlas were used to confirm the different expression levels in normal and tumor tissues and to determine their relationships with patient prognosis.Results: Ultimately,4,777 single-cell transcriptomes (1,220 genes per cell) were examined,of which 2,250 (47%)and 2,527 (53%) originated from tumor and adjacent UC tissues,respectively.We defined the composition of cancer-associated stromal cells and identified six cell clusters,including myeloid,T and B cells,fibroblasts,endothelial and epithelial cells.Notable pathways and transcription factors involved in these cell clusters were analyzed and described.Moreover,the precise cellular composition and developmental trajectory from UC to UCassociated colon cancer were graphed,and it was predicted that CD74,CLCA1,and DPEP1 played a potential role in disease progression.Conclusions:scRNA-seq technology revealed intra-tumor cell heterogeneity in UC-associated colon cancer,and might provide a promising direction to identify novel potential therapeutic targets in the evolution from UC to CAC.
Keywords:Ulcerative colitis-associated colon cancer;single-cell RNA sequencing;cell heterogeneity;evolutionary trajectory
Introduction
Colorectal cancer (CRC) is the third most common type of cancer worldwide,and approximately 147,950 new cases and 53,200 deaths were estimated in 2020 in the United States.CRC has been the second most common cause of cancer death,even including 17,930 cases and 3,640 deaths in patients under 50 years of age (1).In China,the incidence and mortality of CRC have been on the rise (2)and CRC incurs a heavy economic burden on the society and individuals (3). Moreover,patients with colitisassociated cancer (CAC),a particular type of CRC that develops from inflammatory bowel diseases (IBDs),have an earlier morbidity and a poorer prognosis (4).CAC is often thought to arise from flat dysplasia with indistinct margins,in a field of concomitant inflammation,scarring,and pseudopolyposis,rather than development from a polypoid adenoma,which is the major cause of sporadic CRC (5).Furthermore,at the molecular level,the sequence of events leading to CAC is distinct from that of sporadic CRC.A distinct set of genes in sporadic CRC,includingTP53(6),APC(7),andKRAS(8) contains more mutations than genes in CACs.However,the molecular process underlying colorectal carcinogenesis in IBDs is still poorly understood.Ulcerative colitis (UC),the most common form of IBD,has become increasingly prevalent worldwide (9).In a previously performed meta-analysis,quantitative estimates of CAC risk in UC patients have been reported to be 2%after 10 years,8% after 20 years,and 18% after 30 years of disease (10),thereby indicating the importance of intensive studies.
In the past,research on tumor origin only targeted the genetic and epigenetic changes of tumor cells.However,over the last 20 years,the tumor micro-environment(TME) has been shown to play an equally important role in cancer development.Intra-tumoral heterogeneity among malignant and non-malignant cells,and their interactions within the TME are critical to tumor initiation,progression,metastasis,and many other diverse aspects of tumor biology (11).Accurate TME information not only helps to gain a better understanding of the tumor origin and development,but also contributes to the development of novel therapeutic targets.
In previous studies,genomic and transcriptomic studies have revealed driver mutations,aberrant regulatory programs,and disease subtypes for major human tumors(12).However,these studies relied on profiling technologies that measure tumors in bulk,and resulted in data that represent an“average”of all cells present,thereby limiting their ability to capture intra-tumoral heterogeneity.Single-cell sequencing provides an avenue to explore genetic and functional heterogeneity at cellular resolution (13).Single-cell RNA sequencing (scRNA-seq)combined with computational methods for functional clustering of cell types provides a less biased approach to the understanding of cellular heterogeneity.ScRNA-seq has been used in many studies involving human tumors(14),circulating tumor cells (15),and patient-derived xenografts (16),and has exhibited its unique predominance in studies of tumor composition,genomic evolution,cancer stem cells,tumor metastasis,and drug resistance.Here,we used scRNA-seq to generate phylogenetic trees and determined the evolutionary process of UC-associated colon cancer.To our knowledge,this is the first study depicting the cellular landscape of TME in UC-associated colon cancer at the single-cell transcriptome level.
Materials and methods
Human specimen collection
Fresh tumor tissues and non-malignant tissues (adjacent UC tissues) were taken from a 43-year-old female patient with UC-related colon adenocarcinoma who had a history of UC for eight years.The postoperative pathology was classified as pT3N1M0 (IIIB stage),which was defined as median differentiation ulcerative adenocarcinoma and microsatellite stability.Written informed consent was provided by the patient.This study was approved by the Research and Ethical Committee of Peking University People’s Hospital and complied with all relevant ethical regulations.Following surgical resection,a tumor tissue sample and a non-malignant colon tissue sample,which was at least 5 cm away from the neoplastic foci were obtained(Supplementary Figure S1).
Protocols of scRNA-seq and data quality control
Protocols for the preparation of single-cell suspensions,droplet-based scRNA-seq,and other methods related to single-cell analysis,are described inSupplementary Materials.Single cells were filtered for further analysis based upon the criteria,cells that had either fewer than 201 unique molecular identifiers (UMIs),over 6,000 or under 101 expressed genes,or over 10% UMIs derived from the mitochondrial genome were excluded.Gene expression (in UMI) was normalized for scale and transformed in log2(UMI+1).
Principle component analysis (PCA) and t-distributed stochastic neighbor embedding (tSNE)
PCA was used to summarize the resulting variably expressed genes to reduce the dimensionality of this data set.tSNE was applied to recalculate the sample distance by the conditional probability of random neighbor fitting based on Student’st-distribution in high dimensional space,which was further conducted for the above principle components dimensionality reduction via the default settings of the Run tSNE function,in order that sample presents a clearly separated cluster in a low dimensional space.
Pathway and functional annotation analysis
Kyoto Encyclopedia of Genes and Genomes (KEGG) is a database resource for understanding high-level functions and effects of the biological system (http://www.genome.jp/kegg/),and performed via DAVID (https://david.ncifcrf.gov/).Enriched pathways with a Q value ≤0.05 were considered significantly different,like the functional annotation through the Gene Ontology database,for which the Fisher’s exact test was used to select only significant categories including biological process,cellular components,and molecular function classifications.Q value ≤0.05 was considered significantly different.
Gene prognostic performance in The Cancer Genome Atlas (TCGA) data
To evaluate the role of cell type in a larger compendium of tumors,we assessed their expression in bulk RNA-seq data from the TCGA (http://www.cbioportal.org/).Specifically,we downloaded preprocessed gene expression data as well as clinical data for primary solid tumors and normal solid tissues for colon and rectal adenocarcinoma using the Bioconductor TCGA biolinks package (http://www.bioconductor.org/).A total of 598 CRC samples were included and divided into high-and low-expression groups based on median gene expression level.Z scores from the TCGA and the validation cohort were combined using the weighted Z method.For Kaplan-Meier analysis,marker gene expression categorization was optimized.
Immunohistochemical (IHC) staining in The Human Protein Atlas
To confirm the expression change in these genes along with disease progression,IHC staining was used for assessment of the different expression level of a specific gene between normal and tumor tissues from The Human Protein Atlas (https://www.proteinatlas.org/).
Results
scRNA-seq and cell typing of non-malignant and CAC tissues
Fresh tumor and non-malignant tissues were taken from a 43-year-old Chinese female patient with colon adenocarcinoma classified as pT3N1M0,and this patient had been diagnosed with UC for 8 years.Once nonmalignant and CAC tissues were obtained (Supplementary Figure S1),it was rapidly digested to a single-cell suspension and analyzed using scRNA-seq involving a single-tube protocol with unique transcript counting through barcoding with UMIs (Figure 1A).To obtain detailed cellular genetic information on this tumor,over 1.6 billion post-normalization reads were performed for subsequent analysis,which were obtained from 4,777 cells;a median of 1,220 genes per cell were expressed.Of the sample cells,2,250 (47%) originated from tumor tissues and 2,527 (53%) originated from non-malignant tissues(Figure 1B).Following gene expression normalization for read depth and mitochondrial read count,PCA was applied to genes that were variably expressed across all 4,777 cells(n=1,220 genes).Subsequently,cells were classified by cell type using graph-based clustering on the informative principle components (n=12).This approach identified cell clusters that,through marker genes,could be readily assigned to known cell lineages.In addition to cancer cells,myeloid cells,T cells,B cells,fibroblasts,endothelial cells and epithelial cells were identified (Figure 1B,C,Supplementary Table S1).The transcript analysis showed that these cells differed considerably in transcriptional activity,either between different cell types or between regions of the same type.This approach also distinguished the sample origin and numbers between diverse subgroups(Figure 1D).
Different angiogenesis pathways in tumor and nonmalignant endothelial cells
A total of 228 endothelial cells were detected and four clusters were revealed (Figure 2A).We next aimed to identify marker genes for each of these clusters and assign them to known endothelial cell types (Figure 2B,Supplementary Table S1).This revealed three sets of vascular endothelial cells:two were mostly tumor-derived(clusters 1 and 3;ACKR1+andCA4+,respectively) and one was mostly non-malignant tissue-derived (cluster 2;CYR61+).Another set of 25 lymphatic endothelial cells was found in the tumor sample (cluster 4;marker genesLYVE1+andCCL21+),however,interestingly,no distinct cluster of lymphatic endothelial cells from the non-malignant sample was identified.
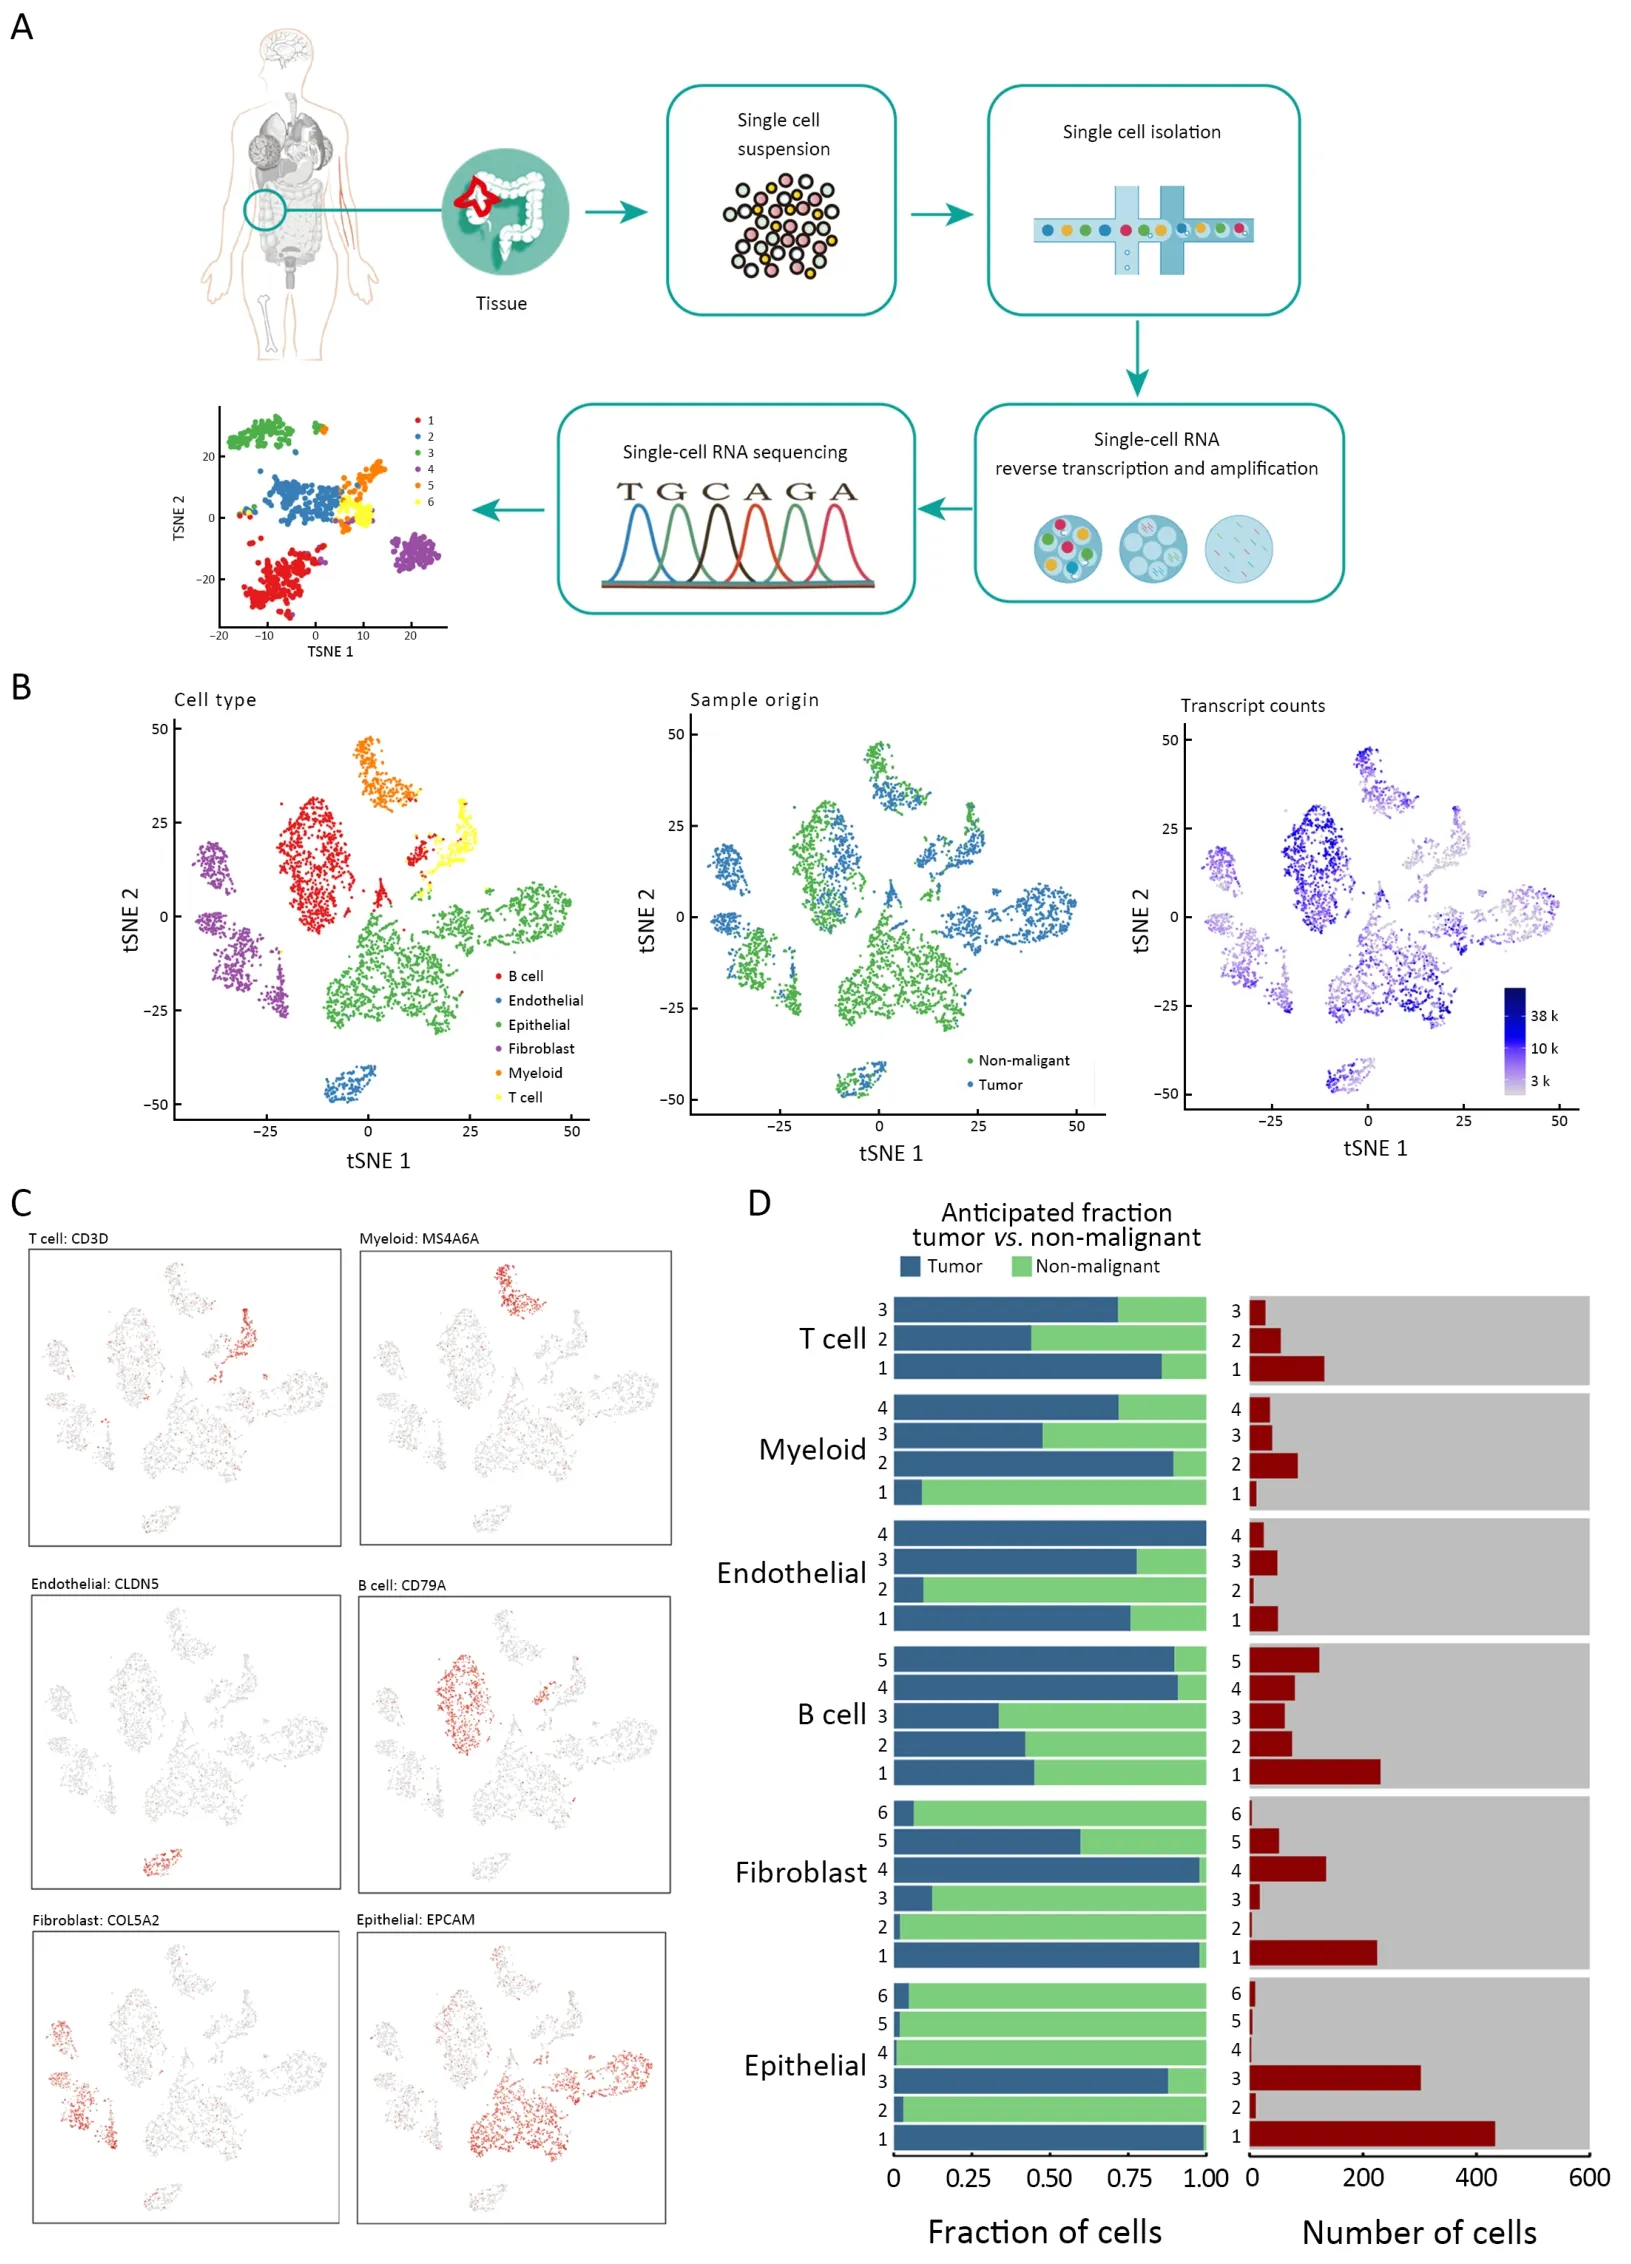
Figure 1 scRNA-seq and cell typing of non-malignant and CAC tissues.(A) Overview of the study design;(B) tSNE of the 4,777 cells profiled here,color-coded by (left to right) cell type,sample origin (tumor or non-malignant tissue) and transcripts counts detected in that cell (log scale as defined in the inset);(C) Expression of marker genes for cell types defined above each panel.In addition to cancer cells,we identified myeloid cells,T cells,B cells,fibroblasts,endothelial cells and epithelial cells;(D) For each of the cell subclusters (left to right):fractions of original cells,and number of cells.scRNA-seq,single-cell RNA sequencing;CAC,colitis-associated cancer;tSNE,t-distributed stochastic neighbor embedding;UMI,unique molecular identifier.

Figure 2 Different angiogenesis pathways in tumor and non-malignant endothelial cells.(A) tSNE plot of 228 endothelial cells (top to bottom),color-coded by their associated cluster,the sample type of origin,and the number of transcripts detected in each cell;(B) tSNE plot color-coded for expression (gray to red) of marker genes,(cluster 1,ACKR1+;cluster 2,CYR61+;cluster 3,CA4+ and cluster 4,LYVE1+);(C) Differences in pathway activities scored per cell by GSVA among the vascular clusters.The KRAS signaling pathway was significantly down-regulated in cluster 2,but up-regulated in clusters 1 and 3,while the Myc target pathway showed contrasting results;(D)Violin plots show the expression distribution of selected genes involved in the KRAS and Myc pathways;(E) SCENIC analysis of the involved transcription factors involved among the clusters.Many transcription factors took part in attending angiogenesis,including FOXP1 and ETS1;(F) Exhibition of the involved pathways (KRAS,Myc) and transcription factors (FOXP1,ETS1) and their target genes,corresponding to the degree of expression.tSNE,t-distributed stochastic neighbor embedding;GSVA,gene set variation analysis;SCENIC,single-cell regulatory network inference and clustering.
Except for lymphocyte-composed cluster 4,we used hallmark pathway gene signature analysis to identify different characteristics among the other three clusters,which were all from vascular endothelial cells (Figure 2C).Interestingly,the KRAS signaling pathway was significantly down-regulated in cluster 2,but up-regulated in clusters 1 and 3,whereas the Myc target pathway showed contrasting results (Figure 2D).Detailed analysis has shown that the two pathways were angiogenesis-related,however,different tissue-derived clusters seemed to have diverse mechanisms.The role ofKRASoncogenes in promoting cellular transformation is well described,and KRAS modulates tumor-stroma interactions and supports cancer invasiveness by influencing the expression of metalloproteinases and cytokines involved in angiogenesis (17).In our study,the high enrichment of KRAS pathway observed in tumor tissues was in accordance with the hyper-vascular nature of tumors.
Next,single-cell regulatory network inference and clustering (SCENIC) analysis (18) was applied,in which differentially expressed genes were scanned for overexpressed transcription factor binding sites,the coexpression of transcription factors and their putative target genes were analyzed (Figure 2E,F).Many transcription factors play a role in angiogenesis,includingFOXP1andETS1.Of note,FOXP1can stimulate angiogenesis by repressing semaphorin 5B in endothelial cells,and regulate angiogenesis through the circ-SHKBP1/miR-544a/FOXP1 pathway (19).Furthermore,ETS1enables angiogenesis in several ways (20).
Cancer associated fibroblasts (CAFs) play various roles in tumorigenesis
Fibroblasts have long been suggested to be a heterogeneous population,but the extent of heterogeneity has yet to be explored.Fibroblast phenotypes are considered highly context-dependent and unstable in culture.In our samples,857 fibroblasts were detected (Figure 3A).Sub-clustering revealed six distinct subtypes:clusters 1 and 4 (cluster 1,PCOLCE2+and cluster 4,CXCL6+) were strongly enriched in tumor tissues,while cluster 2 (PLAT+) was fully enriched in non-malignant tissues.In addition,other clusters (cluster 3,ARHGDIB+;cluster 5,MYH11+;cluster 6,STMN2+),however,were derived from a mixture of tumor and nonmalignant tissues,but were mostly enriched in nonmalignant tissues (Figure 3B).Remarkably,fibroblasts(CD34+andKLF4+) were generally enriched in tumor tissues.The marker genes of CAFs,PCOLCE2andCXCL6were significantly up-regulated in tumor tissues by the bulk RNA-seq data from TCGA data (Figure 3C).
The prime role of CAFs is promoting the proliferation of cancer cells.Clusters 1 and 4 were enriched in Wnt and KRAS signaling,and are closely related with tumor proliferation (21) (Figure 3D,E).SCENIC analysis showed thatKLF12,which promotes CRC growth,was highly expressed in cluster 1 (22) (Figure 3G,Supplementary Figure S2).Furthermore,cluster 4 showed high expression in TGFβ and Wnt signaling,which are also related to cancer invasion and metastasis (23).Another remarkable characteristic of CAFs is extracellular matrix (ECM)remodeling,and collagens,important ECM components,participate in tumor progression (24).We found that various collagens were highly expressed in fibroblasts,and different clusters seemed to have different expression inclinations (Figure 3F).In addition to collagens,many other ECM components,such as fibronectin,periostin,hyaluronan,and proteoglycans (marker genesPRG4,POSTN,HAS2andFN1,respectively) were also upregulated by CAFs (25,26).The corresponding genes were highly expressed in CAFs (Figure 3G).CAFs also influenced the drug resistance of tumors,and CXCR4 expression predicted patient outcome and recurrence patterns after hepatic resection for colorectal cancer with liver metastases.CXCL12can mediate drug resistance by combining with CXCR4 that is expressed in cancer cells(27).In addition,FAP+CAF can mediate immune suppression byCXCL12(28).
CRC-related pathways are enriched in tumor-derived B cells
In our study,we detected 1,100 B lymphocyte cells.B cells are the most prevalent type of stromal cells (Figure 4A).Clustering revealed five clusters,including two clusters(clusters 4 and 5;REG3A+andMS4A1+,respectively) that were mostly tumor enriched,whereas the other three clusters (cluster 1,IGHM+;cluster 2,IGLL5+and cluster 3,IGHGP+,respectively) were composed of both tumor and non-malignant cells (Figure 4B).Moreover,clusters 1,2 and 3 showed plasma properties and were not grouped into distinct clusters. Although all cells expressed immunoglobulin A,tumor-derived cells showed higher levels of IgM expression,while non-malignant-derived cells showed a higher IgA expression.Cluster 4 significantly expressed many innate immunity-related genes,such asREG3A,PRSS2,ITLN2andLYZ,but had a negative CD5 expression.Therefore,these cells were identified as B1 cell-like cells.Cluster 5 showed a high expression ofMS4A1,LTBandHLA-DRB1,which were characteristics of follicular B cells (Figure 4C).
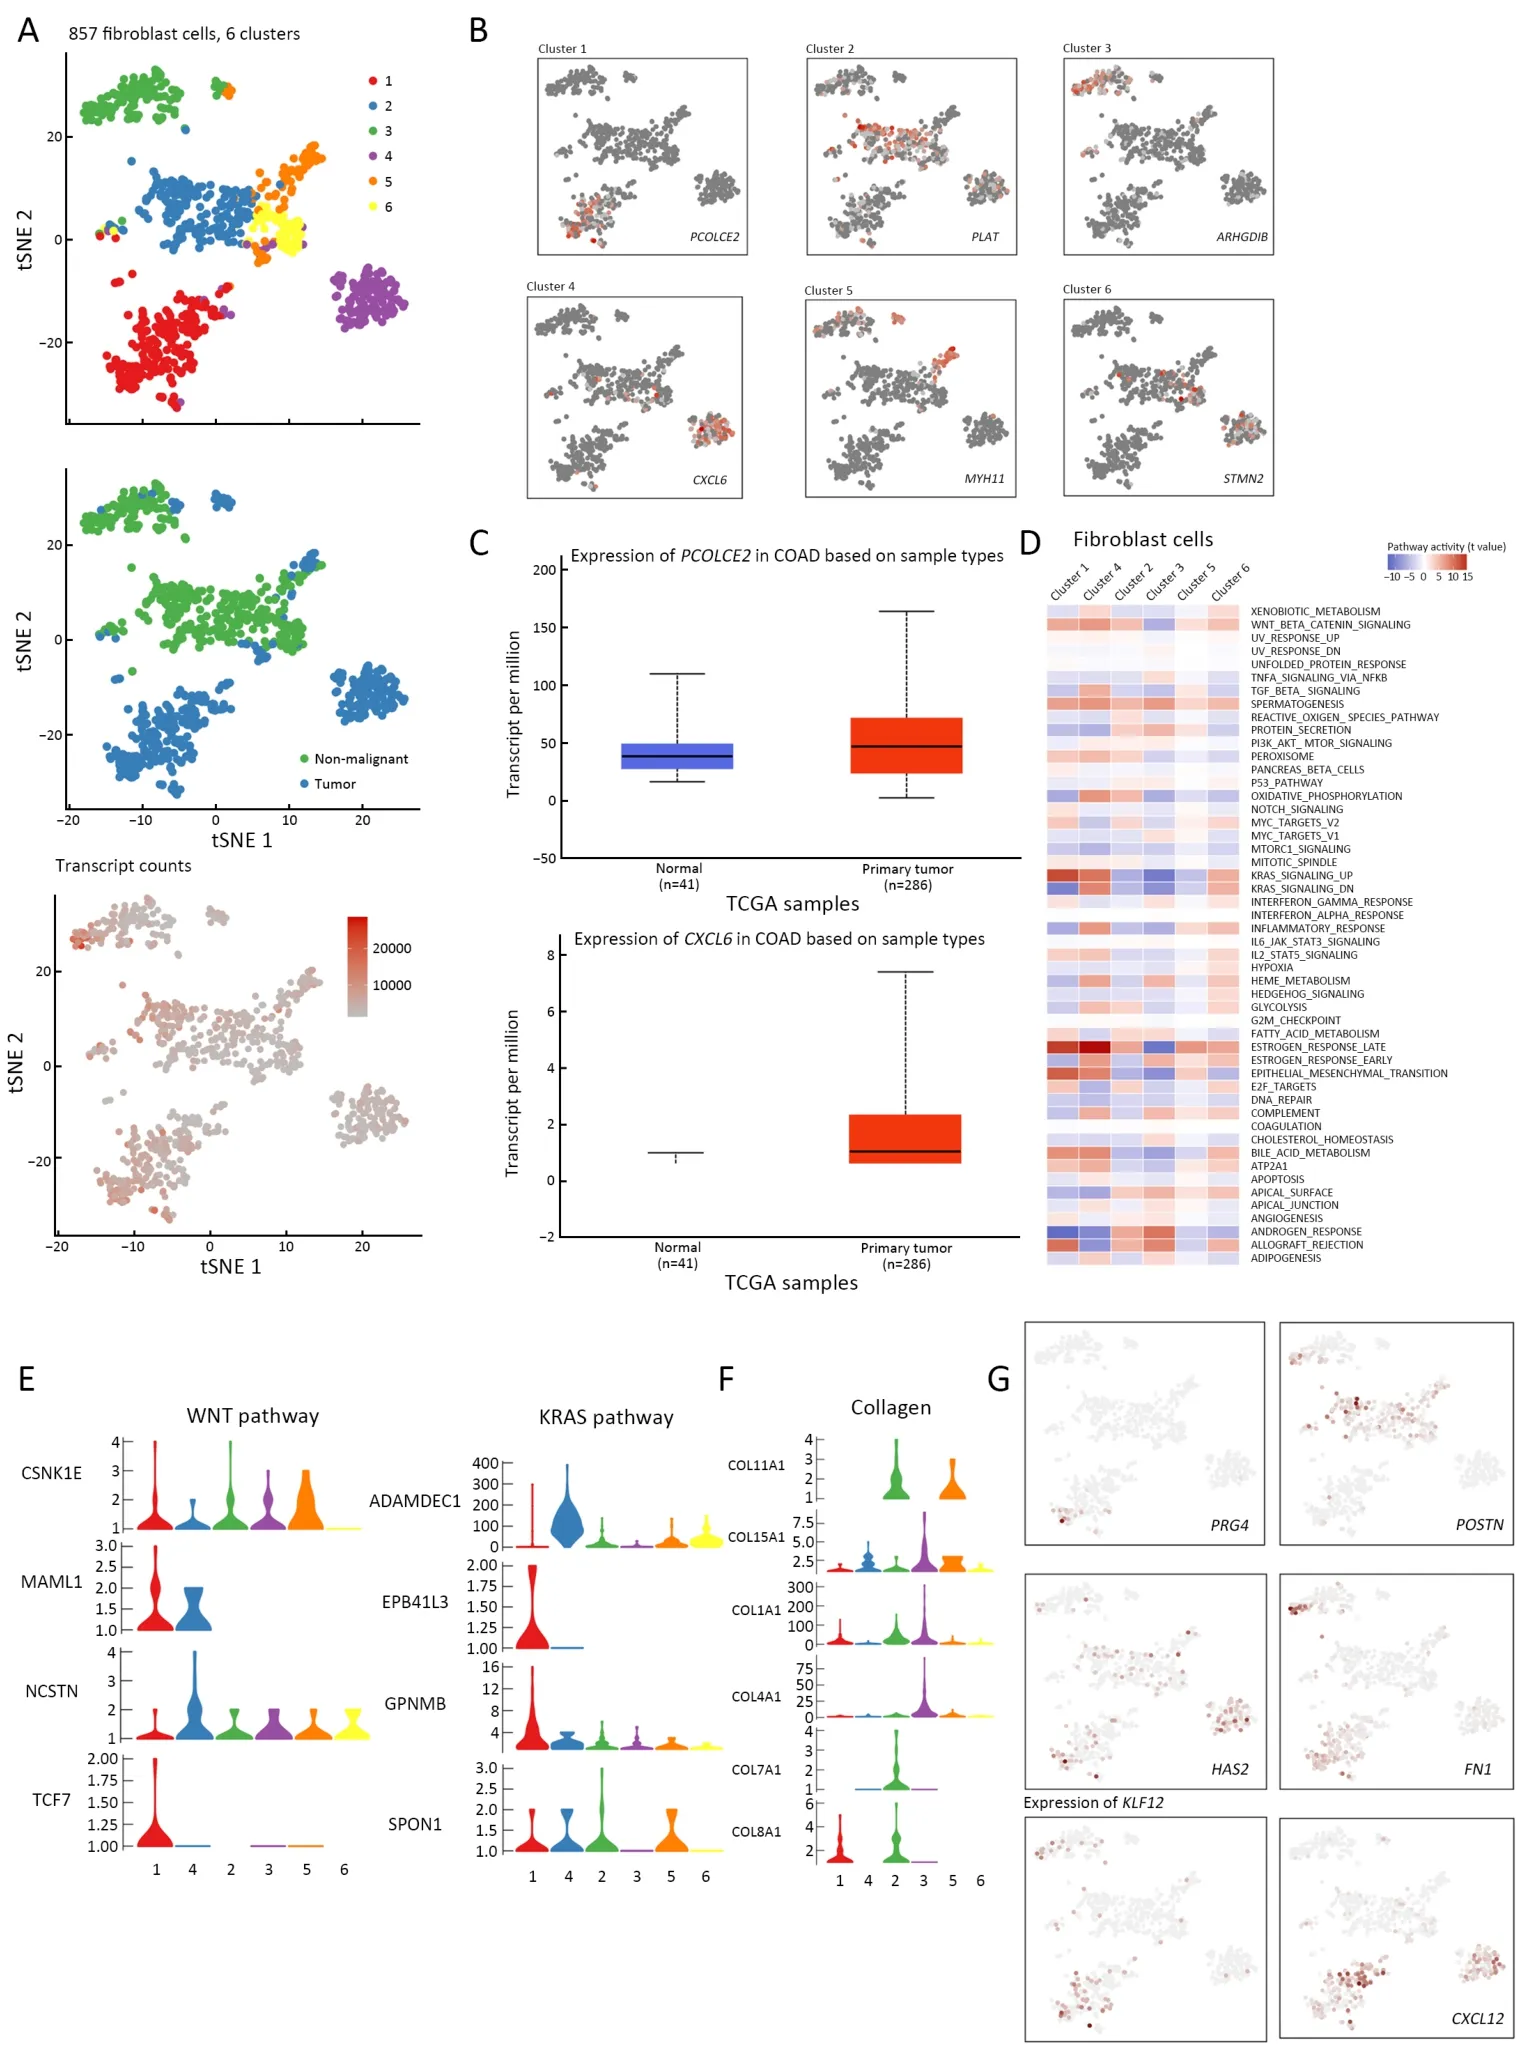
Figure 3 CAF plays various roles in tumorigenesis.(A) tSNE plot of 857 fibroblast cells (top to bottom),color-coded by their associated cluster,the sample type of origin,and the number of transcripts detected in each cell;(B) tSNE plot color-coded for expression (gray to red)of marker genes (cluster 1,PCOLCE2+;cluster 2,PLAT+;cluster 3,ARHGDIB+;cluster 4,CXCL6+;cluster 5,MYH11+;cluster 6;STMN2+);(C) CAFs marker genes,PCOLCE2 and CXCL6 were confirmed to be significantly up-regulated in tumor tissues,as confirmed in bulk RNA-seq data from TCGA;(D) Differences in pathway activities scored per cell by GSVA among the clusters.Clusters 1 and 4 were enriched in Wnt and KRAS signaling,which have a close relationship with tumor proliferation;(E) Violin plots show the expression distribution of selected genes involved in Wnt and KRAS pathways;(F) Different fibroblast clusters expressed different kinds of collagens;(G) The involved marker genes (FN1,HAS2,CXCL12,POSTN,PRG4),and transcription factor KLF12 and its target genes,corresponding to the degree of expression.tSNE,t-distributed stochastic neighbor embedding;CAF,cancer associated fibroblast;TCGA,The Cancer Genome Atlas;GSVA,gene set variation analysis;COAD,colon adenocarcinoma.

Figure 4 CRC-related pathways are enriched in tumor-derived B cells.(A) tSNE plot of 1,100 B cells (top to bottom),color-coded by their associated cluster,the sample type of origin,and the number of transcripts detected in each cell;(B) tSNE plot color-coded for expression(gray to red) of marker genes (cluster 1,IGHM+;cluster 2,IGLL5+;cluster 3,IGHGP+;cluster 4,REG3A+ and cluster 5,MS4A1+);(C)Exhibition of the marker genes (REG3A,PRSS2,ITLN2,HLA-DRB1,MS4A1,LTB) corresponding to the degree of expression;(D)Differences in pathway activities scored per cell by GSVA among the clusters.Pathway analyses showed that peroxisome signaling was highly expressed in tumor cells.CRC,colorectal cancer;tSNE,t-distributed stochastic neighbor embedding;GSVA,gene set variation analysis.
Pathway analyses showed that peroxisome signaling was highly expressed in tumor cells (Figure 4D).Moreover,peroxisome signaling was closely related to CRC risk (29)and was positively correlated with lymph node metastasis and poor prognosis of CRC (30).The results also showed that the oxidative phosphorylation pathway was enriched in non-malignant-derived cells,which might be attributed to the impact of colitis.SCENIC analysis failed to identify differences between non-malignant tissue-derived and tumor-derived plasma cells (Supplementary Figure S3).In addition,no differences were observed in transcript numbers in tumor-associatedvs.non-malignant tissueassociated plasma cells,however,the plasma cells showed a higher transcription trend than clusters 4 and 5 (Figure 4A).
Different derived myeloid cells show diverse expressing properties
The 362 myeloid cells clustered into four subsets,which were not completely separated (Figure 5A).One cluster corresponded to macrophages (cluster 1,CAPG+),another cluster to monocytes (cluster 2,CXCL2+).There was also a dendritic cell cluster (cluster 3,IDO1+) and a granulocyte cluster (cluster 4,CCL20+) (Figure 5B).Dendritic cells and granulocytes were typically more abundant in tumors than in non-malignant tissues.In contrast,macrophages were more abundant in non-malignant tissues.In both tissues,monocytes were detected at similar numbers.
The cell numbers of macrophages and monocytes displayed extensive heterogeneity in tumors compared with those in non-malignant tissues,however,SCENIC analysis did not show significance among different derived cells(Supplementary Figure S4).Furthermore,the pathways of the differently derived cells were analyzed and revealed a tumor-associated increase in tumorigenesis,cell proliferation,and low-oxygen metabolism pathways (that is,pathways associated with tumor necrosis factor α signaling,KRAS signaling and hypoxia).Non-malignant tissue-derived preferred oxidative phosphorylation and biomass production pathways (pathways associated with phosphorylation and protein secretion) (Figure 5C).
Several typical species of T cells identified in multiple analysis
With 318 cells detected,T cells were mainly divided into three clusters,and were designated as naive T cells (cluster 1,YPEL5+),cytotoxic T cells (cluster 2,GZMA+),and natural killer T cells (cluster 3,PIGR+) (Figure 6A,B).In cluster 1,the significantly expressed genes,includingYPEL5andGPR18,were closely related to proliferation and cell differentiation (31).Pathway analysis showed that many proliferation-and differentiation-related pathways,such as Myc targets,G2M checkpoints and E2F targets,were highly expressed in cluster 1 (Figure 6C).SCENIC analysis also showed that T cell-specific differentiation-related transform factor ELF-1 was significantly up-regulated(Figure 6D,E).In cluster 2,we found that cytotoxic T cellspecific genes,such asGZMAandGNLY,were highly expressed.Additionally,the glycolysis pathway was most highly expressed in cluster 2 among the three clusters,and a related gene,PKM,was also highly expressed (32).Furthermore,in cluster 2,a small number of populations of cells were detected expressing higher levels of the immune checkpoint molecule HAVCR,which acts in the tolerance and exhaustion of T cells (33) and is currently targeted in clinical trials of immunotherapy for cancers (34).At the meantime,this subtype of cells showed high expression of MKI67,which encoded proliferation-related proteins (35),and the notable transcription numbers also reflected their high proliferative activity (Figure 6A,B).
Heterogeneity of epithelial cells was demonstrated
In total,1,912 epithelial cells were characterized and divided into six clusters;two tumor-derived clusters (cluster 1,ENPEP+;cluster 3,OLFM4+,respectively),and four clusters were almost exclusively from non-malignant tissues(cluster 2,PI3+;cluster 4,MUC1+;cluster 5CA4+;cluster 6,HMGB2+,respectively) (Figure 7A,B).Pathway analysis showed significant differences between tumor-and nonmalignant-derived tissues (Figure 7C).In particularly,cluster 1 typically exhibited malignant properties.High proliferation- and embryonic developmental processrelated pathways were highly expressed (Wnt signaling,Myc targets and EMT signaling) (36),and lesions repairassociated pathways,including the DNA repair pathway,were down-regulated (37) (Figure 7D).
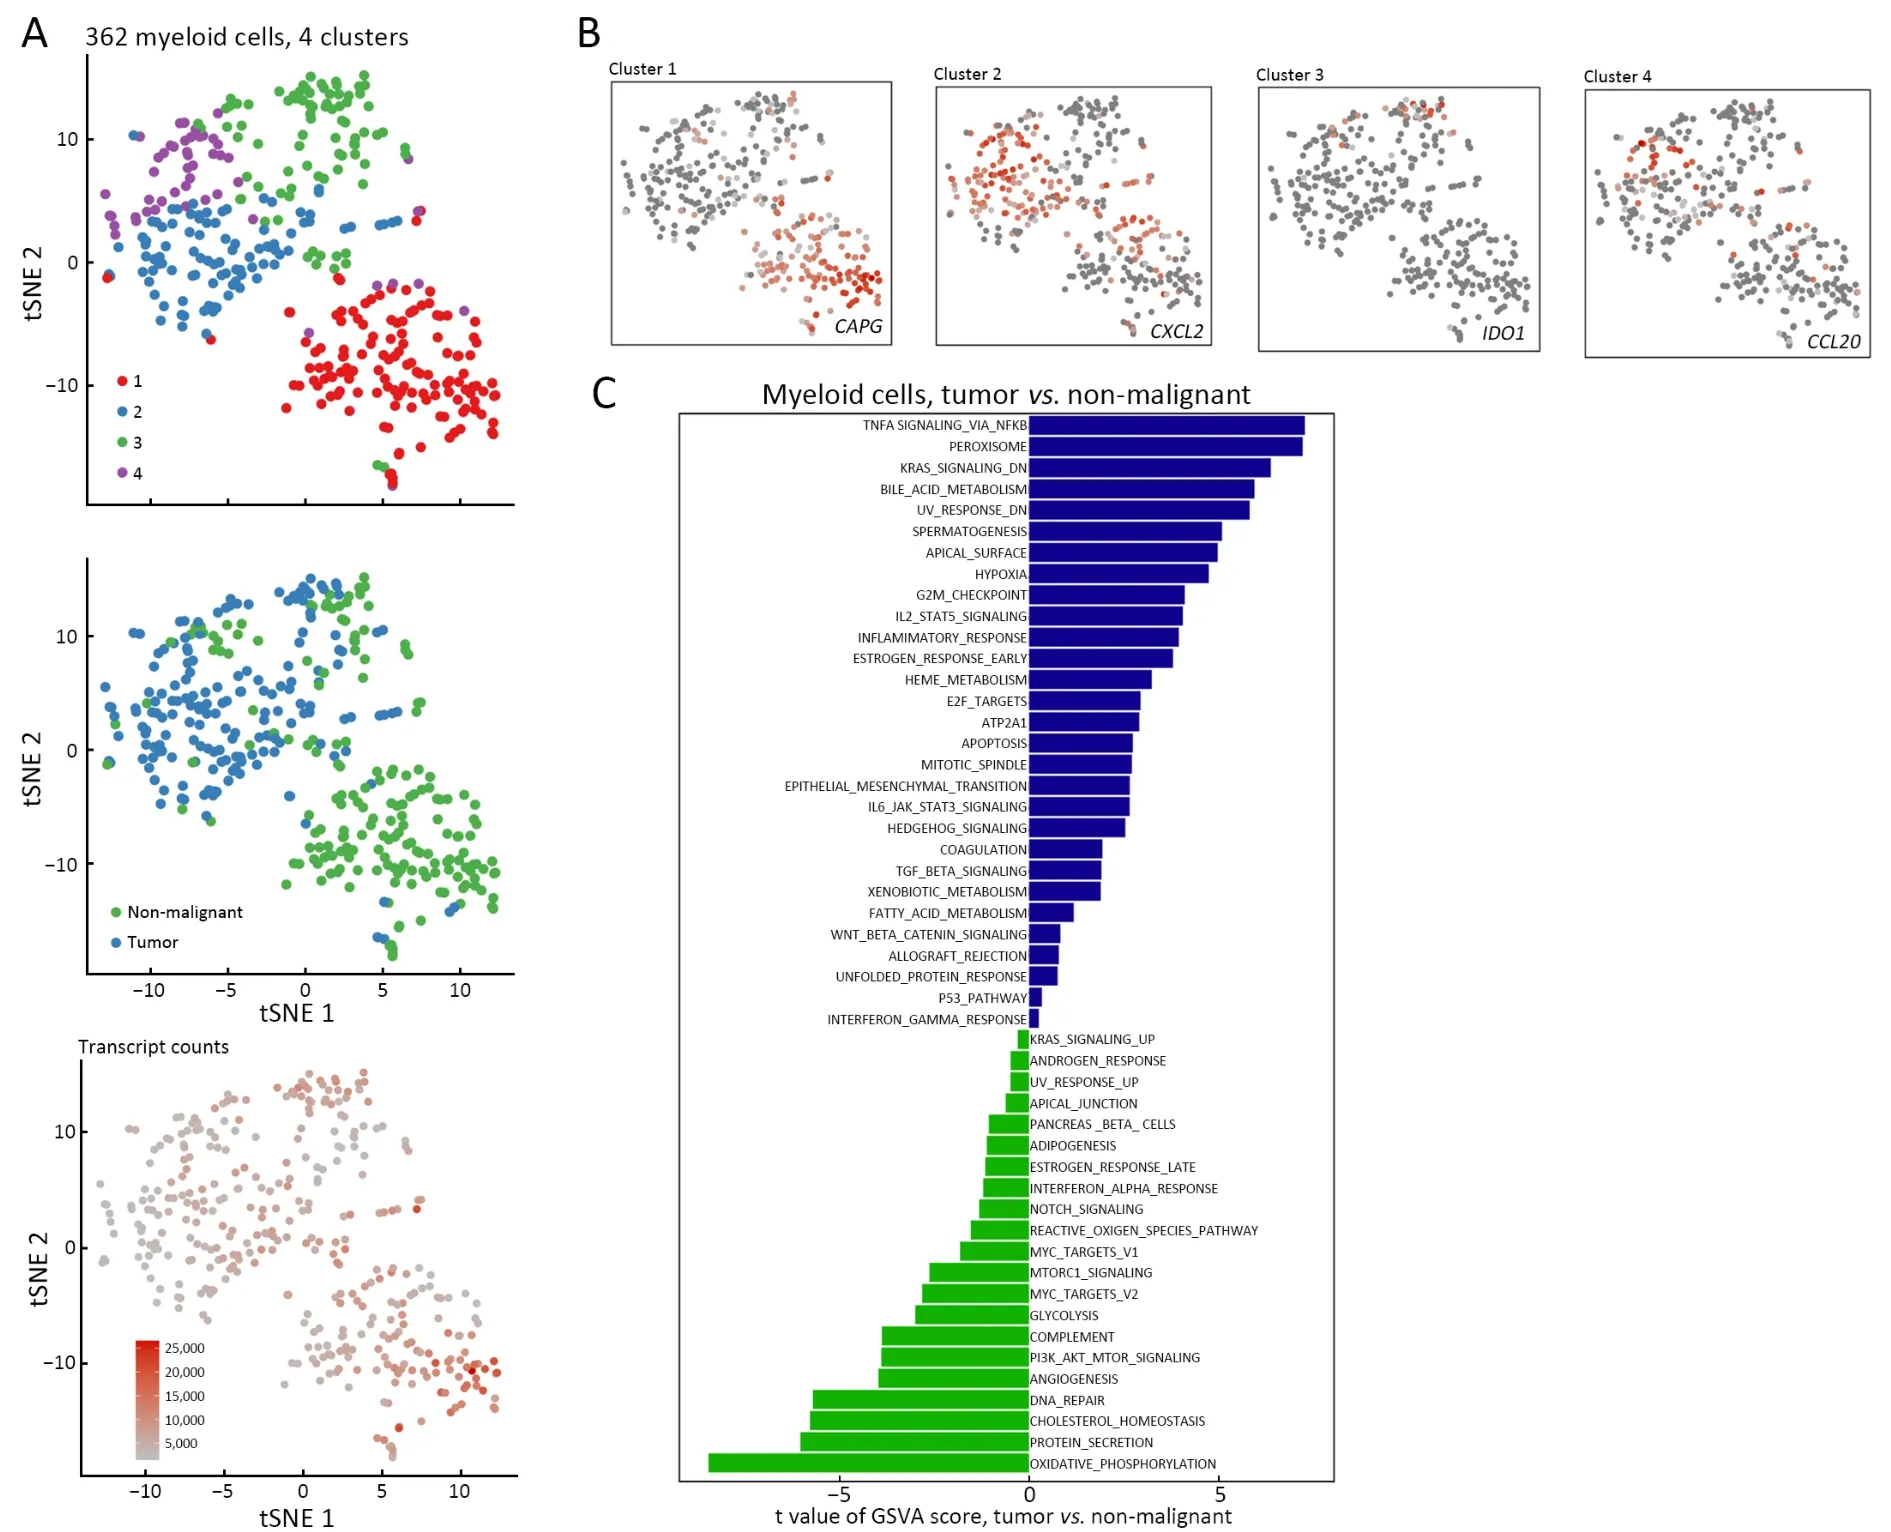
Figure 5 Different derived myeloid cells showed diverse expression properties.(A) tSNE plot of 362 myeloid cells (top to bottom),colorcoded by their associated cluster,the sample type of origin,and the number of transcripts detected in each cell;(B) tSNE plot color-coded for expression (gray to red) of marker genes (cluster 1,CAPG+;cluster 2,CXCL2+;cluster 3,IDO1+ and cluster 4,CCL20+);(C)Differences in pathway activities scored per cell by GSVA among the clusters.Tumor-associated cells increased in tumorigenesis,cell proliferation and low-oxygen metabolism pathway (that is,pathways associated with TNFα signaling,KRAS signaling and hypoxia),while the non-malignant tissue-derived cells preferred the oxidative phosphorylation and biomass production pathways (pathways associated with phosphorylation and protein secretion).tSNE,t-distributed stochastic neighbor embedding;GSVA,gene set variation analysis;TNF,tumor necrosis factor.
Through SCENIC analysis,we demonstrated that the transcription factors CDX2 and STAT3 were significantly up-regulated in cluster 1,and showed almost no expression in other clusters except for cluster 3 (Supplementary Figure S5).CDX2 inhibits aggressive phenotypes of colon cancer cells bothin vitroandin vivo(38) and might be a prognostic marker related to the benefit of adjuvant chemotherapy(39).STAT3 is essential for the transduction of tumorpromoting signals of the IL-6/STAT3 pathway,which is highly activated in CAC (40).Collectively,different clusters exhibited obviously diverse properties even in the same tissues (Figure 7E).
Evolutionary trajectory of disease development and internal variation in crucial genes

Figure 6 Several typical species of T cells are identified in multiple analysis.(A) tSNE plot of 318 T cells (top to bottom),color-coded by their associated cluster,the sample type of origin,and the number of transcripts detected in each cell;(B) tSNE plot color-coded for expression (gray to red) of marker genes,naive T cells (cluster 1,YPEL5+),cytotoxic T cells (cluster 2,GZMA+) and natural killer and natural killer T cells (cluster 3,PIGR+);(C) Differences in pathway activities scored per cell by GSVA among the clusters.Pathway analysis showed that many proliferation-and differentiation-related pathways,such as Myc targets,G2M checkpoints and E2F targets,were highly expressed in cluster 1;(D,E) SCENIC analysis of transcription factors involved among the clusters,and SCENIC analysis showed that the T cell-specific differentiation-related transform factor ELF-1 was significantly up-regulated.tSNE,t-distributed stochastic neighbor embedding.
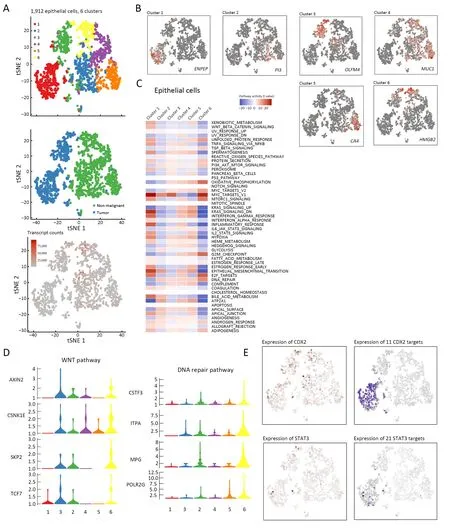
Figure 7 Heterogeneity of epithelial cells was demonstrated.(A) tSNE plot of 1,912 epithelial cells (top to bottom),color-coded by their associated cluster,the sample type of origin,a+nd the number of transcripts detected in each cell;(B) tSNE plot color-coded for expression(gray to red) of marker genes (cluster 1,ENPEP+;cluster 2,PI3+;cluster 3,OLFM4+;cluster 4,MUC1+;cluster 5,CA4+;cluster 6,HMGB2+);(C) Differences in pathway activities scored per cell by GSVA among the clusters.Pathway analysis showed significant differences between the tumor-and non-malignant-derived tissues.In particularly,cluster 1 and 3 existed typically exhibited malignant properties;(D) Violin plots show the expression distribution of selected genes involved in the Wnt and DNA repair pathways.In cluster 1 and 3,high proliferation-and embryonic developmental process-related pathways were highly expressed (Wnt signaling,Myc targets and EMT signaling),and lesions repair-associated pathways,such as the DNA repair pathway,were down-regulated;(E) Exhibition of the involved transcription factors (CDX2,STAT3) and their target genes,corresponding to the degree of expression.tSNE,t-distributed stochastic neighbor embedding;EMT,epithelial-mesenchymal transition.
Complete transcriptome data for many epithelial cells allowed us to gain insights into the functional states of and relationship among these cells.Carcinogenesis follows the principles of Darwinian evolution,whereby somatic cells acquire genomic alterations that provide them with a survival and/or growth advantage (41).Therefore,the dynamic information of gene expressions could be used to track the progress of the disease.Transcriptional similaritybased pseudotime analysis was applied (42) to order epithelial cells and indicated their developmental trajectories (Figure 8A).All cells from each cluster aggregated into nine states based on expression similarities,and different states formed a trajectory by pseudotime analysis that began with states 4,7 and 8 (non-malignantderived cells),followed by states 2,3 and 5 (mixed derived cells),and ended with states 1,6 and 9 (tumor-derived cells)(Figure 8A,B).Following this trajectory,the differentially expressed genes were identified,and these genes might play crucial roles in the evolution from colitis to cancer.Therefore,in the subsequent analysis,we focused on the top three differentially expressed genes,CD74,CLCA1andDPEP1(Figure 8C).Different degrees of IHC staining between normal and tumor tissues for CD74,CLCA1 and DPEP1 from the public data website of The Human Protein Atlas confirmed the change in expression in these genes along with disease progression (Figure 8D).
CD74,cluster of differentiation 74,also known as HLADR antigen-associated invariant chain and encoded by theCD74gene,is a polypeptide that is involved in the formation and transport of MHC class II protein,which is found in several types of cancer cells (43,44).In CRC,stimulation of CD74 by MIF induces a signaling cascade,leading to up-regulation of Bcl-2,thereby resulting in a significantly increased survival of patients with colon cancer.The MIF/CD74 axis is a target for novel therapies(45).Taken together,our data demonstrated that CD74 was down-regulated as tumorigenesis progressed,which was consistent with the findings presented in previous reports.TCGA data showed that CD74 expression was significantly high in normal tissues (P<0.05) (Figure 8D,E),and patients with high CD74 expression had a better survival (P<0.01) (Figure 8F).
CLCA1,calcium-activated chloride channel regulator 1,is a protein that is encoded by theCLCA1gene in humans and plays many roles,including the regulation of mucus production and secretion in goblet cells (46).CLCA1 regulates tissue inflammation in the innate immune response (47) and tumor suppression in CRC (48),and can suppress CRC aggressiveness via inhibition of the Wnt/βcatenin signaling pathway.Low expression of CLCA1 predicts a poor prognosis in CRC (49).Thus,our data demonstrated that CLCA1 was first up-regulated,then down-regulated during the late period of the pseudotime analysis.TCGA data indicated no significance for the expression of CLCA1 between tumor and normal tissues(P=0.07) (Figure 8D,E),and no relevance between CLCA1 expression and patient prognosis (P=0.11) (Figure 8F).
DPEP1,dipeptidase 1,encoded by theDPEP1gene,hydrolyzes a wide range of dipeptides and plays a role in many biological processes,including the metabolism of glutathione and β-lactam hydrolysis in the kidney (50).In CRC,the expression of DPEP1 has been shown to affect cancer cell invasiveness in early stage cases,and can act as a candidate tumor-specific molecular marker for the detection of rare disseminated colorectal tumor cells in peripheral venous blood and intraperitoneal saline lavage samples (51).Our data demonstrated thatDPEP1was upregulated as tumorigenesis progressed,which was consistent with the data presented in previous reports.TCGA data showed that the expression of DPEP1 was significantly higher in tumor tissues (P<0.05) (Figure 8D,E),however,no relevance was observed between DPEP1 expression and patient prognosis (P=0.09) (Figure 8F).
Discussion
In previous studies,cell identity was defined by various methods,such as morphological appearance,tissue context,and marker gene expression.As mRNA encodes cellular function and phenotype,single-cell transcriptomics could precisely refine the cellular identity based on comprehensive and quantitative readout of mRNA (52).Thus,scRNA-seq technology has attracted significant attention since its inception,and a large number of applied study results have been published recently (53).In the context of human cancer,scRNA-seq was used to reveal the intra-tumor heterogeneity and transcriptional trajectories of malignant transformation (54).
In this study,4,777 single-cell transcriptomes of human colon tumorous tissues and non-malignant tissues from UC-associated colon cancer were analyzed.Furthermore,the composition of cancer-associated stromal cells was defined,the different subgroups of tumor cells were analyzed,and the notable pathways and transcription factors involved in the disease were described.Many of the tumor-derived cell types identified by a scRNA-seq approach,including B cells,T cells,endothelial cells,myeloid cells,fibroblasts,and epithelial cells (summarized inFigure 9),presented an altered gene expression profile with pro-tumoral properties compared with non-malignant cells.Of note,the evolutionary trajectory of tumor development was graphed,and pseudotime analysis revealed the cellular composition of CAC and its developmental trajectory.The TME might play a crucial role in the evolutionary process from a UC to a CAC.Moreover,we identified the top three differentially expressed genes that played a role in disease progression,CD74,CLCA1andDPEP1.These results may represent a promising strategy that identifies novel potential therapeutic targets in the evolution from UC to CAC and may prevent the development of CRC.
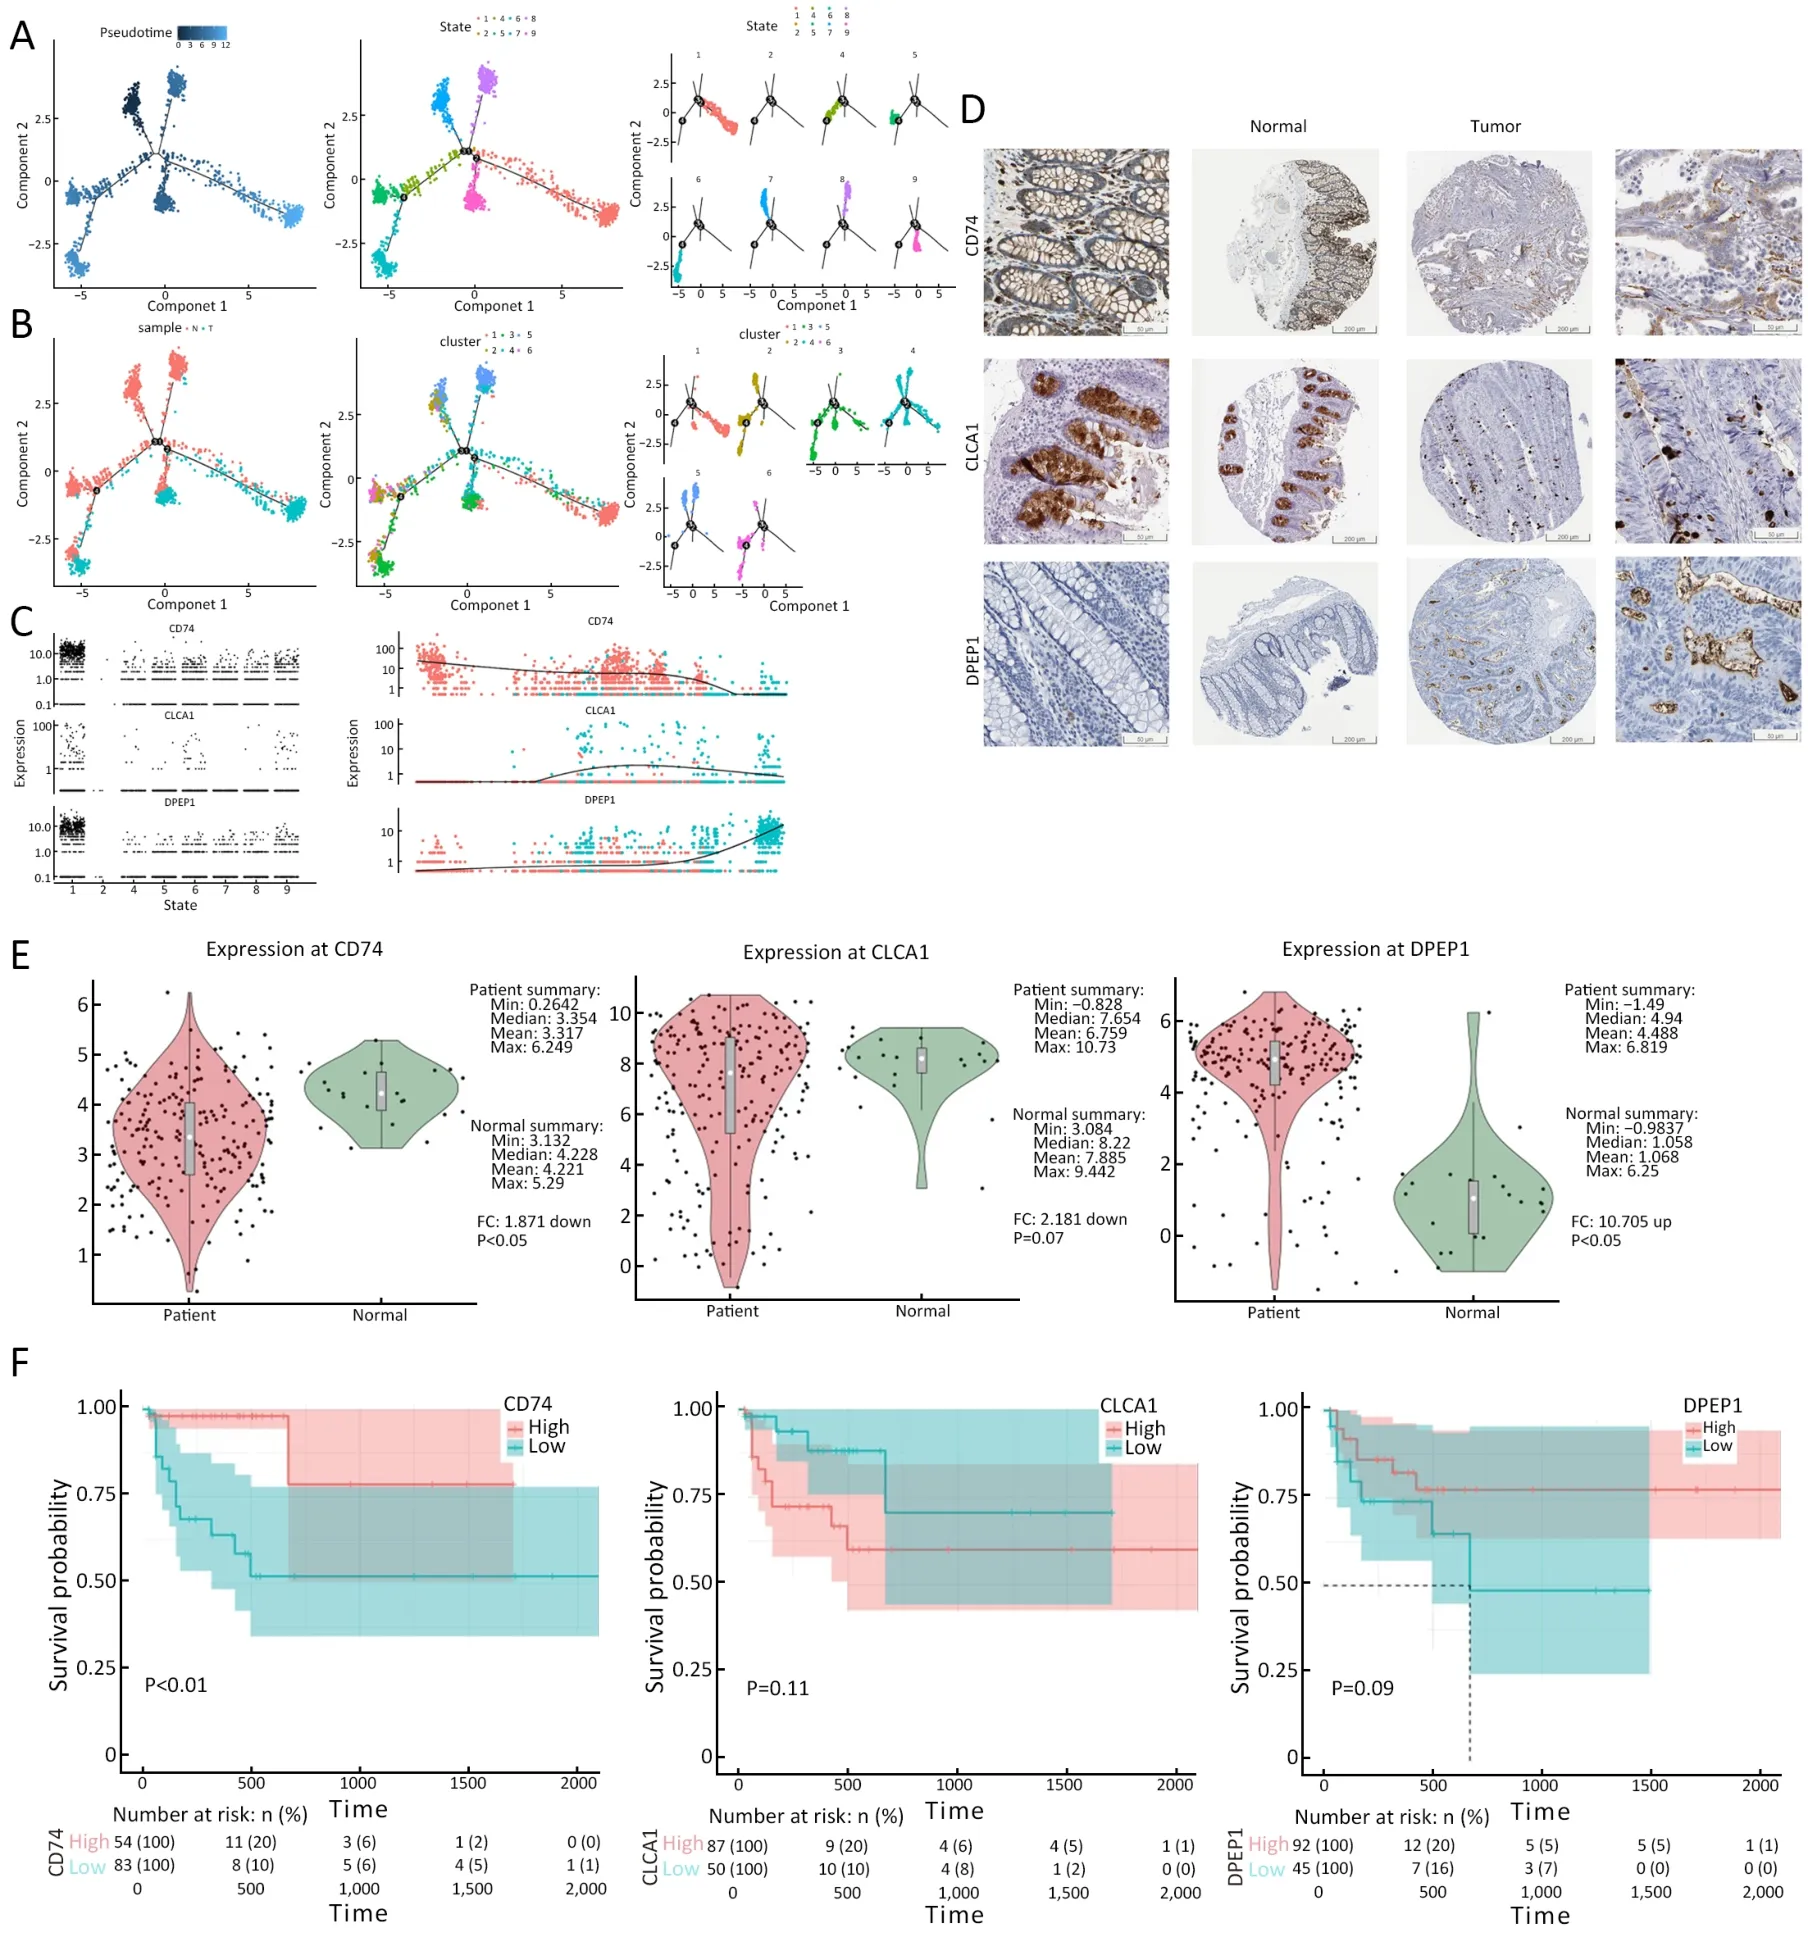
Figure 8 Evolutionary trajectory of disease development and internal variation in crucial genes.(A) Transcriptional similarity-based pseudotime analysis was used to order epithelial cells and indicated their developmental trajectories.All the cells from each cluster aggregated into nine states based on pseudotime analysis;(B) Distribution of the cells originally from the tumor and non-malignant tissues into six clusters (left to right);(C) Following this trajectory,the differentially expressed genes were identified,and these genes might play crucial roles in the evolution from colitis to cancer.Top 3 differential expressed genes (CD74,CLCA1 and DPEP1) were showed along with evolutionary trajectory;(D) Different degrees of immunohistochemical staining between normal and tumor tissues for CD74,CLCA1 and DPEP1 from the public data website of The Human Protein Atlas;(E) Different expression of genes (CD74,CLCA1 and DPEP1) in tumor and normal tissues from TCGA.TCGA data showed that the expression of CD74 was significantly high in normal tissues (P<0.05),the expression of DPEP1 was significantly high in tumor tissues (P<0.05),but there was no significance for the expression of CLCA1 between tumor and normal tissues (P=0.07);(F) Relationships between gene expression levels and survival time.Patients with high CD74 expression had better survival (P<0.01),but there were no relevance between CLCA1 or DPEP1 expression and the prognosis of patients (CLCA1,P=0.11;DPEP1,P=0.09).

Figure 9 Intra-tumor landscape and statement of TME of UC-associated colon cancer.(Red words mean the cluster of tumor cells,while blue words represent the cluster of non-malignant tissues and others belong to the mixed both tumorous-and non-malignant tissue cells).TME,tumor micro-environment;UC,ulcerative colitis.
Changes in gene expression in the tumorigenesis trajectory suggest directions for the design of therapies(55).For instance,CD74 is abundant in non-malignant cells,but is down-regulated in tumor endothelial cells.In addition,tumor-derived epithelial cells up-regulate Wnt signaling,but down-regulate DNA repair pathways.Likewise,SCENIC analysis in fibroblasts predicts transcription factors responsible for the transformation toward CAFs,and patients might acquire therapeutic benefits when these conversion processes are blocked.Distinctive features of tumor cells may represent vulnerabilities and provide potential entry points for the design of novel therapies.
To our knowledge,a study which focused on the spatiotemporal evolution from UC to CAC was published(56).In this study,the authors dissected the evolutionary history of CAC using multi-region exome sequencing,but did not perform scRNA-seq and the landscape of cell heterogeneity and evolutionary trajectory in UC-associated CRC revealed by scRNA-seq was absent.It is acknowledged that this is the first study depicting the cell landscape of UC-associated colon cancer at the single-cell transcriptome level,which describes the intra-tumoral heterogeneity mainly from three different viewpoints:gene expression,pathway enrichment,and transcription factor analysis.This provides a more accurate perspective for analyzing the evolutionary progress of UC-associated colon cancer when compared to an average calculation (57).
However,there are also some limitations.Firstly,the results of the study have been determined based on the evolutionary process from UC to CAC in a single patient,which obviously lacks more patients with CAC to compare the obtained results.Secondly,the methods used to classify the cell types are based on distinct and highly-expressed genes,coupled with previous reports.Therefore,an authorized or unified standard should be established.Thirdly,the patient was diagnosed with UC-associated colon cancer and samples from an UC-associated tumor and adjacent inflamed tissues were collected to show the intra-tumor landscape via scRNA-seq.However,the cohort of the TCGA database has sporadic CRC patients,which might cause bias for UC-associated colon cancer.Lastly,three genes (CD74,CLCA1andDPEP1) were found to be a potential role in colon cancer disease progression.However,it is obviously limited and biased since there is only one case and no experiments were done to demonstrate their function in the evolutionary process.To show reliable gene panels,the results should be further validated in larger cohorts in the future,which will be helpful to yield more accurate and convincing results.
Conclusions
This study primarily elucidates the composition of TME and developmental trajectory of UC-associated colon cancer. Furthermore,these results may represent a promising strategy that identifies novel potential therapeutic targets in the evolution from UC to CAC.In the future,the researchers should confirm whether the transcriptome of CAC is associated with consensus molecular subtypes of CRC,and determine whether the transcriptome of the tumor cells could be a signature related to UC among more patients.
Acknowledgements
This study was supported by National Key Research and Development Program of China (No.2017YFC1308800)and Industry-University-Research Innovation Fund in Ministry of Education of the People’s Republic of China(No.2018A01013).
Footnote
Conflicts of Interest:The authors have no conflicts of interest to declare.
Supplementary materials
Methods and protocols of single cells
Preparation of single-cell suspensions
Following resection in the operating room,samples of the tumor and adjacent non-malignant colon tissues at maximal distance (>5 cm) (Supplementary Figure S1),which were isolated and saved in Dulbecco’s Modified Eagle Medium (DMEM,Gibco) and transported rapidly to the research facility.On arrival,samples were cut into smaller pieces of less than 1 mm3and rinsed with Hanks’ balanced salt solution (HBSS,ThermoFisher Scientific),and then transferred to 10 mL of digestion medium containing 0.2% collagenase IV (ThermoFisher Scientific) in DMEM.Samples were incubated for 75 min at 37 °C,with manual shaking every 5 min.Next,30 mL of ice-cold HBSS was added and samples were filtered using a 40-μm nylon mesh (ThermoFisher Scientific).Following centrifugation at 120,000 r/min and 4 °C for 3 min,the supernatant was decanted and discarded,and the cell pellet was resuspended in 2 mL of red blood cell lysis buffer and transferred to a 2-mL DNA low-binding tube.Following a 5-min incubation at room temperature,samples were centrifuged (120,000 r/min,4 °C,5 min) using a swing-out rotor.And then resuspended in 2 mL of HBSS and centrifuged (120,000 r/min,4 °C,2 min) using a swing-out rotor.Subsequently,samples were resuspended in 2 mL of DMEM containing 10% fetal bovine serum (Gibco).
Droplet-based single-cell RNA sequencing (scRNA-seq)
Single-cell suspensions were converted to barcoded scRNA-seq libraries by using the Chromium Single Cell 3’ Library,Gel Bead &Multiplex Kit and Chip Kit (10× Genomics),aiming for an estimated 5,000 cells per library and following the manufacturer’s instructions.Samples are processed using kits pertaining to either the V1 or V2 barcoding chemistry from 10x Genomics.Single samples are always processed in a single well of a polymerase chain reaction (PCR) plate,allowing all cells from a sample to be treated with the same master mix and in the same reaction vessel.All samples (non-malignant and tumor)were processed in parallel on the same thermal cycler.Libraries were sequenced on an Illumina HiSeq4000 and mapped to the human genome (build hg19) using CellRanger (10× Genomics).
Single-cell gene expression quantification and determination of major cell types

Figure S1 A tumor tissue sample and a non-malignant colon tissue sample (>5 cm away from the neoplastic foci) were obtained following surgical resection.N,non-malignant colon tissue;T,tumor tissue.
Raw gene expression matrices generated per sample using CellRanger (Version 2.0.0;https://support.10xgenomics.com/single-cell-gene-expression/software/pipelines) were combined in R (Version 3.3.2;https://www.r-project.org/),and converted to a Seurat object using the Seurat R package (Version 1.4.0.7;https://cran.r-project.org/web/packages/Seurat/index.html).From this,all cells were excluded which had either fewer than 201 unique molecular identifiers (UMIs),over 6,000 or under 101 expressed genes,or over 10% UMIs derived from the mitochondrial genome.From the remaining cells,gene expression matrices were normalized to total cellular read count and to mitochondrial read count using linear regression as implemented in Seurat’s Regress Out function.As a result,none of the principle components subsequently identified were correlated with transcript count.From the remaining cells,variably expressed genes were selected as having a normalized expression between 0.125 and 3 and a quantile-normalized variance exceeding 0.5.To reduce the dimensionality of this data set,the resulting variably expressed genes were summarized by principle component analysis (PCA),and the first six principle components were further summarized using t-distributed stochastic neighbor embedding (tSNE) dimensionality reduction using the default settings of the Run tSNE function.Cell clusters in the resulting two-dimensional representation were annotated to known biological cell types using canonical marker genes.
Subclustering of major cell types
To identify subclusters within these six cell types,we reanalyzed cells belonging to each of these six cell types separately.Specifically,we applied dimensionality reduction using principal component analysis (PCA) in each cell type on variably expressed genes as described above.To identify which principle components were informative,we applied Horn’s parallel analysis for PCA as implemented in the R paran package (Version 1.5.1;https://cran.r-project.org/web/packages/paran/index.html),selecting those principle components having eigenvalues that exceed the eigenvalues generated using ten random permutations by >50%.Using the graph-based clustering approach implemented in the Find Clusters function of the Seurat package,with a conservative resolution of 0.5 and otherwise default parameters,each cell type was reclustered by its principle components.Notably,subclustering was robust to alterations in the number of principle components,in the resolution or in the K parameter.Moreover,few of the subclusters identified contained many cells wherein less than 300 genes were detected,indicating that increasing the threshold of 100 genes would not affect our results.This yielded 28 subclusters in total,as listed inSupplementary Table S1.For visualization purposes,these informative principle components were converted into tSNE plots as above.
Identification of marker genes
To identify marker genes for each of these 28 subclusters within these six cell types,we contrasted cells from that subcluster to all other cells of that subcluster using the Seurat Find Markers function.Marker genes were required to have an average expression in that subcluster that was >2.5-fold higher than the average expression in the other subclusters from that cell type,and a detectable expression in >15% of all cells from that subcluster.Additionally,marker genes were required to have the highest mean expression in that subcluster.
Single-cell regulatory network inference and clustering (SCENIC) analysis
SCENIC analysis was run as previously described on the 4,777 cells that remained after filtering,using the 20-thousand motifs database for RcisTarget and GRNboost (SCENIC Version 0.1.5,which corresponds to RcisTarget 0.99.0 and AUCell 0.99.5;with RcisTarget.hg19.motifDatabases.20k).
Analysis of differential pathway or regulon activities
To assess the differential activities of pathways (GSVA) or regulons (SCENIC) between cell sets (for example,derived from tumor or normal samples,or belonging to different subclusters),we contrasted the activity scores for each cell using a generalized linear model.To avoid inflating signals because of inter individual differences (for example,in the relative frequencies of cells from different patients),we always included the patient of origin as a categorical variable.The results of these linear models were visualized using bar plots or heat maps.For the latter,pathways or regulons that did not show significant changes (Benjamini-Hochberg-corrected P>0.05) in any of the cell sets that were contradictory in one analysis were not visualized.
Statistics and reproducibility
No statistical method was used to predetermine sample sizes.For all experiments,samples from a single patient were processed in parallel,and cells for each sample of one patient were processed for scRNA-seq (10× Genomics) at the same time,but in separate lanes and vials.Box plots were generated using the R base package and default parameters.Hence,the boxes span the interquartile range (IQR;from the 25th to the 75th percentiles),with the centerline corresponding to the median.Lower whiskers represent data minimum or the 25th percentile minus 1.5×IQR,whichever is greater.Upper whiskers represent the data maximum or the 75th percentile plus 1.5×IQR (lower),whichever is lower.Violin plots were generated using the bean plot R package,and the data distribution band width was estimated by kernel density estimation,as per the built-in“nrd0”option.Bar plots indicate the mean ± standard error of the mean and include individual data points.Given the number of data points represented on box and violin plots,we opted not to display each data point,as this would obscure the overall distribution.Comparisons between two groups were performed using unpaired two-tailedt-tests.Oneway analysis of variance (ANOVA) with Tukey’s multiple comparisons tests were used for multiple group comparisons.Linear models were generated when multiple parameters were taken into account.Fitting of Cox proportional hazards regression models was performed using the Cox Proportional Hazards (CoxPH) function in the R survival package(https://cran.r-project.org/web/packages/survival/index.html),with tied death times handled using the Breslow method.All statistical analyses and presentation of data were performed using R (https://www.r-project.org/).

Figure S2 SCENIC analysis of transcription factors involved among the fibroblasts clusters,and showed that KLF12,which promotes CRC growth,was highly expressed in cluster 1.SCENIC,single-cell regulatory network inference and clustering;CRC,colorectal cancer.

Figure S3 SCENIC analysis of transcription factors involved among B cell clusters,and SCENIC analysis failed to identify differences between non-malignant tissue-derived and tumor-derived plasma cells.SCENIC,single-cell regulatory network inference and clustering.
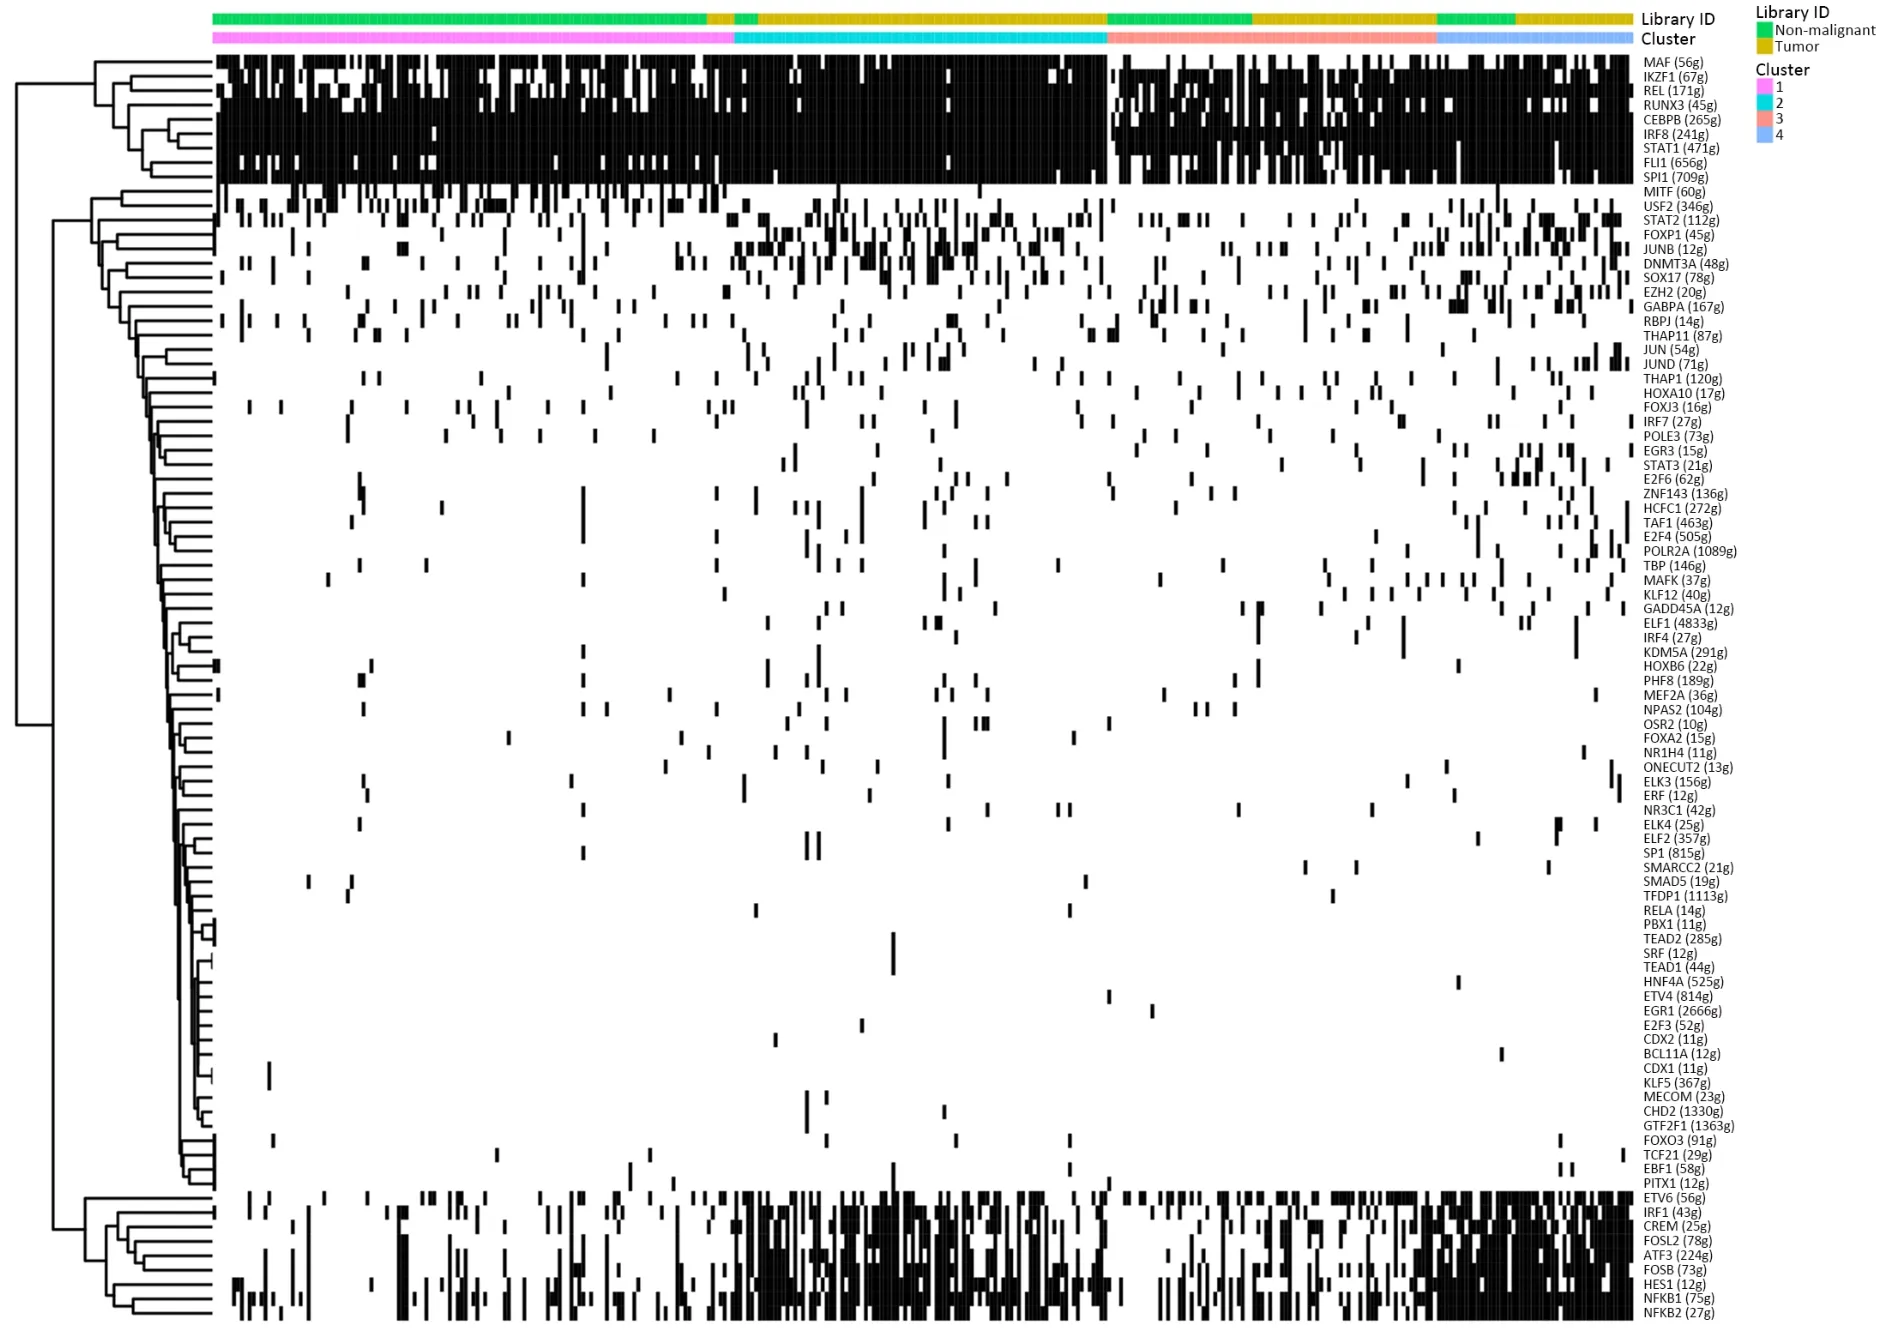
Figure S4 SCENIC analysis of transcription factors involved among myeloid cell clusters.The cell numbers of macrophages and monocytes displayed extensive heterogeneity in tumors compared with those in non-malignant tissues,but SCENIC analysis showed no significance among different derived cells.SCENIC,single-cell regulatory network inference and clustering.
Figure S5 SCENIC analysis of transcription factors involved among the epithelial clusters.The transcription factors CDX2 and STAT3 were significantly up-regulated in cluster 1,but showed almost no expression in other clusters besides cluster 3.SCENIC,single-cell regulatory network inference and clustering.

Table S1 Maker genes for cell types and subclusters
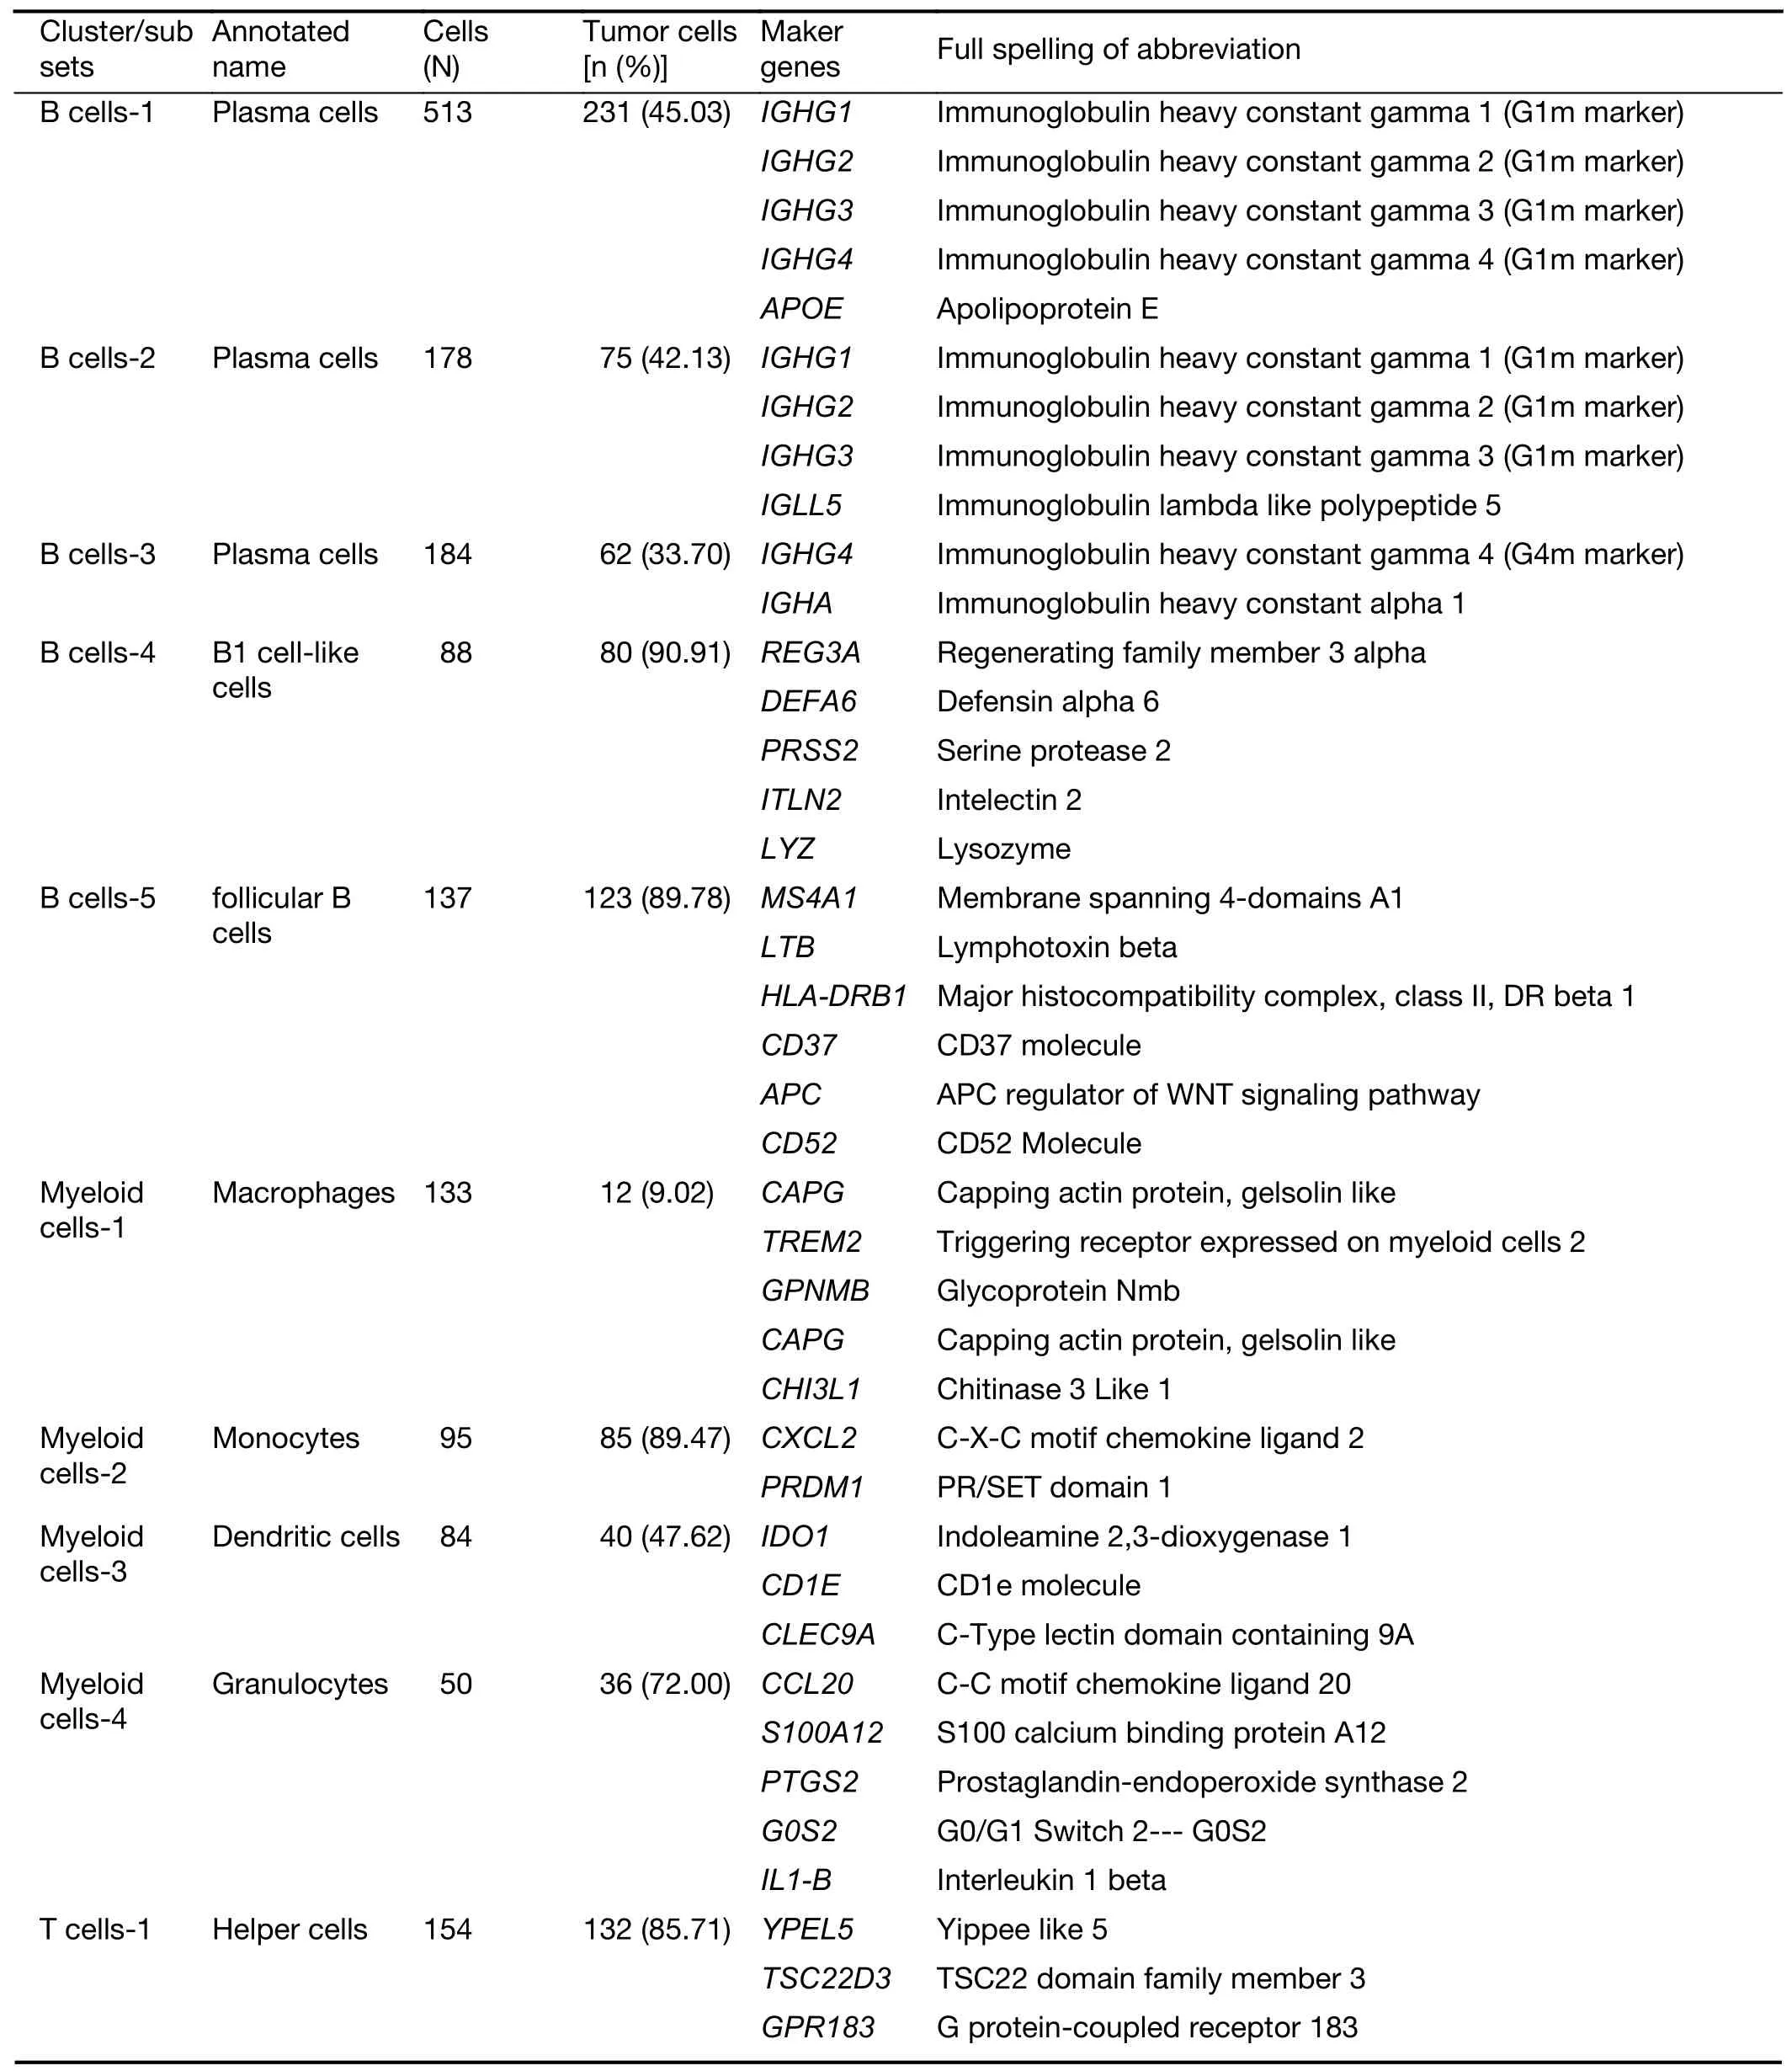
Table S1 (continued)

Table S1 (continued)
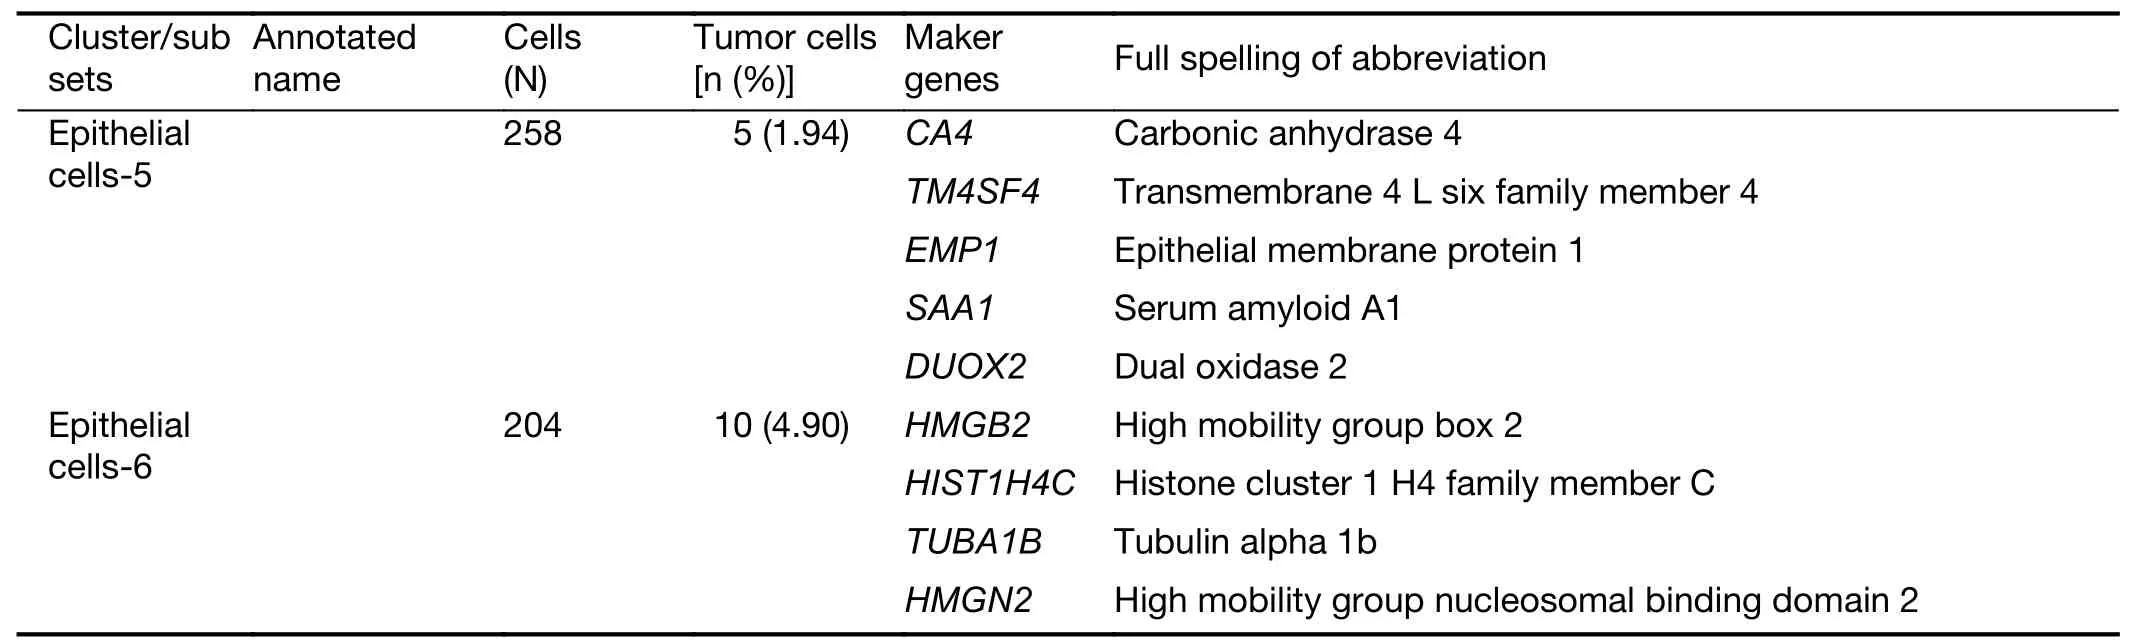
Table S1 (continued)
杂志排行

Chinese Journal of Cancer Research的其它文章
- Combined detection and subclass characteristics analysis of CTCs and CTECs by SE-iFISH in ovarian cancer
- Multicenter phase II study of apatinib single or combination therapy in HER2-negative breast cancer involving chest wall metastasis
- Effect of preoperative nutrition therapy type and duration on short-time outcomes in gastric cancer patient with gastric outlet obstruction
- Novel therapies targeting hypoxia mechanism to treat pancreatic cancer
- Laparoscopic surgery for gastric cancer:Current status and future direction
- Clinical challenges in neoadjuvant immunotherapy for non-small cell lung cancer