Combined detection and subclass characteristics analysis of CTCs and CTECs by SE-iFISH in ovarian cancer
2021-05-19HongyanChengShangWangWenqingLuanXueYeShaDouZhijianTangHonglanZhuPeterPingLinYiLiHengCuiXiaohongChang
Hongyan Cheng,Shang Wang,Wenqing Luan,Xue Ye,Sha Dou,Zhijian Tang,Honglan Zhu,Peter Ping Lin,Yi Li,Heng Cui,Xiaohong Chang
1Department of Obstetrics and Gynecology;2 Center of Gynecologic Oncology,Peking University People’s Hospital,Beijing 100044,China;3Cytelligen,San Diego,California 92121,USA
Abstract Objective:Hematogenous metastasis is essential for the progression of ovarian cancer (OC),and circulating tumor cells (CTCs) are part of the metastatic cascade.However,the detection rate of CTC is low due to the use of less sensitive detection methods.Therefore,this study aimed to detect CTCs and circulating tumorigenic endothelial cells (CTECs) in patients with OC using subtraction enrichment and immunostaining and fluorescence in situ hybridization (SE-iFISH).Methods:We enrolled a total of 56 subjects,including 20 OC patients and 36 ovarian benign tumor patients.CTCs and CTECs were captured by subtraction enrichment (SE) and counted and classified according to immunofluorescence staining of tumor markers (TMs) carbohydrate antigen 125 (CA125) and human epididymis protein 4 (HE4) combined with fluorescence in situ hybridization (iFISH) of chromosome 8 (Chr8) aneuploidy.The diagnostic value and subtype characteristics of CTCs and CTECs were investigated.Results:The detection rate of CTCs by SE-iFISH was high.Compared with CA125 and HE4,Chr8 aneuploidy was the major identification feature of CTC.CTC counts in OC were statistically higher than those in benign groups.CTC and CTEC with ≥pentaploidy were detected in both groups,illustrating the poor diagnostic value of CTC or CTEC.Distributions of triploid and tetraploid CTC subtypes were significantly different,and combined detection of triploid and tetraploid CTCs showed the best diagnostic value.In contrast,the distribution of CTECs in the OC and benign groups had no statistically significant difference.Small CTCs accounted for over 1/3 of the total CTC count.We also found that small CTCs and CTECs primarily comprised triploid cells,while large CTCs and CTECs mainly comprised pentaploidy and beyond.Conclusions:The application of SE-iFISH offered a more comprehensive understanding of heterogeneous CTCs and CTECs in OC.Analysis of subclass characteristics of the CTCs and CTECs according to Chr8 aneuploidy and cell size may broaden their potential clinical utility and deepen mechanistic studies in OC.
Keywords:OC;CTC;CTEC;chromosome 8;aneuploidy;SE-iFISH
Introduction
Ovarian cancer (OC) is the second most common gynecological cancer but accounts for more deaths than any other gynecological malignant tumors (1).Due to the lack of efficient methods for early-stage diagnosis of OC,more than 70% of cases are diagnosed in advanced stages.Despite optimal cytoreductive surgery and standard platinum-based chemotherapy,most patients with OC cannot be fully cured;more than 70% of patients relapse within the first 2-3 years,and the 5-year survival rate is less than 30% (2).Difficulty in early diagnosis and ease of metastasis of OC contribute to poor prognosis.Identification of biomarkers for OC diagnosis and recurrence monitoring can improve the survival of OC patients.
Circulating tumor cells (CTCs),considered seeds of hematogenous metastasis,are novel tumor biomarkers that act as a liquid biopsy of non-invasive and real-time.CTCs have been approved by the US Food and Drug Administration and have shown diagnostic,prognostic,and predictive value in many types of solid malignancies (3-7).In OC,intra-abdominal implantation metastasis has traditionally been considered the main route of OC metastasis,and the role of hematogenous metastasis has not been sufficiently described.Recent studies have demonstrated the role of hematogenous metastasis in the spread of OC,including common peritoneal omental metastasis (8,9).Metastasis of OC is postulated to occur in two main mechanisms:passive diffusion and hematogenous metastasis (10).The discovery of CTCs in OC has bolstered the evidence for hematogenous metastasis of OC(11).Several studies have confirmed the potential clinical value of CTC for diagnosis,assessment of treatment efficacy,and prognosis of OC (12-16).
However,detection and identification of CTCs is still a major challenge due to the low CTCs count in peripheral blood.The detection rate of CTC in OC depends on the detection methods used.The traditional enrichment and identification methods based on epithelial antigens such as epithelial cell adhesion molecule (EpCAM) and cytokeratins (CKs) are influenced by the heterogeneity of antigen expression and epithelial mesenchymal transition(EMT),resulting in a low detection rate of 10%-40% (17-20).In recent years,the use of physical approaches based on cell size (MetaCell,Microblastc,Microfluidic,etc.) has overcome the limitation of varied antigen expression or EMT,hence improving the detection rate of CTCs in OC(16,21,22).Our research group has also successfully isolated CTCs of OC using microfluidic technology,and the sensitivity of detecting OC was 73.3% (23).However,the cell size-based detection approaches may miss the CTCs smaller than lymphocytes,which may also have important tumor biological functions (24).Subtraction enrichment and immunostaining and fluorescencein situhybridization (SE-iFISH),a novel CTC detection method,can compensate for the aforementioned shortcomings (25).In this technique,CTCs are obtained by a subtraction enrichment (SE) step with CD45 and other combined antibody-coated magnetic beads to remove white blood cells,followed by positive immunostaining (i) of tumor markers (TMs) combined with fluorescencein situhybridization (FISH) of chromosome 8 (Chr8) aneuploidy and negative staining of CD45 and CD31 to exclude leukocytes and circulating vascular endothelial cells.The SE-iFISH method can efficiently detect heterogeneous CTCs without the limitation of cell surface markers or cell size,and its use has been reported in many cancers,including gastric cancer,colon cancer,liver cancer,and pancreatic cancer (26-30).
Among CD31-positive circulating endothelial cells(CECs),circulating tumorigenic endothelial cells (CTECs)with aneuploid karyotypes have been reported and are involved in tumor neovascularization and metastasis (31).CTECs have been used as a TM to monitor the efficiency of antiangiogenic drugs and immunotherapy in some tumors (32,33).Co-detection of CTCs and CTECs has good prospects for cancer diagnosis,treatment,and prognosis (34,35).
In this study,CTCs and CTECs were co-detected by SE-iFISH in OC.The biological characteristics and subtype classification of CTCs and CTECs were reported,and their potential clinical significance was discussed.These findings will provide more insight into new diagnostic methods for the effective detection of CTCs in OC and inform further research.
Materials and methods
Patients and samples
We recruited 56 females admitted to Peking University People’s Hospital between May 2018 and August 2020.The inclusion criteria for patients were showed as follows:1) female patients aged 18-80 years;2) patients suspected of having OC,in whom ovarian masses were found by palpation,ultrasound and/or computed tomography (CT)and magnetic resonance imaging (MRI),and planning to have operation;3) patients had negative history of malignancy,and were treatment-naive before enrollment;and 4) patients had signed up the consent forms and were compliant to the examinations and blood sample collection.Exclusion criteria were as follows:1) patients were currently undergoing or had prior cancer treatment;2)patients had other malignant tumors or diseases within 5 years prior to enrollment;or 3) patients had other conditions which investigators thought was not suitable for the study.Subjects of the following descriptions were rejected from the study:1) blood sample collection and preservation did not follow standard procedure;2) blood clotting in the blood sample;3) blood samples were not processed within 6 h after collection;or 4) any abnormality during sample processing.Peripheral blood was collected before the operation from patients who were highly suspected of a malignant tumor or had a definite diagnosis but had not been treated. Postoperative pathology confirmed 20 patients with newly diagnosed primary OC and 36 patients with ovarian benign tumor.The flow diagram for patient selection in this study is shown inFigure 1.Written informed consent was obtained from all patients in accordance with the Declaration of Helsinki.The study was approved by the Ethics Committee of Peking University People’s Hospital and was performed according to the principles of the Declaration of Helsinki.
SE of CTC and CTEC

Figure 1 Flowchart of patient selection.
SE was performed according to the manufacturer’s instructions with minor modifications (Cytelligen,SanDiego,CA,USA).Briefly,6 mL of peripheral blood was collected into tubes containing ACD anticoagulant(Becton Dickinson,Franklin Lakes,NJ,USA) and then centrifuged at room temperature for 15 min (1,500 r/min)to separate plasma.The supernatant above the brown-red precipitate was discarded.The blood cell pellets were diluted with 6 mL CRC buffer and then gently added into 3 mL of the sample density separation liquid in a 50 mL centrifuge tube,followed by centrifugation at 3,000 r/min for 7 min.A solution containing white blood cells (WBCs)and tumor cells above red blood cells (RBCs) was collected into a 50 mL tube.Then,300 μL magnetic beads coated with anti-leukocyte monoclonal antibodies (anti-CD45,etc.) were added to the sample and shaken at room temperature for 30 min.A 50 mL magnetic separator(Cytelligen) was used to deplete immuno-beads bound to WBCs,and non-blood-derived cells (including tumor cells and endothelial cells) were washed and enriched in 100 μL CRC liquid.Samples were suitable for subsequent analyses,including immunofluorescent staining and iFISH,as described below.
iFISH
Automated 3D scanning and image analysis by Metaferi·FISH
Automated Metafer-i·FISH® CTC 3D scanning and image analyzing system were used to scan coated slides containing CTCs and CTECs stained by iFISH.Automated X-Y scanning with cross Z-sectioning of all cells performed at 1-mm steps of depth was conducted in six fluorescent color channels [DAPI,CD45,CD31,carbohydrate antigen 125(CA125),human epididymis protein 4 (HE4),and centromere probe 8 (CEP8)]. Number counts and subsequent comprehensive characterization and classification of CD31-CTCs and CD31+CTECs and statistical analyses were performed according to the trielement in the intracellular bio-chain comprising phenotype,karyotype,and cell morphology.The cell size,quantified immunostaining intensity of CA125 and HE4,and ploidy of Chr8 were important in analyzing CTCs and CTECs.
Statistical analysis
SPSS software (Version 24.0;IBM Corp,New York,USA)and GraphPad Prism 7 (GraphPad Software,La Jolla,CA,USA) were used for all statistical analyses.One-way analysis of variance (ANOVA) and unpaired student’st-test were used to analyze the differences between two groups and among three groups of separate data.The correlation of CTCs and CTECs detected was examined using Spearman correlation analysis.The correlation of CTC positivity with clinical pathologic characteristics was examined using Fisher’s exact test.The threshold of CTCs and CTECs was established with nonparametric receiver operating characteristic (ROC) curve analysis,and the maximum Youden index (sensitivity+specifcity -1) was used to determine the cut-off value.The classification data were expressed as percentiles.Pearson’s correlation analysis was used to determine the correlation.P-values <0.05 were considered statistically significant.
Results
Identification of CTCs and CTECs
CTCs and CTECs were identified by TMs CA125 and HE4,which have proven diagnostic value for OC.CA125-positive,HE4-positive,or dual-positive were considered TMs-positive.Generally,CTCs are nucleated cells with positivity for TMs and/or aneuploidy,but without CD45 and CD31 expression.More specifically,CTCs were defined as DAPI+/CD45-/CD31-/TMs+/CEP8=2 and/or DAPI+/CD45-/CD31-/CEP8≠2 (Figure 2A).The criteria for the identification of CTECs were the same as CTCs except for the positive expression of CD31,which was DAPI+/CD45-/CD31+/CEP8≠2 and/or DAPI+/CD45-/CD31+/TMs+/ CEP8=2 (Figure 2B).
Distribution of counts of CTCs and CTECs in OC and control groups
Counts of CTCs and CTECs in 20 OC patients were compared with those in 36 patients diagnosed with ovarian benign tumors.Table 1shows that 210 CTCs (median 8.5/6 mL) were detected in 19/20 OC patients (95.0%).CTCs were also detected in 34/36 (94.4%) patients with ovarian benign tumor,with a total number of 221 (median 4.0/6 mL).The number of CTECs in the OC and benign groups were 180 (median 5.0/6 mL) and 169 (median 2.0/6 mL),respectively.The distribution of CTCs in the two groups was statistically significant (P=0.0351) (Figure 3A).Although the counts of CTECs seemed higher in the OC group than in the benign group,the difference was not statistically significant (P=0.1652) (Figure 3B).
A medium correlation between CTCs and CTECs was found (r=0.442,P=0.0010,Figure 3C).To identify the utility of the combination of CTC and CTEC,we counted the sum of CTC and CTEC in different groups.The results showed that the difference in the sum of CTC and CTEC was not statistically significant in the OC group and ovarian benign tumor group (P=0.0647,Figure 3D).Moreover,compared with CTC alone,the sum of CTC and CTEC did not show any advantage.
CA125 and HE4 expression and Chr8 aneuploidy of CTCs and CTECs
Expression of CA125 and HE4 on the cell membrane and cytoplasm of CTCs and CTECs were identified by immunofluorescence staining.Ploidy of Chr8 in CTCs and CTECs was detected by FISH.The results are shown inTable 2.CA125-positive CTCs were detected in 4 OC patients (4/20,20.0%) and accounted for 4.8% of the total CTCs (10/210).HE4-positive CTCs were detected in 5 OC patients (5/20,25.0%) accounting for 4.3% of total CTCs (9/210).The corresponding CTEC results were similar;CA125-positive CTECs were detected in 6 patients(6/20,30.0%) and accounted for 14.4% of the total CTECs(26/180),while HE4-positive CTECs were detected in 5 patients (5/20),accounting for 6.1% of the total CTECs(11/180).The count of CA125+or HE4+CTC and CTEC in OC patients was low regardless of the positive detection rate and the proportion of total count of CTCs and CTECs.

Figure 2 Represent CTCs and CTECs detected by SE-iFISH in peripheral blood of ovarian cancer patients.(A) Two representative images of CTCs obtained by the SE-iFISH method.DAPI+/CD45-/CD31-/TMs+/CEP8=2 and/or DAPI+/CD45-/CD31-/CEP8≠2 were defined as CTCs;(B) Two representative images of CTECs detected by SE-iFISH.DAPI+/CD45-/CD31+/CEP8≠2 and/or DAPI+/CD45-/CD31+/TMs+/CEP8=2 were defined as CTECs.CTC,circulating tumor cell;CTEC,circulating tumorigenic endothelial cell;SE-iFISH,subtraction enrichment and immunostaining and fluorescence in situ hybridization;DAPI,4’,6-diamidino-2-phenylindole;TM,tumor marker;CEP8,centromere probe 8;HE4,human epididymis protein 4;CA125,carbohydrate antigen 125.

Table 1 Counts of CTCs and CTECs of 56 enrolled patients
However,CTC and CTECs with Chr8 aneuploidy were found in 19/20 (95.0%) and 16/20 (80.0%) OC patients,respectively.Moreover,among the 210 heterogeneous CTCs,only one was diploid CA125-positive,and the other 209 CTCs (99.5%) had Chr8 aneuploidy.Similarly,all 180 CTECs had aneuploidy of Chr8,and none of the TMs+CTECs were diploid.
When Grannonia heard these words, and saw how deeply rooted the Prince s love for her was, she felt very happy, and blushing rosy36 red, she said: But should I get the other lady to give up her rights, would you then consent to marry me? Far be it from me, replied the Prince, to banish37 the beautiful picture of my love from my heart
In summary,the number of TMs-positive CTCs and CTEC was low,and the primary feature of CTC and CTEC in our study was Chr8 aneuploidy.
Aneuploidy subtypes analysis of CTCs and CTECs
In our study,most CTCs and CTECs exhibited varying subtypes of Chr8 aneuploidy: haploidy,triploidy,tetraploidy,and ≥pentaploidy.Figure 4Ashows some representative images of different CTCs.
We did not analyze the data of haploid CTCs and CTECs as they were hardly detected in our research.Figure 4Bshows that compared with CTC counts,the different distributions of triploid and tetraploid CTCs were more significant in both OC group and ovarian benign tumor group (P=0.0068 and 0.0003,respectively).The distribution of ≥pentaploid CTCs showed no statistical difference (P=0.7578).Figure 4Cindicates that the distribution of all types of aneuploidy of CTECs had no statistical difference.Figure 4Dshows the proportion of every ploidy identified in the CTCs and CTECs.Interestingly,although ≥pentaploid CTC or CTEC was predominantly detected in benign or cancer groups,compared with the other subtypes,the proportion of triploid and tetraploid CTCs in the OC group was higher.
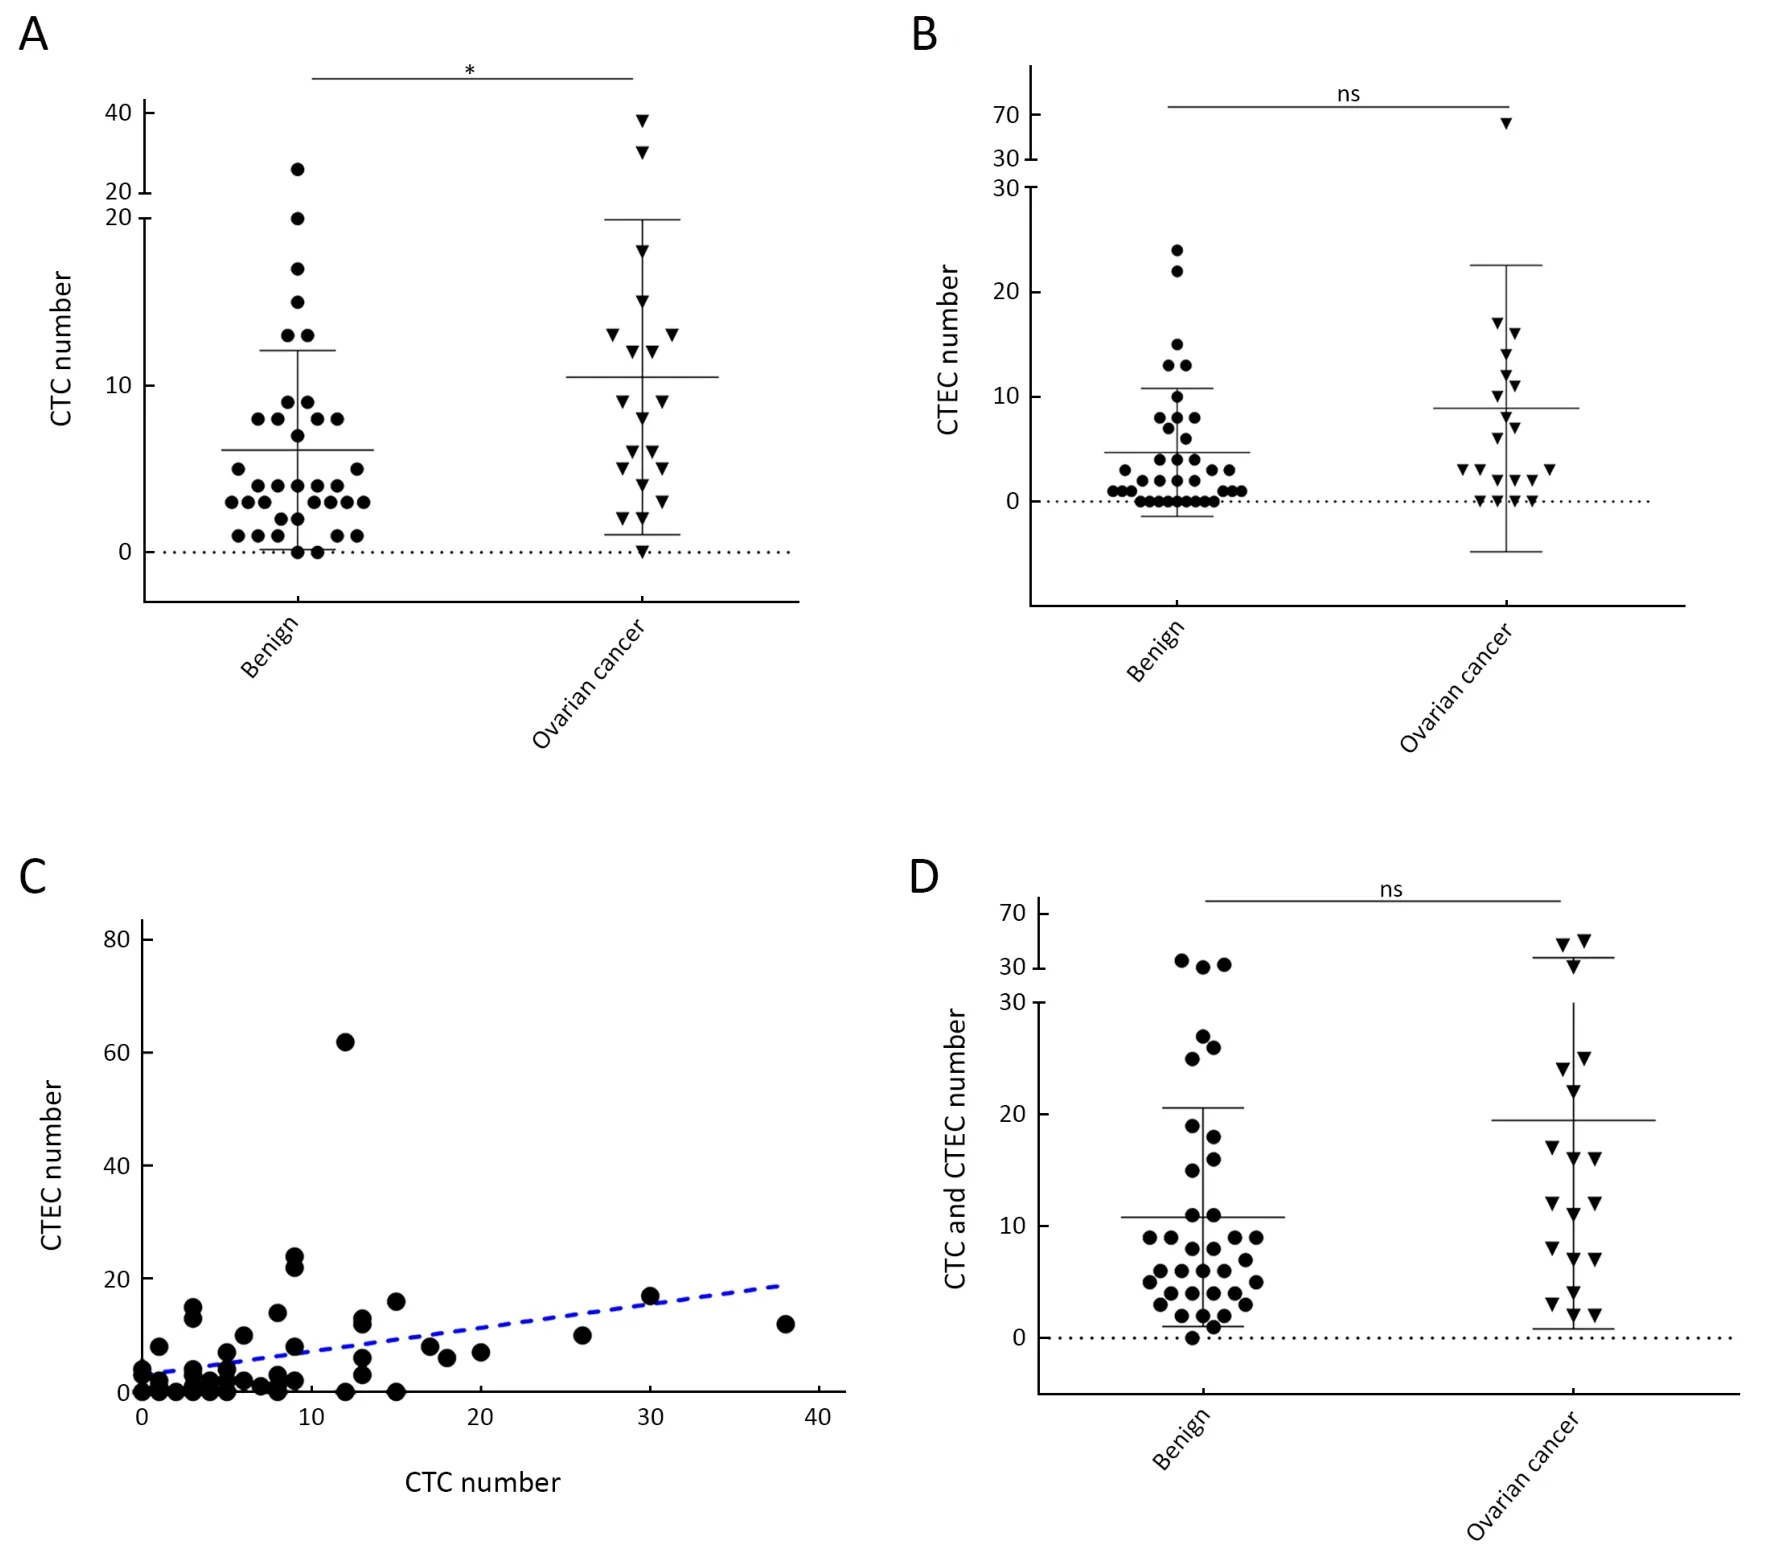
Figure 3 Distribution of CTCs and CTECs in different groups.(A) Total CTCs counts in ovarian cancer patients and benign tumor patients (P=0.0351);(B) Total CTECs counts in ovarian cancer patients and benign tumor patients (P=0.1652);(C) Correlation between dynamics changes in CTC and CTEC (r=0.442,P=0.0010);(D) Sum of CTCs and CTECs in ovarian cancer patients and benign tumor patients (P=0.0647).CTC,circulating tumor cell;CTEC,circulating tumorigenic endothelial cell;*,P<0.05;ns,no significance.

Table 2 Distribution of CA125 and HE4 expression and Chr8 aneuploidy in CTCs and CTECs detected by SE-iFISH in 20 ovarian cancer patients

Figure 4 Aneuploidy subtypes analysis of CTCs and CTECs in different groups.(A) Represent images of chromosomal aneuploidy in CTCs detected by SE-iFISH platform;(B,C) Chromosome 8 aneuploidy of CTCs and CTECs were exhibited by scatter plots,respectively;(D) Chromosome 8 aneuploidy of CTCs and CTECs were exhibited by pie charts,respectively.CTC,circulating tumor cell;CTEC,circulating tumorigenic endothelial cell;SE-iFISH,subtraction enrichment and immunostaining and fluorescence in situ hybridization;DAPI,4’,6-diamidino-2-phenylindole;CEP8,centromere probe 8;HE4,human epididymis protein 4;CA125,carbohydrate antigen 125;OC,ovarian cancer.**,P<0.01;***,P<0.001;ns,no significance.
To explain the large count of ≥pentaploid CTCs in the benign group,we investigated the Chr8 polyploidy in the OC cell lines CAOV-3 and SKOV-3.Supplementary Figure S1Ashows the status of cells with Chr8 ploidy,as examined by FISH.The percentage of cells with polyploid Chr8 in the two cell lines is shown inSupplementary Figure S1B.Interestingly,in cell line specimens,cells with aneuploidy Chr8 were found to be mainly triploidy or tetraploidy,which were also common in CTCs of OC.Cells with Chr8≥pentaploidy,which accounted for most CTCs in either OC or benign group,were rarely found in the cell lines.
Distribution of CTCs and CTECs of different sizes
Small (≤5 μm) and large (>5 μm) CTCs and CTECs are depicted inFigure 5A.Figures 5B,Cshow the distribution of small and large CTCs and CTECS in OC group and benign group,and only small CTCs had a statistically significant difference in distribution (P=0.0013). As illustrated inFigure 5D,the proportions of small and large CTCs in OC patients were 38.57% (81/210) and 61.43%(129/210),respectively,while those of small and large CTECs in the OC group were 14.44% (26/180) and 85.56% (154/180),respectively.In the benign group,the proportions of small and large CTCs were 17.65%(39/221) and 82.35% (182/221),respectively,while those of small and large CTECs were 14.79% (25/169) and 85.21%(144/169),respectively (Figure 5E).For both CTC and CTEC,large cells were dominant in OC group and benign group,while the proportion of small CTCs was higher in the OC group than in the benign group,an interesting and noteworthy phenomenon.

Figure 5 Cell size subtypes analysis of CTCs and CTECs in different groups.(A) Represent images of different sizes of CTCs and CTECs detected by SE-iFISH platform.Diameter ≤5 μm was defined as small CTCs and CTECs,and diameter >5 μm was defined as large CTCs and CTECs;(B,D) Different distribution of large CTCs and small CTCs in 2 groups were exhibited by scatter plots and pie charts,respectively;(C,E) Different distribution of large CTECs and small CTECs in 2 groups were exhibited by scatter plots and pie charts,respectively.CTC,circulating tumor cell;CTEC,circulating tumorigenic endothelial cell;SE-iFISH,subtraction enrichment and immunostaining and fluorescence in situ hybridization;DAPI,4’,6-diamidino-2-phenylindole;CEP8,centromere probe 8;HE4,human epididymis protein 4;CA125,carbohydrate antigen 125;OC,ovarian cancer.**,P<0.01;ns,no significance.
Aneuploidy analysis of CTCs and CTECs of different sizes
To further understand the significance of various subtypes of CTCs and CTECs in OC,cell size and Chr8 ploidy were analyzed,and the distribution of 12 subgroups of CTCs in benign and OC groups is shown inFigure 6A-D.

Figure 6 Chromosome ploidy differences between different sizes of CTCs and CTECs.(A,B) Chromosome ploidy distribution in small CTCs and CTECs in benign and OC patients;(C,D) Chromosome ploidy distribution in large CTCs and CTECs in benign and OC patients;(E) Proportion of different ploidy of chromosomes 8 in different sizes of CTCs and CTECs.CTC,circulating tumor cell;CTEC,circulating tumorigenic endothelial cell;OC,ovarian cancer;***,P<0.001;ns,no significance.
As indicated inFigure 6A,only triploid and tetraploid cells among small CTCs were significantly different between the benign and cancer groups (P=0.0003 and 0.0002,respectively).Small CTCs with ≥pentaploidy were not different between cancer and benign groups.For large CTCs,only tetraploid cells showed statistically significant differences between the two groups (Figure 6C).Concerning the distribution of CTECs between cancer and benign groups,only tetraploid cells among small CTECs showed a significant difference (P=0.0003) (Figure 6B).Figure 6Eshows the proportion of aneuploid cells of different sizes in the benign and cancer groups.In both benign and cancer groups,triploid cells had the highest proportion among small CTCs and small CTECs,while ≥pentaploid cells had the highest proportion among large CTCs and large CTECs.
Potential clinical value of CTCs and CTECs count
To discriminate OC patients from non-malignant cases,ROC curves were plotted to determine the sensitivity and specificity of CTCs and CTECs and their subtypes according to aneuploidy or cell size measured by SEiFISH.Based on Youden’s index,optimum cut-off values were selected.Table 3shows the optimum cut-off values of CTC,CTEC,and CTC+CTEC.Figure 7Ashows the receiver operating characteristic (ROC) curves.Although the diagnostic value of CTC was the highest among them,it was not satisfactory because its area under the curve(AUC) of ROC was only 0.670 (cut-off:4.5/6 mL,sensitivity:75.00%,specificity:58.30%).As shown inTable 3andFigure 7B,the diagnostic value of triploid and tetraploid CTCs had a better clinical value considering the AUC of 0.792 (cut-off:2.5/6 mL,sensitivity:50.00%,specificity: 94.44%) and 0.821 (cut-off: 0.5/6 mL,sensitivity:75.00%,specificity:80.51%),respectively.We also found that combined triploid CTC and tetraploid CTC could show better clinical value as indicated by the AUC of 0.853 (cut-off:2.5/6 mL,sensitivity:70.00%,specificity:91.67%),which was higher than that of triploidy or tetraploidy alone.Table 3andFigure 7Cshow the diagnostic value of the CTCs and CTECs subgroups classified by aneuploidy and cell size.These indexes were chosen because the differences in their distributions between the benign group and OC group were statistically significant.All the CTCs subgroups showed good clinical value with AUC of over 0.7.The group of combined triploid and tetraploid small CTCs showed the best clinical value of diagnosis with AUC of 0.809 (cut-off:1.5/6 mL,sensitivity:70.00%,specificity:83.30%),but was not better than triploid+tetraploid CTCs (cut-off:2.5/6 mL,sensitivity:70.00%,specificity:91.67%,AUC of 0.853).
Discussion
In this study,using SE-iFISH,a novel CTC detection approach (25),we efficiently isolated,identified,and characterized heterogeneous sub-populations of CTCs from the peripheral blood of OC patients.The differencein the distribution of CTC counts between the OC and the benign tumor groups was statistically significant,while the distribution of CTEC in the two groups had no significant difference.However,the diagnostic value of CTC and CTEC was limited due to high counts in the benign group,which was markedly different from previous studies (31).Subtype analysis of aneuploidy found that although CTCs and CTECs detected in the benign group were mainly≥pentaploidy,triploid and tetraploid CTCs showed good utility in distinguishing patients with malignant tumors from patients with benign tumors.Combined triploid and tetraploid CTC had a superior diagnostic value with sensitivity of 70% and specificity of 91.67% when the optimum cut-off value was set as 2.5/6 mL.

Table 3 Optimum cut-off values and their respective sensitivity and specificity

Figure 7 Potential clinical values of CTCs and CTECs.(A) ROC curves of CTC count,CTEC count,sum of CTC and CTEC;(B) ROC curves of CTCs classified by aneuploid of chromosome 8;(C) ROC curves of CTCs and CTECs classified by cell size and/or chromosome 8 aneuploidy.CTC,circulating tumor cell;CTEC,circulating tumorigenic endothelial cell;ROC,receiver operating characteristic.
Research on CTCs depends on the availability of CTC detection methods.Previous studies suggested that CTC detection rates in OC patients vary widely (12%-90%)across different detection techniques (23).The detection rate of CTCs by SE-iFISH in our study (95%) was higher than most common CTC detection approaches.The detection of CTCs by SE-iFISH includes two steps:isolation and identification.SE isolation methods are based on negative enrichment without affecting by TMs expression and cell size,and can capture various CTCs,including those CTCs with negative expression for epithelial marker or small-size CTCs,which are missed by the usual positive enrichment methods (Cellsearch,Adnatest etc.) based on epithelial marker expression and physical isolation methods (MetaCell,Microblastc,Microfluidic,etc.) based on cell size.In iFISH identification steps,Chr8 aneuploidy FISH detection was used to supplement the usual immunofluorescence staining method based on the expression of epithelial markers or TMs and could identify the heterogeneous CTCs more efficiently.
Notably,the application of CA125 or HE4 in this study was not as satisfactory as in some previous studies.Pearlet al.(36) obtained a high detection rate (88.6%) of CTCs in OC by combining EpCAM,CK,dipeptidyl peptidase 4(DPP4),and CA125 for identification after CAM functional separation.In contrast,EpCAM,MUC1 and CA125 were applied by Kolostova for identification after enrichment of CTCs in OC by Meta Cell,a cell sizedependent method,and the detection rate of CTCs was 65.2% (21).In our previous study (23),using HE4 combined with epithelial and mesenchymal markers after size-dependent enrichment of microfluidic chip revealed that HE4 was more important than epithelial and mesenchymal markers in identifying CTCs in OC.One reason for the varied performance of CA125 and HE4 might be the loss of small-size CTCs (accounted for over 1/3 in this study) in previous studies,and small CTCs might lose some characteristic features during EMT compared with large CTCs (32).Second,the failure to consider Chr8 aneuploidy in previous studies might have led to low detection of a large proportion of CTCs with Chr8 aneuploidy but negative for TMs (accounted for over 80% in this study).Third,in previous studies,CD31 was not used as a negative identification marker,implying that CTECs and CECs with TM expression might have been counted as CTCs.For these reasons,the positive detection rate of TM-positive CTCs might have been higher in previous studies.Thus,the SE-iFISH method used to detect CTC in this study was superior to techniques used in earlier studies in both separation and identification steps,thus leading to a higher detection rate of real CTCs.
In this study,compared with CA125 and HE4 TM expression in CTCs of the OC group,Chr8 aneuploidy was a superior identification characteristic,as 99.5% (209/210)of CTCs had aneuploid Chr8 in 95.0% (19/20) of OC patients.Aneuploidy is the hallmark of malignant cells,and approximately 90% of solid tumors and 75% of hematological carcinomas exhibit aneuploidy (35).In particular,aneuploid Chr8 is common in many cancers,including lung,gastric,pancreatic,colon,bladder,esophageal,and hepatocellular carcinomas (35).Triploid Chr8 (trisomy 8)is one of the most common cytogenetic changes in acute myeloid leukemia,which may be significant for the pathogenesis,treatment,and prognosis of cancer (37).The aneuploidy of Chr8 in OC cells has been studied previously.A study by Market al.(38) in 1999 reported that 80% of phase I and 93% of phase III OC tissues had trisomy 8,suggesting that trisomy 8 might be an early event in OC and could be associated with disease progression.Aneuploid CTCs can also exist in peripheral blood in addition to tumor tissues.Thus,the ploidy status of chromosomes in CTC has attracted widespread scientific attention due to its significance in cancer progression.A previous study showed that triploid CTCs were predominant in most patients (82.8%) with newly diagnosed nasopharyngeal carcinoma,while multiploid (pentaploid and beyond) CTCs were prevalent in most patients(66.7%) with recurrence and metastasis (39).The copy number of Chr8 in CTCs could be related to cancerspecific drug resistance;triploid CTCs are possibly associated with intrinsic drug resistance,while tetraploid and multiploid (pentaploid and beyond) CTCs may participate in acquired drug resistance (26).Chr8 aneuploidy in CTCs also induced the evolutionary expression of HER2 on circulating gastric cancer cells and contributed to chemotherapeutic resistance (40).Therefore,subclass analysis of CTCs based on Chr8 aneuploidy could help understand the occurrence,diagnosis,and treatment of tumors.
In this study,we have reported that Chr8 polyploid CTCs are predominant in OC patients.Specifically,the distribution of triploid and tetraploid CTCs in benign and malignant OC cases was significantly different.Subclass aneuploidy of CTCs may be useful in identifying malignant tumors.The diagnostic value of triploid and tetraploid CTCs was demonstrated by the high AUC,and the combined detection of triploid and tetraploid CTCs showed a better clinical value with a sensitivity and specificity of 70.00% and 91.67%,respectively,when the optimum cut-off value was set as 2.5/6 mL.Interestingly,although the Chr8 triploidy (32.54%) and ≥pentaploidy(47.84%) were common aberrations of aneuploid CTCs in OC,≥pentaploidy was identified in the vast majority of CTCs in the benign group (73.30%) but was almost absent in the OC cell lines SKOV3 and CAOV3.These findings are consistent with previous studies,which suggested that the Chr8 triploidy was a common and early event in cancer progression (37,38).The high detection rate of aneuploid CTCs and CTECs in the benign group contrasts with the conventional understanding that CTCs exist only in patients with malignant tumors.As cancer cell lines are immortalized,we hypothesize that the lack of pentaploid cells in OC cell lines in this study is due to the loss of the mitotic ability of Chr8 pentaploid cells leading to the gradual count reduction.The high count of ≥pentaploid cells in patients with benign tumors supports our hypothesis as these cells are incapable of mitosis and are eventually destroyed by the immune system.However,more research evidence is required to test our hypothesis and understand the exact relationship between ovarian benign disease and Chr8 aneuploidy.The clinical significance and role of CTC subtypes with different Chr8 aneuploidy in cancer development and progression should be elucidated.
Cell size was also an important feature in the analysis of CTCs.Small CTCs (<5 μm) accounted for 38.57%(81/210) of total CTC count in OC patients and could have been omitted if we had used conventional technology.Despite the dominance by large CTCs in OC,only small CTCs showed a statistically significant difference in distribution between OC and benign tumors.Due to the intrinsic drawbacks of conventional CTC technology,the description of CTCs of different sizes and their applied clinical value are rarely mentioned in past literature.Many CTCs are similar or smaller than WBCs (24);the small CTCs have special clinical significance in tumors.The EMT process and therapeutic treatment could affect the size of CTCs and cause negative detection (41).Mesenchymal CTCs from EMT might be of small cell size,and chemotherapy might reduce the size of CTCs.Drugresistant CTCs may be smaller than drug-sensitive CTCs(36,42,43).In this study,additional karyotyping of small and large CTCs and CTECs indicated that triploid cells were predominantly detected among small CTCs and CTECs,while ≥pentaploid cells were predominant among large CTCs and CTECs.Further studies are required to gather research evidence on the characteristics and significance of cell size and aneuploidy of CTCs.
Moreover,CTECs were evaluated in this study.CD31+CTECs are derived from CD31+tumor endothelial cells(TECs) in tumor tissues (32).The role of TECs in tumor angiogenesis has been substantially investigated (35).CTECs may participate in the tumor microenvironment and may interact with CTCs.However,the exact role of CTECs is not well understood due to the inefficiency of detection methods.Notably,the emergence of the iFISH technology led to the unexpected discovery of CTECs in peripheral blood during the process of detecting CTCs.In this study,based on the expression of CD31,cells screened according to the criteria of SE-iFISH were divided into two subsets,CTCs and CTECs.CD31 was a negative marker for CTC and an identification index of CTEC.Our results showed that 14.4% (26/180) and 6.1% (11/180) of CTECs expressed CA125 and HE4,respectively,and all CTECs had aneuploidy of Chr8 (180/180,100%),meaning that CTECs may interfere with the specificity of CTC detection,hence the need to eliminate the interference by CTECs.The characteristics and clinical value of CTCs and CTECs were discussed separately and by comparison.The distributions and diagnostic value and chromosomal changes of CTCs and CTECs were similar.In terms of quantity,the total counts of CTC and CTEC were higher in OC patients than in patients of the non-malignant group.A slight correlation between CTC and CTEC was found.However,the distribution of CTECs in OC and benign groups was not different,thus limiting the clinical diagnostic value of CTECs.Besides,subtype analysis of CTECs did not find any difference between the two groups.Although the distribution of small tetraploid CTEC showed a certain difference,its diagnostic value was limited.More studies are needed to verify the diagnostic value and elucidate further the characteristics of CTECs.
This study also has some shortcomings.First,the application of CA125 and HE4 in the SE-iFISH platform showed unsatisfactory efficiency.A more sensitive and specific TM for immunostaining is essential for the detection of OC.Second,we had a small sample,and this could affect the validity of our findings.In the future,more cases need to be enrolled for dynamic monitoring of CTCs in OC.
Conclusions
In ovarian cancer patients,the CTC counts detected by SE-iFISH were significantly higher than those of ovarian benign tumor patients,while CTECs showed no such difference.However,due to high counts in the benign group,both CTCs and CTECs showed unsatisfactory diagnostic value.Subtype analysis of aneuploidy found that triploid and tetraploid CTCs were rarely detected in benign patients,which conferred them a better clinical value and was worth being studied further.The cell size was further analyzed and we found that the small cells were mainly Chr 8 triploidy and tetraploidy while large cells were mainly Chr 8 multiploidy (≥pentaploidy).Finally,combined detection of Chr 8 triploid and tetraploid CTCs showed the best diagnostic value in our research.
Acknowledgements
This work was financially supported by the National Key Research and Development Program of China (No.2016YFA0201404),National Natural Science Foundation of China (No. 81971360),and the National Key Technology R&D Program of China (No.2015BAI 13B06).
Footnote
Conflicts of Interest:The authors have no conflicts of interest to declare.
杂志排行

Chinese Journal of Cancer Research的其它文章
- Landscape of cell heterogeneity and evolutionary trajectory in ulcerative colitis-associated colon cancer revealed by single-cell RNA sequencing
- Multicenter phase II study of apatinib single or combination therapy in HER2-negative breast cancer involving chest wall metastasis
- Effect of preoperative nutrition therapy type and duration on short-time outcomes in gastric cancer patient with gastric outlet obstruction
- Novel therapies targeting hypoxia mechanism to treat pancreatic cancer
- Laparoscopic surgery for gastric cancer:Current status and future direction
- Clinical challenges in neoadjuvant immunotherapy for non-small cell lung cancer