Trends and seasonality in hospitalizations for acute alcohol-related and biliary pancreatitis in the USA
2021-05-19ArtemShmelevAnneSillTiffanyHorriganStevenCunningham
Artem Shmelev ,Anne M Sill,Tiffany Horrigan,Steven C Cunningham
Department of Surgery, Saint Agnes Healthcare, Baltimore, MD, USA
Keywords:Pancreatitis Alcoholic pancreatitis Incidence Seasonal variation
ABSTRACT Background: The incidence of acute pancreatitis (AP) is characterized by circannual and geographical variation.The aim of this study was to describe seasonal variation and trends in hospitalizations for AP in the USA with respect to AP etiology.Methods: The Nationwide Inpatient Sample data (20 0 0–2016) from the Healthcare Cost and Utilization Project were used.The study population included all primary hospitalizations for AP.Biliary AP (BAP)and alcohol-induced AP (AAP) were distinguished by diagnostic and procedural ICD codes.Seasonal trend decomposition was performed.Results: There was a linear increase in annual incidence (per 100 000 population) of AAP in the USA(from 17.0 in 20 0 0 to 22.9 in 2016),while incidence of BAP,equaled 19.9 in 20 0 0,peaked at 22.1 in 2006 and decreased to 17.4 in 2016.AP incidence demonstrated 18% annual incidence amplitude with summer peak and winter trough,more prominent in AAP.In 2016,within AAP,the highest incidence (per 100 000 population) was noted among African-Americans (up to 50.4),followed by males aged 56–70 years (26.5)and Asians of low income (25.5);within BAP,above the average incidence was observed in Hispanic (up to 25.8) and Asian (up to 25.0) population.The most consistent and rapid increase in AP incidence was noted in males aged 56–70 years with an alcoholic etiology (average 6% annual incidence growth).Conclusions: The incidence and annual trends of AP vary significantly among demographic and socioeconomic groups and this knowledge may be useful for the planning of healthcare resources and identification of at-risk populations.
Introduction
Acute pancreatitis (AP) ranks seventeenth among all causes of hospitalizations in the USA and first among all gastrointestinal diseases [1].Two major causes of AP,biliary stones and alcohol use,comprise 28% −42% and 20% −40% of all AP admissions,respectively [2].The incidence,demographics,and etiology of AP vary substantially in different populations as have been described in several recent epidemiological studies [2–4].
Over the past few decades,the incidence of AP has continued to increase worldwide [4–9].In the USA,the incidence increased from 55 to 90 per 100 000 population from 1993 to 2014 [1].The obesity epidemic in the USA,which predisposes patients to gallstones formation and higher triglyceride levels,and a wider use of serum pancreatic enzymes assays,are among possible explanations of the observed rise in AP incidence [ 4,10 ].The epidemiology and trends of AP in the USA in the last decade with respect to age groups,sex,race and socioeconomic status (SES) are not well documented.
AP incidence is not only changing over the course of years,but is also subject to prominent circannual,or seasonal,fluctuations.Knowledge of these fluctuations can help with healthcare resources planning and perhaps can improve the understanding of potential etiological factors of AP.Seasonal variations in incidence of various pathologies,including acute surgical conditions,are well-established [ 11–13 ].The seasonal variation of AP has also been described in different countries [ 6,8,14–17 ].Despite certain population-specific discrepancies,most groups reported a predisposition to AP during warm seasons,particularly in alcohol-related AP (AAP),compared to biliary AP (BAP).Data on the association of peaks in AP incidence with festival seasons appear to be conflicting [ 8,18 ].Other studies have investigated the correlation between metrics and patterns of alcohol consumption and AP incidence with discordant results [ 18–23 ].Although there are several studies on the seasonality of AP from Europe [ 2–4,6 ],data from the USA are relatively lacking [7].Another critical point is the methodology used for analysis of incidence:most studies used raw AP incidence and conventional statistical approaches to compare interseason or intermonth variability.However,it is important to understand that the variability in incidence is better assessed with a time-series analysis,such as seasonal decomposition procedures [24].This approach is widely used in econometrics and natural sciences for forecasting and allows one to expose nonobvious seasonality.
The aims of this study were to detect populations that pose a prominent impact into overall AP incidence and with most rapid increase in AP rates,as well as description of seasonal variation of AP admissions,using modern methods of time-series analysis.
Methods
The study population was obtained from National Inpatient Sample (NIS) data from the Agency for Healthcare Research and Quality (AHRQ)’s Healthcare Cost and Utilization Project (H-CUP),from 20 0 0 to 2016.Since the NIS provides a representative random 20% sample of all hospital discharges in the USA,incidence estimates were calculated taking into account discharge weights for each record,in order to produce national estimates [25].
Selection of the study population and detection of AP etiology
The study analysis database were constructed from all nontrauma primary admissions for AP (ICD-9-CM code 577.0).BAP was defined if any of 43 diagnostic ICD-9-CM codes (International classification of diseases,9th edition,clinical modification)or of 40 diagnostic ICD-10-CM codes for biliary pathology was encountered,or any of 23 procedural ICD-9-CM codes (or corresponding 156 procedural ICD-10-CM codes) for endoscopic retrograde cholangiopancreatography (ERCP) or cholecystectomy.Similar sets of ICD codes were used to define BAP etiology in multiple published works in various administrative databases,such as H-CUP National Readmission Database,Medicare claims database,and Sweden hospital discharge database [ 4,26 ].AAP was considered if any of the 33 diagnostic ICD-9-CM codes (or corresponding 38 diagnostic ICD-10-CM codes) for alcohol-related disorders were reported (the complete list of used ICD-9 and ICD-10 codes is available in Table S1) [4].Cases not attributed to alcohol or gallstones were combined into an“other etiology”group.
Annual reporting rates of aforementioned codes were obtained from AHRQ’s H-CUP online database (HCUPNet),to ascertain that reporting of obsolete and newer codes will not affect AP etiology classification.
Monthly weighted rates of BAP and AAP,as well as AP due to other etiologies were calculated and adjusted for the number of days in a given month to eliminate the so-called“February effect”.Monthly hospitalization rates for AP (per 100 000 general USA population) were calculated using nationwide annual population estimates from USA 20 0 0–2016 Census data.Monthly admission rates of BAP and AAP were also computed for each sex,age group,race,and income quartile,using corresponding proportions from Census and NIS to calculate appropriate denominators,to allow for intergroup comparison and determine populations with the highest AP incidence,largest contribution to overall AP incidence and fastest incidence increase.
Additionally,50-state maps of AP hospitalization rates (averaged over 20 0 0–2011 since NIS does not provide state markers after 2011) were generated,as well as the proportion of alcoholic and biliary etiologies in each state.Also,we calculated the correlation between fraction of alcoholic etiology and decile of alcohol intake within a state (data from National Institute on Alcohol Abuse and Alcoholism per capita alcohol consumption report,2012) [27].
All analyses were performed in SPSS v.22 (IBM Corp.,Armonk,NY,USA) and R v.3.5.1 (R Core Team 2018,Vienna,Austria).
Our institution policy does not require Institutional Board Review for deidentified administrative data analysis.
Time-series analysis
The incidence of AP,as of many other acute pathologies,is known to vary on a seasonal basis and can be analyzed with time-series seasonal trend decomposition [24].Detailed description of this method is outlined in supplementary material,available online.Seasonal decomposition was performed for hospitalization rates within each subpopulation mentioned above.Significance of observed trends was assessed with the Mann-Kendall (MK) test.The linear rate of trend change (slope) was calculated according to Sen’s method.Additionally,demographic,patient-and hospital-level characteristics,as well as outcomes in populations admitted during summer and winter months were compared.
Results
Characteristics of the study population
A total of 4 331 081 patients with AP,admitted in 20 0 0–2016,were included in the analysis,of which 24.3% (1 053 899) had AAP and 24.9% (1 080 125) had BAP.The characteristics of the study population (sex and age,etiology,Charlson comorbidity index,inhospital mortality and length of stay [LOS]etc.) are depicted in Fig.1 and Table 1 .Compared to other etiological groups,patients with AAP were younger (median age 46 years,highest proportion of 31–55 years old patients) and had the highest fraction of males(69.2%),African-Americans (A-A) (23.4%),those with lowest income(30.4%),and lowest in-hospital mortality (0.6%).The BAP population was generally older (median age 57 years),more often female(60.2%),and predominantly Hispanic and Caucasian;they had the longest LOS and highest total hospital charges.Patients with mixed and other AP etiologies were characterized by highest comorbidity index scores and highest in-hospital mortality rates (P<0.001).
State-wise AP hospitalization rates and etiological distribution are presented in Fig.2 .The highest AP incidence was observed in the Southeast and in New England;the highest AAP rate was noted in the North Mountain region and New England.Higher alcohol consumption within a given state (total consumption decile) and fraction of AAP demonstrated strong correlation (r=0.59;Fig.S1).
Time-series analysis of BAP and AAP incidence
Because variability in incidence is better assessed with a timeseries analysis,we next employed this technique to study the relative incidences of BAP and AAP (Fig.S2).Annual nationwide AP hospitalization rates considering etiology are provided in Table S2.Incidence of AAP had a monotonous ascending trend,with an average annual increase of 2.82% (P<0.001 by M-K test;Table 2).Initially,the ascending trend of BAP incidence reached plateau around 2004 (21.8 hospitalizations per 100 000 population annually) and then slowly started to decline.Incidence of AAP crossed BAP around 2009 and continued to increase,from 17.0 in 20 0 0 to 22.9 in 2016.The long-term trend of AP of other etiologies had a local peak around late 2004 and a trough in 2007 with subsequent increase (P<0.001 by M-K test).
Seasonal decomposition of AP incidence revealed marked,with highest admission rate during warm season (June to September),which was more pronounced for AAP,particularly in males(Fig.3 and Fig.S3).A Kruskal-Wallis rank-sum test of monthly AP rates demonstrated significance of intermonth differences (P<0.001).Seasonality accounts for approximately 18% of overall AP incidence.
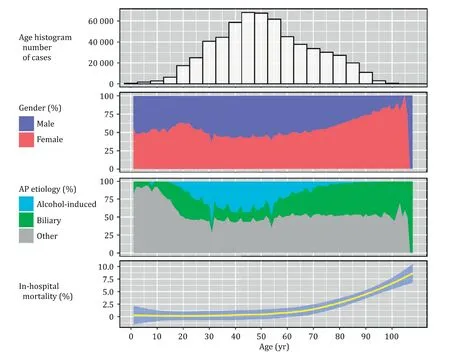
Fig.1.AP population characteristics with respect to age (NIS 20 0 0–2016).AP:acute pancreatitis.
Subpopulation analysis of hospitalization rates of BAP and AAP is provided in Table 2 and Figs.4 and 5 .Focusing on the latest available data in 2016,certain subpopulations exceeded average hospitalization rate within given etiology (22.9 per 100 000 population for AAP and 17.4 per 100 000 population for BAP;Table 2).Within AAP (per 100 000 population),above-average incidence was observed in males aged 56–70 years (26.5 in 2016),as well as in entire A-A population (with the highest AP incidence among all subpopulations of 50.4 in A-A of lowest income) and Asians of low income (25.5).Within BAP (per 10 0 0 0 0 population),above the average incidence was observed in Hispanic and Asian populations of any SES,as well as in females aged>70 years (18.7)and males aged 56–70 years (20.2).Subpopulations with the highest overall contribution to total annual incidence of AAP by the end of the study period (2016) were males aged 30–55 years,followed by females aged 30–55 years and females older than 56 years.In BAP,the largest contribution to total BAP incidence were males aged 30–55 years,followed by females aged 30–55 years.From a racial and SES standpoint,Caucasians contributed the most to the total incidence of AP for both biliary and alcohol-induced etiologies.
Within the biliary etiology,incidence of AP decreased in both sex in elderly individuals,and remained relatively steady in other age-sex subpopulations.In most race-income subgroups,BAP incidence peaked around 2012–2015 and started to decline afterwards.In AAP,the greatest increase in incidence was noted in males aged 56–70 years.Rapid growth in AAP incidence was also observed in males aged>70 years and in females aged>56 years,starting in mid-2012.
Discussion
Seasonal variation in the incidence of many medical conditions is a well-known phenomenon.Several explanations have been suggested,but actual causes of observed seasonal fluctuations are difficult to establish,since even parallel temporal trends could represent spurious correlations due to the presence of confounders.Advanced methods of time-series analysis are better able to unmask hidden seasonality but are not always used.Yet,knowledge of a seasonality phenomenon is potentially very important as it could help to identify modifiable risk factors and can assist with planning of healthcare resources.Long-term annual-trends analysis,as used in this study,can identify the most vulnerable populations with increasing incidence of disease [4].Temporal trends of the incidence of AP,a major contributor to the burden of gastrointestinal pathology,therefore deserve close attention.
Increasing AP incidence in past decades has been well documented in large population studies,including studies from the UK (1999–2010;n=10 589) [3],Sweden (2003–2012;n=1457) [2],China (2009–2014;n=1780) [8],Ireland (1997–2004;n=6291) [9],and the USA (2002–2005;n=2 016 045) [28].Interestingly,AAP rates decreased in Finland in 2002–2007 with concomitant increase in average alcohol consumption [20].Compared to other etiologies,AAP demonstrated a much more evident rise in Ireland [9].One of the largest epidemiologic studies of yearly rates of alcohol-related liver and pancreas disorders in the USA found that yearly incidence of the pancreatic disorders increased from about 40 per 100 000 population to 65 per 10 0 0 0 0 population by mid-20 0 0s [7].Using a different,stricter definition of AAP (Table S1),we found AAP yearly rates ranging from 17 to 24 per 100 000 population (Table S2),but total AP rates were consistent with those obtained from HCUPNet queries [1].A potential and generally accepted explanation for rising total AP incidence is the obesity epidemic,which predisposes patients to cholelithiasis.However,we did not find a significant increase in BAP,but rather noted increase in AAP.
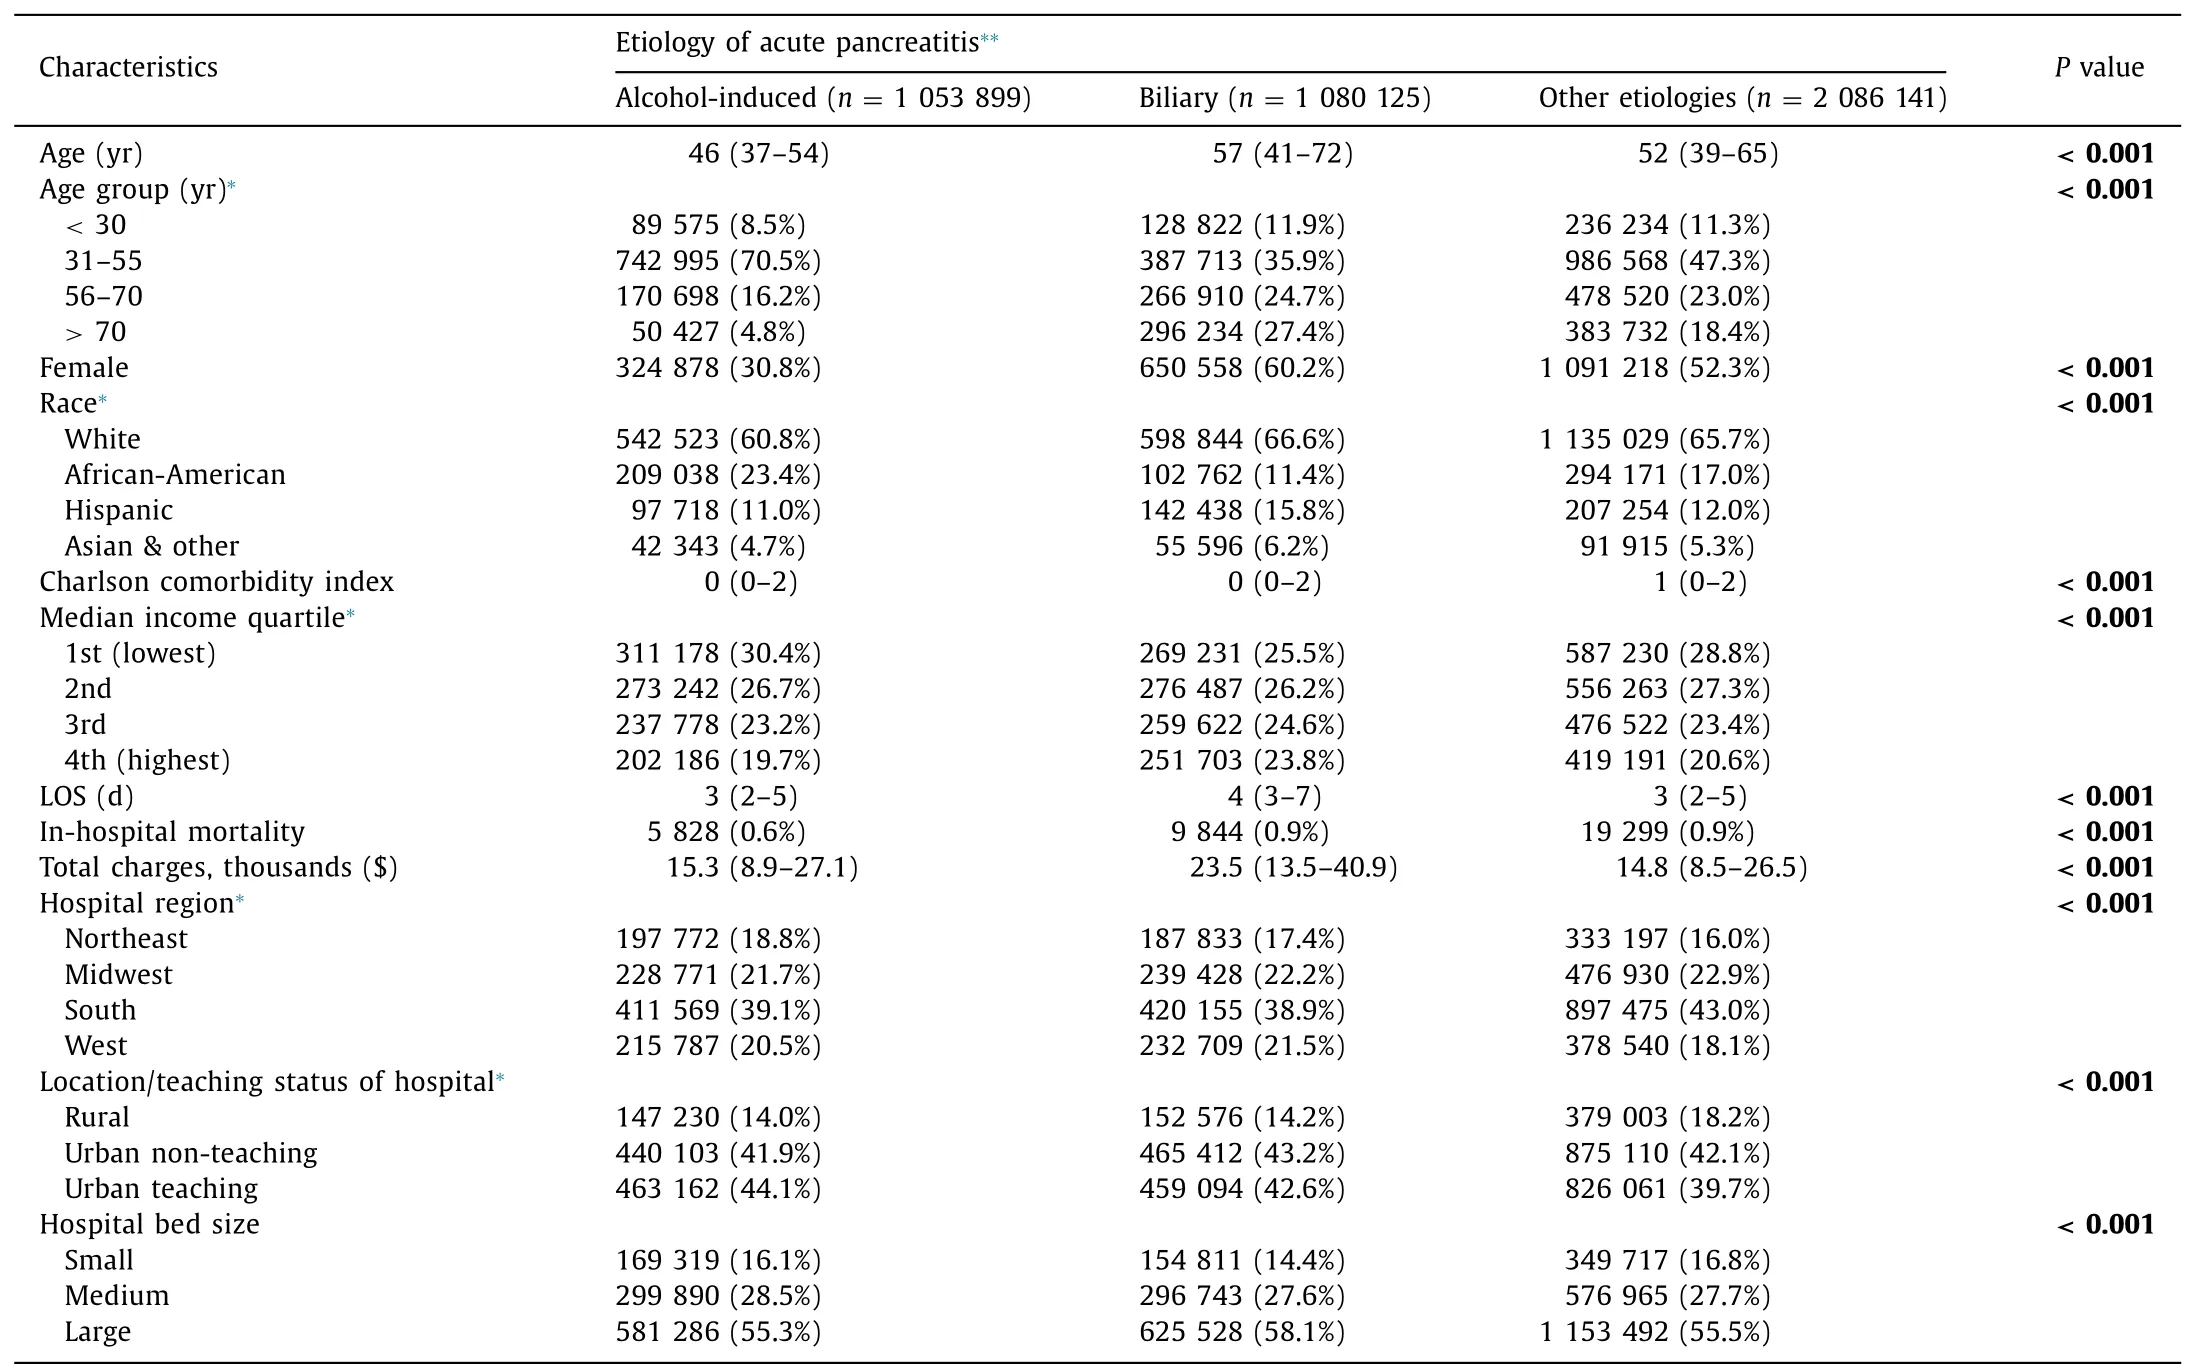
Table 1 Characteristics of study population with respect to AP etiology (NIS 20 0 0–2016).
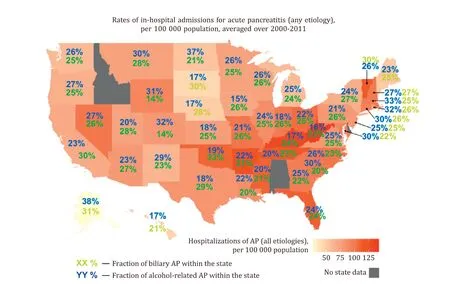
Fig.2.State-wise hospitalization rate for AP with proportions of biliary and alcohol-induced AP.AP:acute pancreatitis.
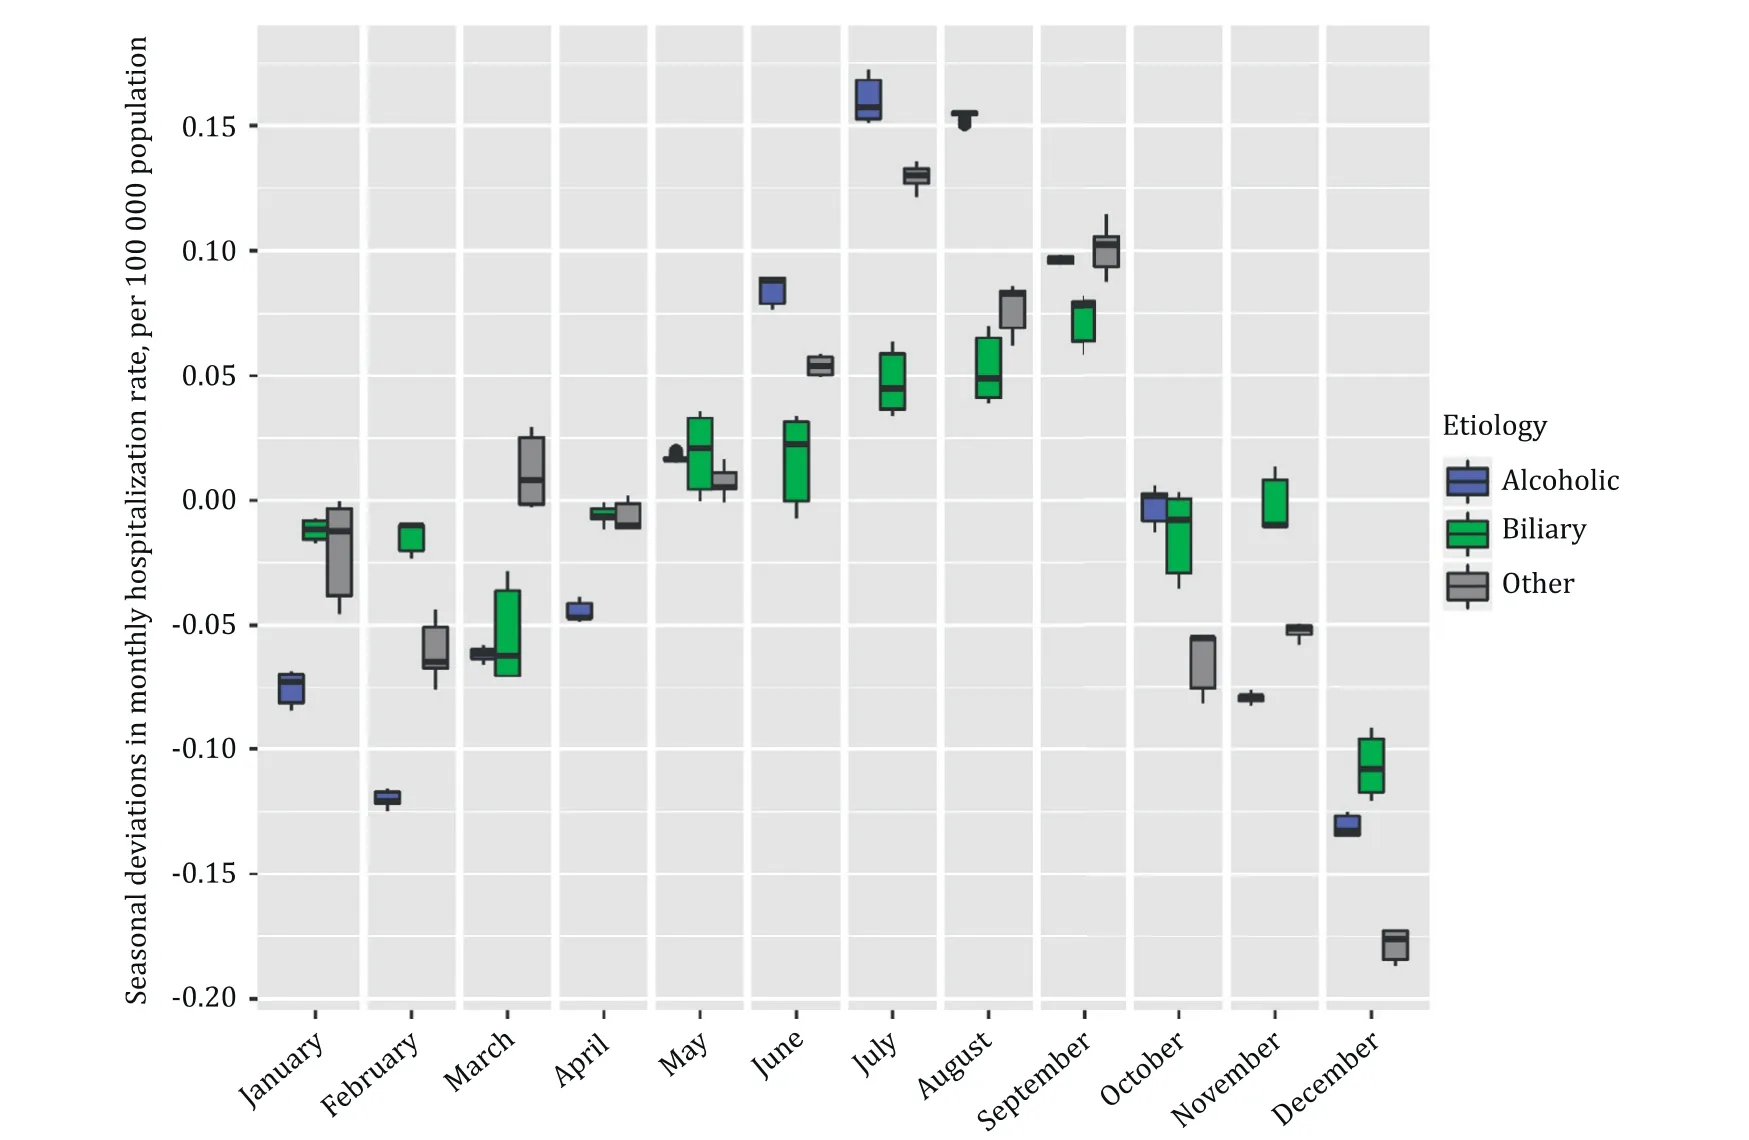
Fig.3.Seasonal variation in hospitalization rate for AP,per 100 000 population.Zero represents annual average.AP:acute pancreatitis.
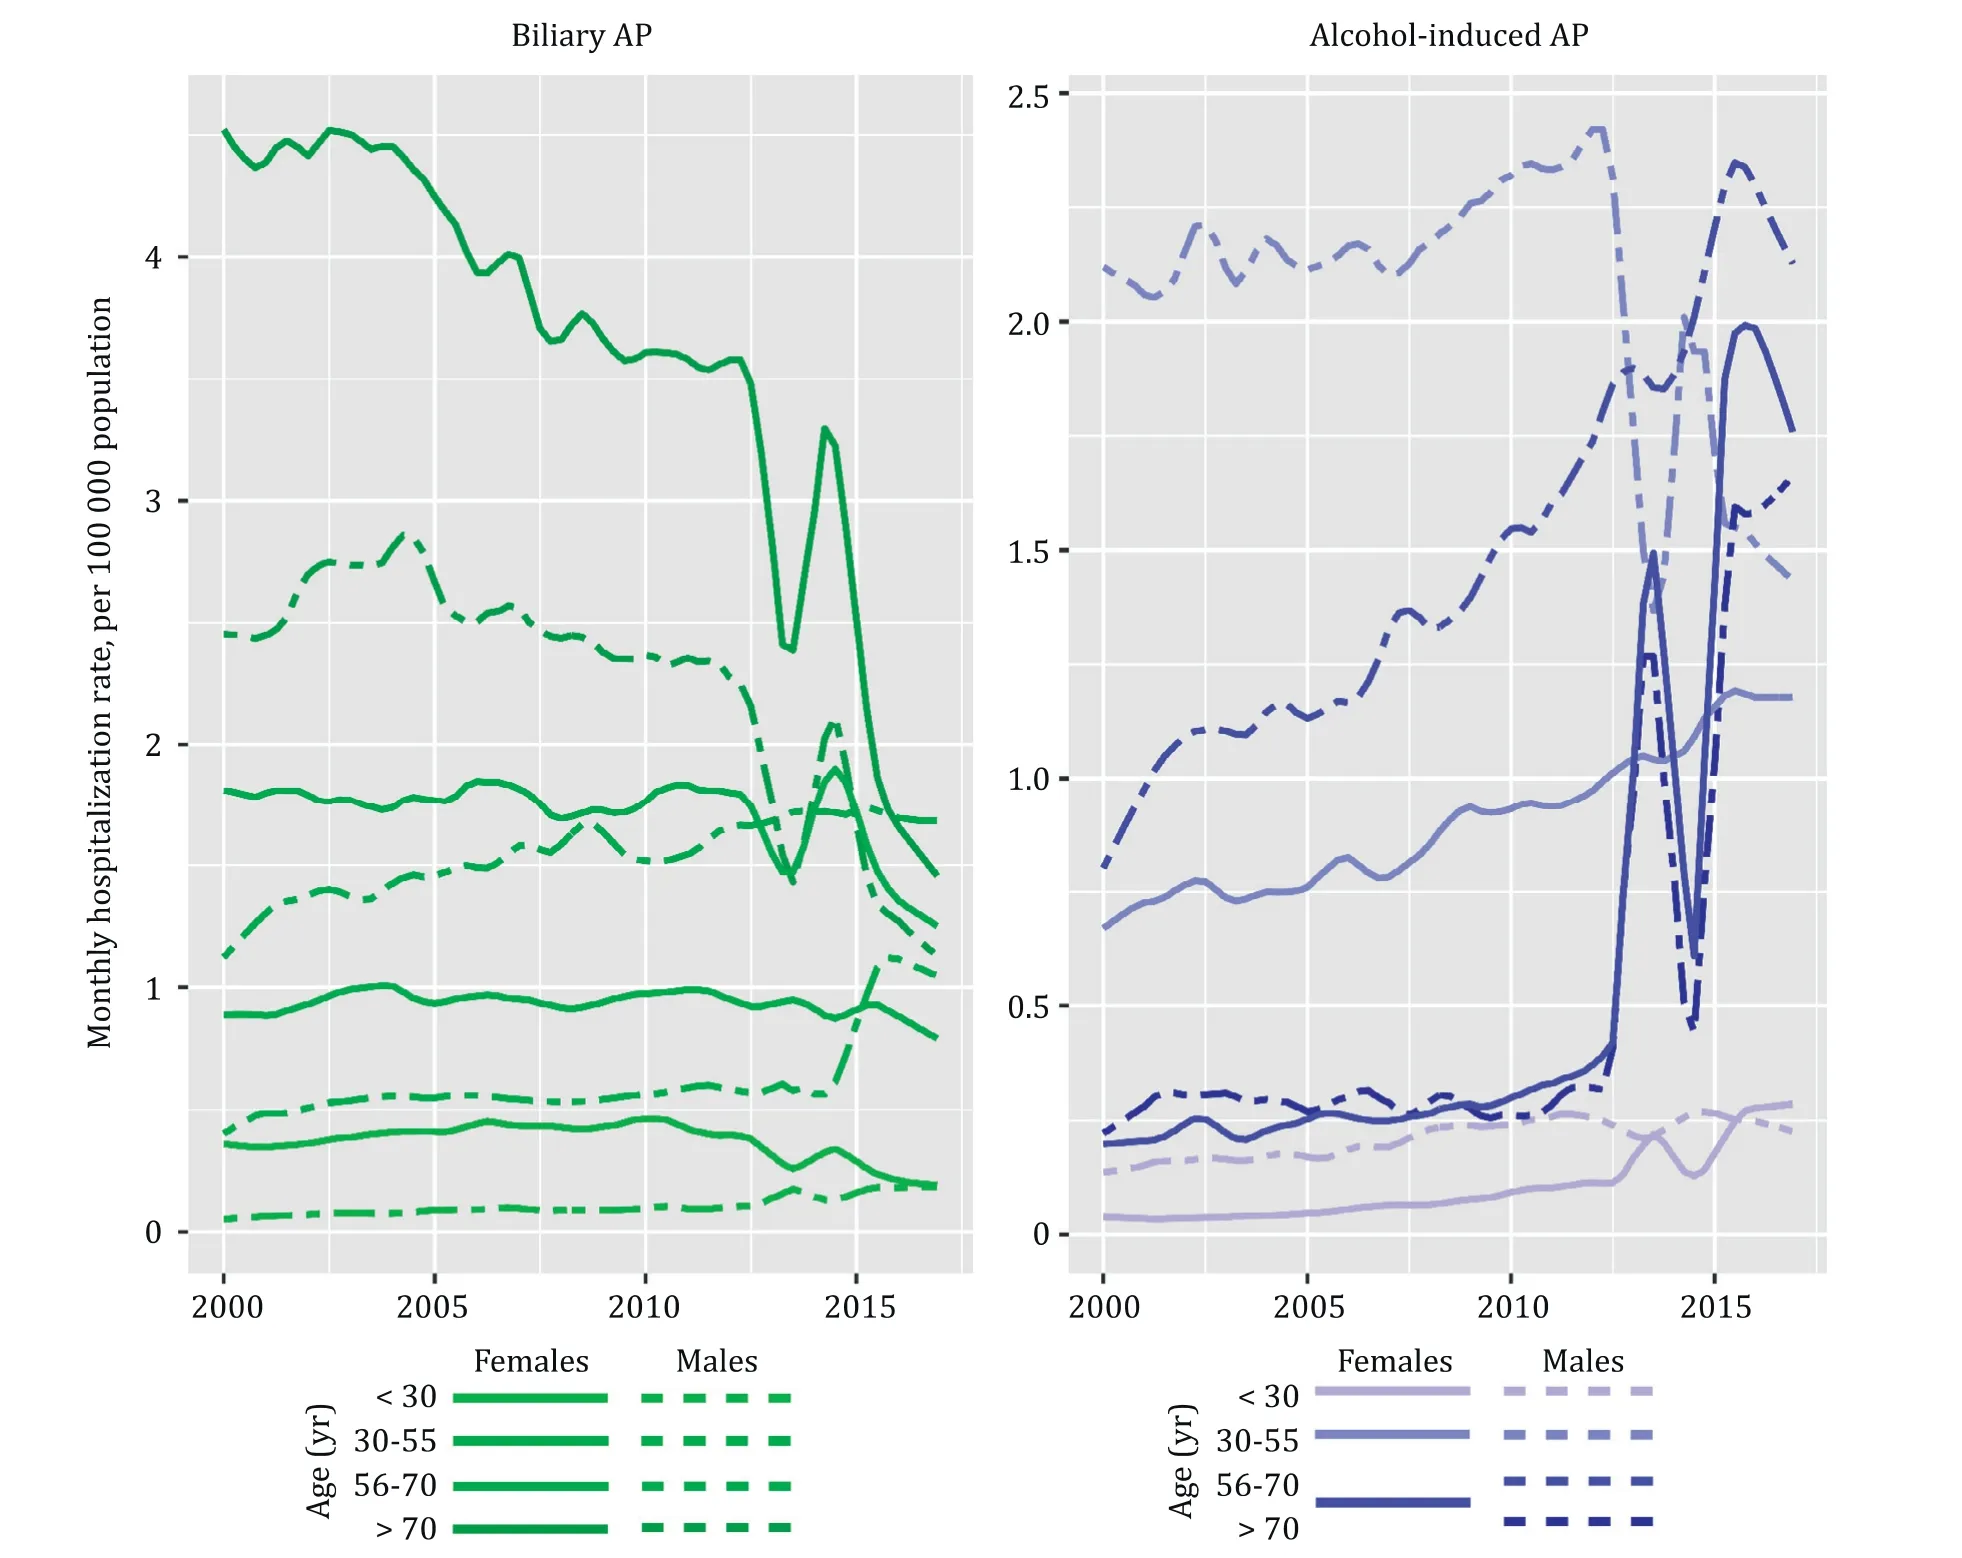
Fig.4.Trends of AP hospitalization rate for alcoholic and biliary AP by sex and age group (NIS,20 0 0–2016).AP:acute pancreatitis.
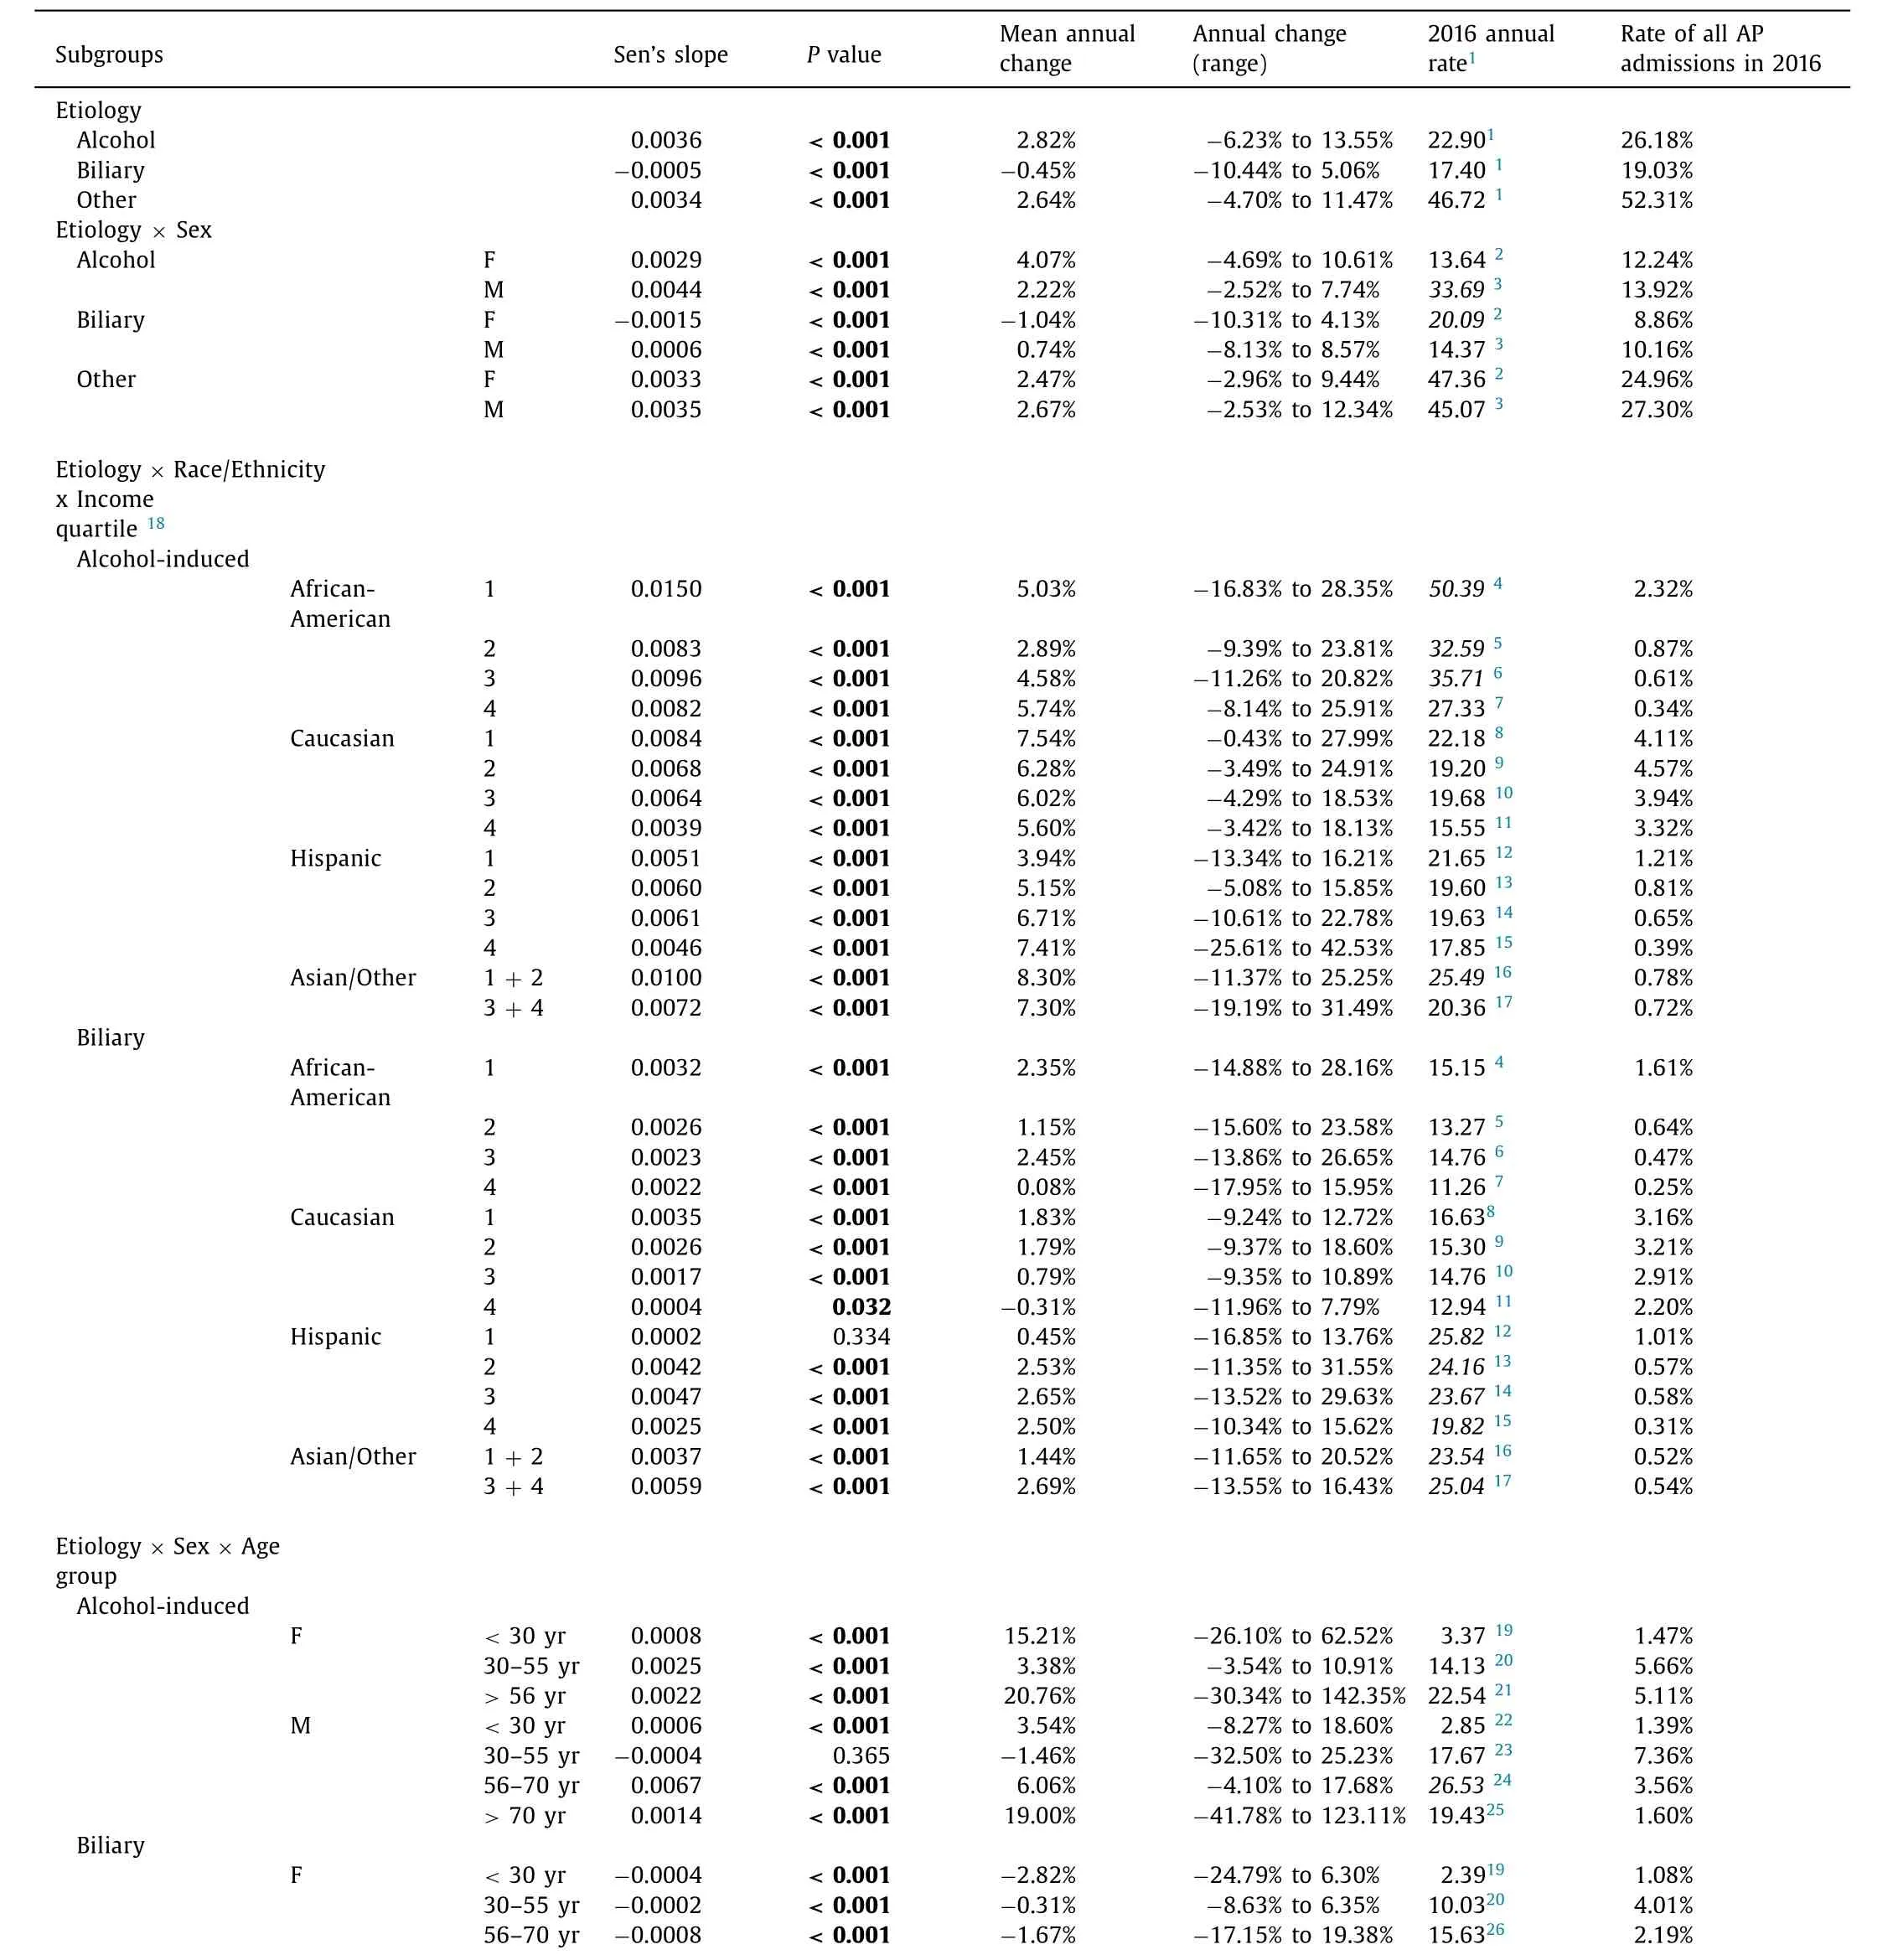
Table 2 Hospitalization rates for AP with annual changes (subgroups analysis;20 0 0–2016).
The highest AP incidence was noted in the Southeast,Central East,Appalachian areas,and some New England states,but the location of states with highest incidence of AP did not necessarily correlate with state-wise distributions of BAP or AAP.Not surprisingly,states with the highest AAP fraction generally were states with highest alcohol consumption.Western states had some predisposition to BAP but the Hispanic population did not.AAP was more abundant in Northern,particularly Northwestern states,and in New England which did not correlate with distribution of AA population.Lack of a correlation of BAP/AAP distribution with racial state-wise population structure is expected,as the Caucasian population is still the main contributor to overall AP burden.

Table 2 (continued)
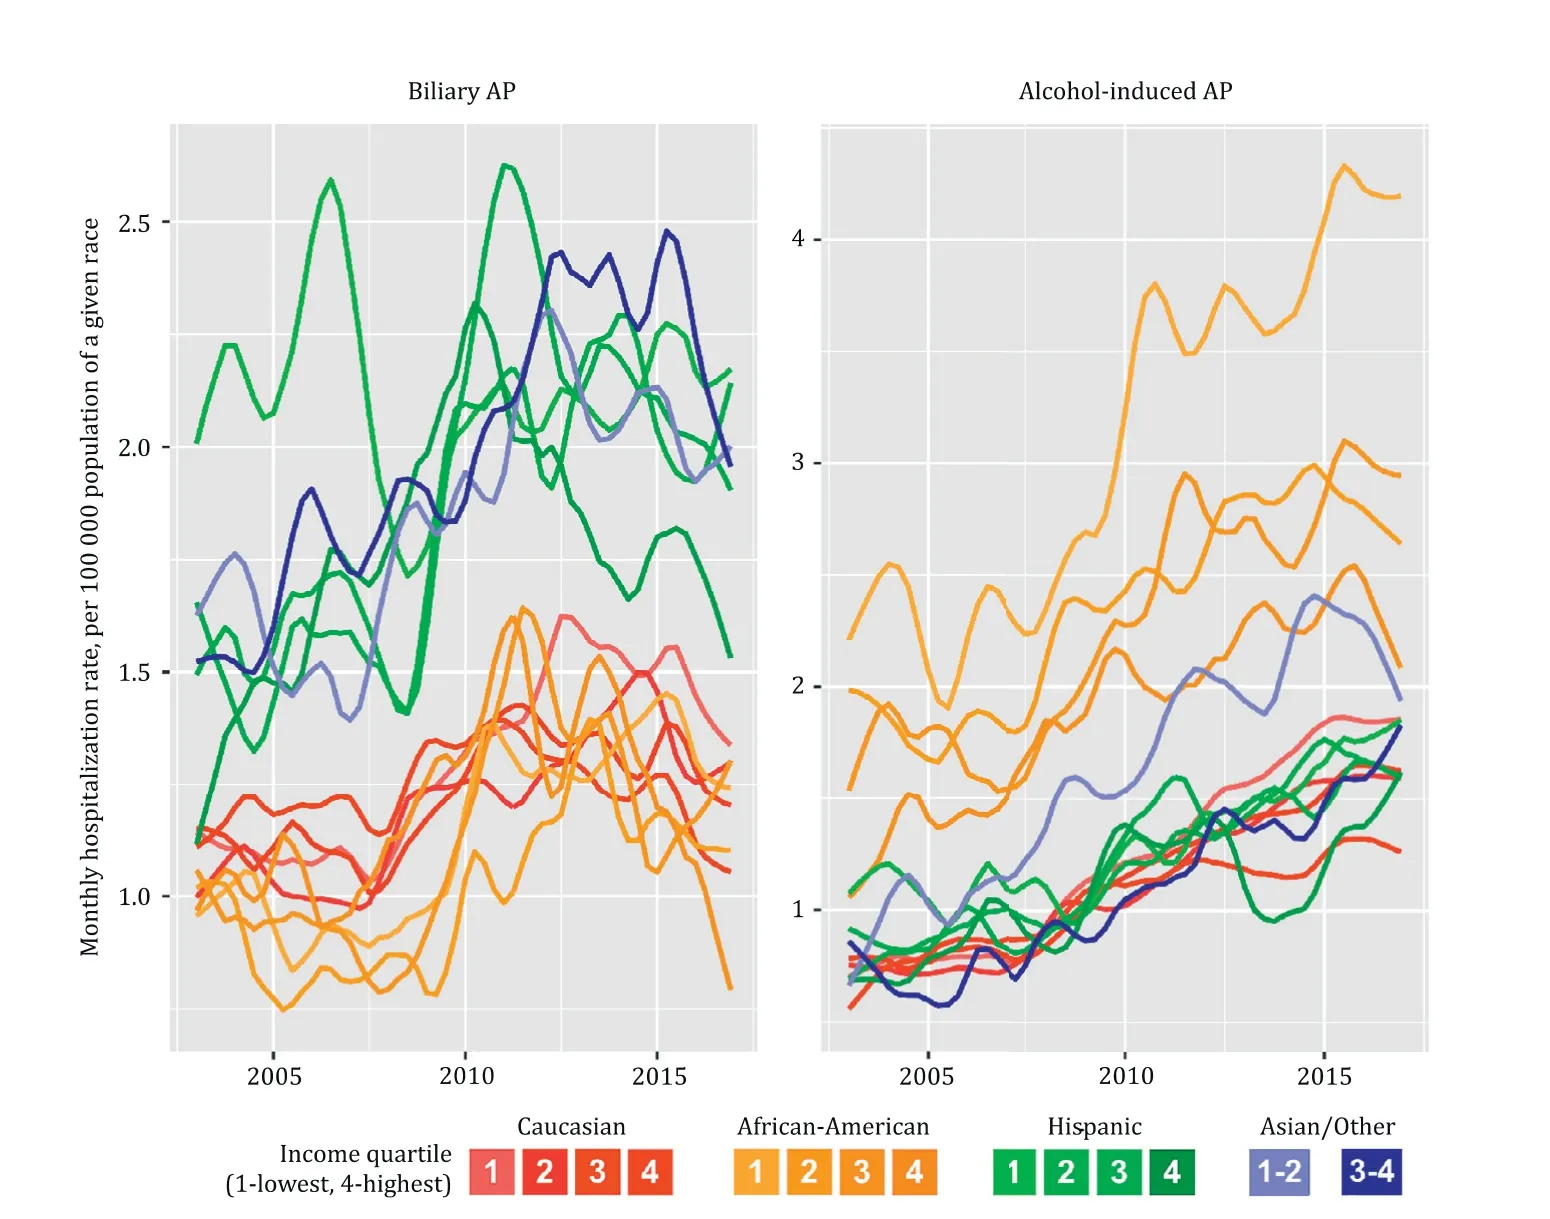
Fig.5.Trends of AP hospitalization rate for alcoholic and biliary AP by race and income quartile (NIS,2003–2016).AP:acute pancreatitis.
Stratified analyses uncovered discrepancies in overall incidence and in trends in incidence.Between 2008 and 2009,incidence of BAP and AAP crossed and since then AAP increased in all racial and SES groups and particularly in males aged 56–70 years,individuals of>70 years old of both sex,and to a lesser degree,in middleaged females.The origin of the rapid increase in AAP incidence in older adults after 2012 is likely related to overall increase of alcohol intake in this age group,including binge drinking,especially in females [29].Interestingly,there is a concomitant decline in AAP in males aged 30–55 years,the group with the highest contribution to overall AP incidence.The observed changes in AAP incidence are most likely linked to changes in alcohol consumption in different subpopulations.Thus,the most significant increase in alcohol intake during last decade was reported in females overall,A-As,and individuals aged>50 years (particularly those aged 65 years and older) [29].
Interestingly,BAP incidence trendlines in Asians and Hispanics separated from Caucasians and A-A,regardless of SES.Conversely,SES significantly stratified AAP in the A-A and Asian population,which held the highest observed AAP incidence compared to other races.The effect of low SES on AAP incidence was also demonstrated in a UK study [4].This effect of SES seems to be related to reported increase of alcohol consumption in individuals of lower income (22% increase in the lowest income group,vs.3.3% increase in the highest),in individuals with lowest education level (20.3%increase in those with less than high school level,vs.6.8% in those with college degree or above),in widowed,divorced or separated individuals (18.3% increase,vs.9.3% in never married) [30].Expectedly,Caucasians,regardless of SES,contributed to the total AP incidence the most,representing the proportion of Caucasians in the USA.The population with the most rapidly growing AP incidence is A-A,and that applies exclusively to AAP.
Seasonal variation has been studied in several countries,but relatively less extensively in the USA.In this study,we found that sex-and etiology-stratified analyses revealed the most prominent seasonal variations in the incidence of AAP among males,which sharply peaked in July and decreased in December and February;the same distributions were observed in females with AAP,but to a lesser extent.Female BAP peaked from August through September,while male BAP demonstrated minimal seasonal variation (Fig.S3).The literatures reported several different patterns of seasonal variation in AP incidence:a winter holiday peak in the UK [4],an early-spring peak in Italy [6],a summer peak in AAP in Finland [ 14,31 ],spring,autumn,and festival seasons peaks in Shanghai,especially in biliary and hyperlipidemic AP [8],and an early-fall increase in Southern Germany [1].The finding of seasonality in AP is not uniform,however.For example,a German study(1987–1995,n=263) did not demonstrate any significant seasonality or correlation of incidence with certain days of the week or weekends or holiday seasons [1],and a Sweden study (2003–2012,n=1457) similarly reported no seasonal differences in AP incidence and no correlations with holidays seasons [17].
This study had several limitations.First,like all studies based on billing or administrative data,this one relied on coding which is prone to human error.Several reviews of diagnostic codes for AP performance have been published,including most recently a 2018 meta-analysis that reported crude pooled positive predictive value of ICD codes for AP as 71% (79% in a subgroup analysis of studies that used the Atlanta definition of AP) [32].However,neither this meta-analysis,nor any other papers known to us,specifically validate diagnostic codes for specific AP etiologies,including AAP and BAP [33].
Another possible limitation is the high proportion (~50%) of the mixed group of“other”AP patients which may include undiagnosed microlithiasis,alcohol abuse,or hypertriglyceridemia [34].Utilization of stricter criteria for classification of AP as biliary or alcoholic,compared to a similar prior NIS study [7],may explain the decreased observed incidence of BAP and AAP;the incidence of total AP cases was comparable to other reports and to AHRQ HCUPNet [1].Inclusion in this study of only admissions with a primary diagnosis of AP yielded,for example,a rate of 87 admissions per 10 0 0 0 0 in 2012.By inclusion of patients with non-primary diagnosis of AP,hospitalization rate in 2012 will yield 138 per 100 000.Furthermore,AP that develops during admission for other primary reasons,such as a complication of ERCP,would not be captured as a primary diagnosis.
This study was limited to the USA with its unique racial and ethnic composition.Although the epidemiology of alcohol use is different among different countries,our observed highest rates of AAP in the populations of lowest income might well be universal across other countries [4].
Based on these data,it is difficult to suggest a consistent theory explaining the increasing trend in AP incidence and its strong predilection to occur in the summertime,particularly in AAP and in certain demographic and economic stratifications.It is important to keep in mind that retrospective data analyses,even the more rigorous time-series analyses performed in this study,cannot determine causality.Yet,one may speculate that possible explanations for the well-known summer peaks of acute surgical conditions include circulating gastrointestinal infections and air pollutants or allergens leading to lymphoglandular hyperstimulation,dehydration with thickening of secretions,changes in diet,and others.Additional studies are necessary to uncover other etiological factors.The analysis of smaller,prospectively enrolled,and factor-matched AP cohorts can potentially elucidate AP incidence peaks.
AP is a growing problem which presents a significant healthcare burden.Its incidence is heterogeneous in sex,racial and SES groups,and particularly vulnerable populations are identifiable.The most significant contribution to the overall rise in incidence of AP is due to AAP,particularly in A-A,populations of lower income,and males aged 56–70 years.Therefore,alcohol abuse counseling should be encouraged at different levels,including medical teams and abuse specialists,social workers in the hospital,social services and governmental bodies,volunteers,and Alcoholics Anonymous activists post-discharge.By better control of alcohol abuse,particularly in socially deprived populations,one may expect to see decreased overall AP incidence and associated expenses.
Our additional finding of prominent AP seasonal variation with a predisposition to summer months supports the increasingly recognized phenomenon among other acute care emergency surgery diseases.Hospitals administration aware of this summer surge may therefore allocate staff and surgical beds accordingly.Probable causative factors of the seasonal patterns are suggested but need validation.
Acknowledgments
None.
CRediT authorship contribution statement
Artem Shmelev :Conceptualization,Data curation,Formal analysis,Investigation,Methodology,Visualization,Writing -original draft,Writing -review &editing.Anne M Sill :Data curation,Formal analysis,Methodology,Software,Supervision,Validation,Writing -review &editing.Tiffany Horrigan :Investigation,Writing -original draft.Steven C Cunningham :Conceptualization,Project administration,Resources,Supervision,Writing -review &editing.
Funding
None.
Ethical approval
Not needed.
Competing interest
No benefits in any form have been received or will be received from a commercial party related directly or indirectly to the subject of this article.
Supplementary materials
Supplementary material associated with this article can be found,in the online version,at doi:10.1016/j.hbpd.2020.10.003 .
杂志排行

Hepatobiliary & Pancreatic Diseases International的其它文章
- Practice of precision surgery in primary liver cancer
- Reporting of longitudinal pancreatojejunostomy with partial pancreatic head resection (the Frey procedure) for chronic pancreatitis:A systematic review
- Hepatobiliary&Pancreatic Diseases International
- Presentation and surgical management of xanthogranulomatous cholecystitis
- Transjugular intrahepatic portosystemic shunt is effective in patients with chronic portal vein thrombosis and variceal bleeding
- Long-term follow-up of HCV patients with sustained virological response after treatment with pegylated interferon plus ribavirin