Comparison of early stage SD-OCT findings in patients with primer open angle glaucoma and Parkinson’s disease
2021-05-10KenanDaˇgdelen1。SemraArSevingil
Kenan Daˇ gdelen 1。Semra Ar Sevingil
Abstract
INTRODUCTION
Glaucoma is an extensive public health problem due to its being the leading cause of irreversible blindness in the world[1]. Glaucoma is a progressive optic neuropathy characterized by increased intraocular pressure and then progressive damage and death of retinal ganglion cells (RGC) associated with vision loss[2-3]. Recent research suggests that glaucoma may be a neurodegenerative disease[3-4]. Oxidative stress may cause neurodestructive processes associated with mitochondrial dysfunction of retinal ganglion cells, and further may contribute to glaucomatous neurodegeneration[5-6].
Parkinson’s disease (PD) is also a neurodegenerative process that affects 7.5 million people around the world. PD conducts selective loss of dopaminergic neurons, commonly in the basal ganglia of the brain. Dopamine neurons in PD is observed not only in the basal ganglia but also in the retina cells and the crucial mechanism of this visual dysfunction in PD was seen retinal dopamine insufficiency. Post-mortem studies of PD retina has already confirmed reduced retinal dopamine concentration[7-9]. Non-motor symptoms in PD are an important cause of morbidity and may even precede the onset of the motor features of the disease. Visual irregularities are among the most frequent non-motor symptoms detected during the early stages of the disease[10-12].
Spectral domain-optical coherence tomography (SD-OCT) is a relatively new,noncontact, noninvasive imaging technology which allows high resolution, cross-sectional images of ocular and biological formations. SD-OCT has been reported to be useful to evaluate a change of ophthalmic conditions, including retinal diseases or glaucoma[13].
The purpose of this study is to compare morphological variances on macula and retina nerve fiber layer (RNFL) and for Parkinson and glaucoma patients which both have a parallel neurodegenerative course on ganglion cell complex in between each other and with normal healthy volunteers and thus it is aimed to make a contribution to the limited number of studies in literature.
SUBJECTSANDMETHODS
This was a retrospective study, and the protocol was approved by the Non-interventional Clinical Researches Ethics Committee of the Eskisehir Osmangazi University. Our study was conducted according to the Declaration of Helsinki.
OphthalmicEvaluationinGlaucomaPatientsandControlGroupThe patients with a diagnosis of early stage primary open angle glaucoma (POAG) and early stage idiopathic Parkinson’s disease was included at Eshiehir Yunus Emre Public Hospital from January 2016 to August 2018. Forty-eight eyes of 48 POAG patients, thirty-four eyes of 34 PD patients and thirty-seven eyes of 37 age- and sex-matched control group were included in the study. Detailed ophthalmological inspection was done on all subjects by same doctor. In all groups, those who had major sight impairment, axial length <22 mm and >26 mm, high myopia (<-5 D), high hyperopia (>+3 D) or spherical equivalent, cornea or lens opacity, vitreoretinal interface disease, optic disc anomaly, vascular and degenerative retinal diseases, secondary glaucoma, secondary PD, ocular surgery history, Stage IV-V according to H&Y Scale, other neurological diseases that can affect the visual field, amblyopia, diplopia, keratitis, history of trauma, and history of diuretics, topical or systemic steroid use were not included in the study.
POAG was diagnosed by glaucomatous visual field loss, open anterior chamber angle, glaucomatous optic nerve cupping, and intraocular pressure measured at 21 mmHg on two or more measurements without medication. Perimetry was evaluated with an automatic perimeter (Humphrey Systems Field Analyzer Model II 750, Zeiss, USA) using 24-2 mode, and MD (Mean Deviation) value on perimeter was saved. Primary open angle glaucoma patients selected according to MD values, with the early stage as MD smaller than -6 dB. Patients with MD values below -6 dB were considered as early stage glaucoma. The control group was chosen among healthy volunteers, who had a 20/20 vision, who did not have any eye pathology, and who were age and sex-matched with the POAG and PD groups.
NeurologicalEvaluationsDetailed clinical neurological examination and history was carried out for all patients by neurologists. Hoehn and Yahr (H&Y) stage was assessed. Regarding the H&Y scale, increasing parkinsonian motor impairment was charted from unilateral (Stage I) to bilateral disease (Stage II) without balance difficulties, to the presence of postural instability (Stage III), loss of physical independence (Stage IV), and being wheelchair-bound or bed-bound (Stage V). The motor evaluation was done during OFF state using the part III of the Unified Parkinson’s Disease Rating Scale (UPDRS). Patients were incorporated if they met the following criteria: 1) Diagnosed with idiopathic PD according to the UK Parkinson’s Disease Society Brain Bank Diagnostic Criteria; 2) Stage I-III according to H&Y Scale; 3) Receiving Parkinson’s therapy or not yet started treatment.
SD-OCTMeasurementThe evaluation with OCT was carried out by an ophthalmologist by using an SD-OCT (Heidelberg Engineering, Heidelberg, Germany) without the need for pupil dilatation. RNFL and macula analysis were applied for all subjects. The thickness of four quadrants (superior, inferior, nasal and temporal) and the average RNFL thickness were determined in microns. The RNFL thickness (from the outer margin of the internal limiting membrane to the inner margin of the RNFL layer) was automatically sectioned using the Spectralis software version. The central macular thickness was determined as the distance between the ILM to the outer line of the retinal pigment epithelium via the automatic segmentation algorithms of the Spectralis software. SD-OCT indicates the outcomes of macular thickness measurements in circles of 1 mm, 3 mm and 6 mm. These are separated into 9 regions as a center circle of 500 μm radius, and inner and outer ring, each divided into four quadrants according to the Early Treatment of Diabetic Retinopathy Study (ETDRS). In total, nine macular quadrants (micron) involving the foveal region according to the ETDRS template were measured and average macular thickness (micron) were recorded during macula analysis. The high obtaining speed of 40,000 A-scans/second prevents artifacts from micro-saccades and develops image definition. The automatic eye tracking technology keeps fixation on the retina. Only well-focused images with a signal strength of >20 dB were used for evaluations. Each scan was inspected by two independent observers for the automatic segmentation.
StatisticalAnalysisStatistical analysis was performed by using the SPSS (Statistical Package for Social Science, Chicago, USA) 22.0 for Windows program. Descriptive statistics were presented with percentage, frequency, mean, and standard deviation.χ2(Chi-square) test was used to evaluate the gender and eye distribution in groups. K-Mann WhitneyU-test was used to test if the mass was different from the group average value. Kruskall WallisH-test was used for three-stage group and Mann WhitneyU-test was used for paired comparison (post-hoc comparison) and for all combinations of paired comparisons and the determination was corrected according to the critical value of group number. Dates were reported as mean values±standard deviation. APvalues of less than 0.05 were considered as statistically significant (α=0.05).
RESULTS
Forty-eight eyes of 48 POAG patients, thirty-four eyes of 34 PD patients and thirty-seven eyes of 37 age- and sex-matched control group were included in the study at Eskiehir Yunus Emre Public Hospital from January 2016 to August 2018.
In terms of meanage (P=0.51), gender (P=0.86) distribution, right-left eye distribution (P=0.88) statistically significant difference was not observed in PAOG, PD and control groups (P>0.05). Similarly, in terms of central cornea thickness evaluation (P=0.43) and spherical equivalent measurement (P=0.09), a significant difference was not observed in study groups (P>0.05). Intraocular pressure value which was evaluated by using Goldman applanation was measured significantly higher in POAG group than PD and control groups (P=0.01,P<0.05). The mean intraocular pressure measurement of Parkinson’s group was measured higher from the control group but the difference was not statistically different (P>0.05). The general characteristics of these subjects were shown in Table 1.
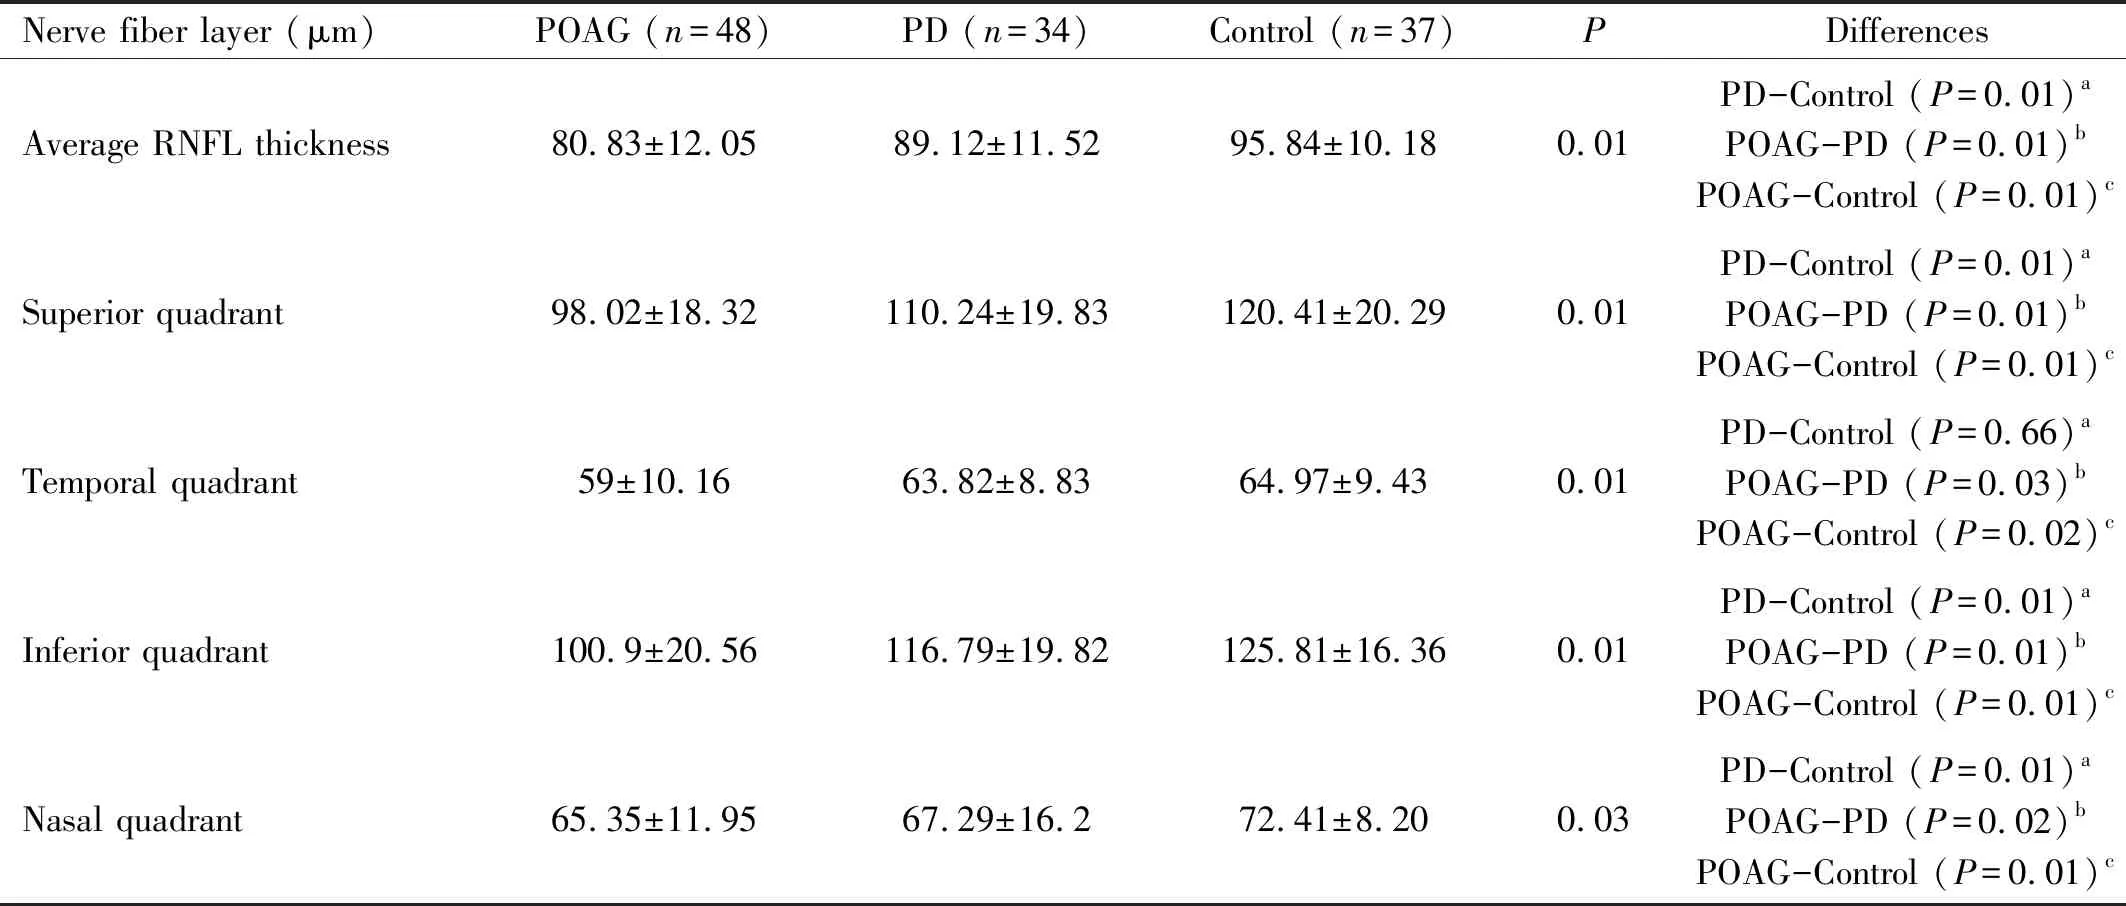
While comparing RNFL thickness parameters of groups,the statistically significant difference was detected between the groups mean, superior, inferior and nasal quadrants (P=0.01,P=0.01,P=0.03 respectively,P<0.05). However, there wasn’t any statistically significant difference detected between PD and normal group in temporal quadrant (P=0.66,P>0.05), but statistically significant difference was detected between POAG and PD, POAG and control groups (P=0.03,P=0.02, respectively,P<0.05) (Table 2).
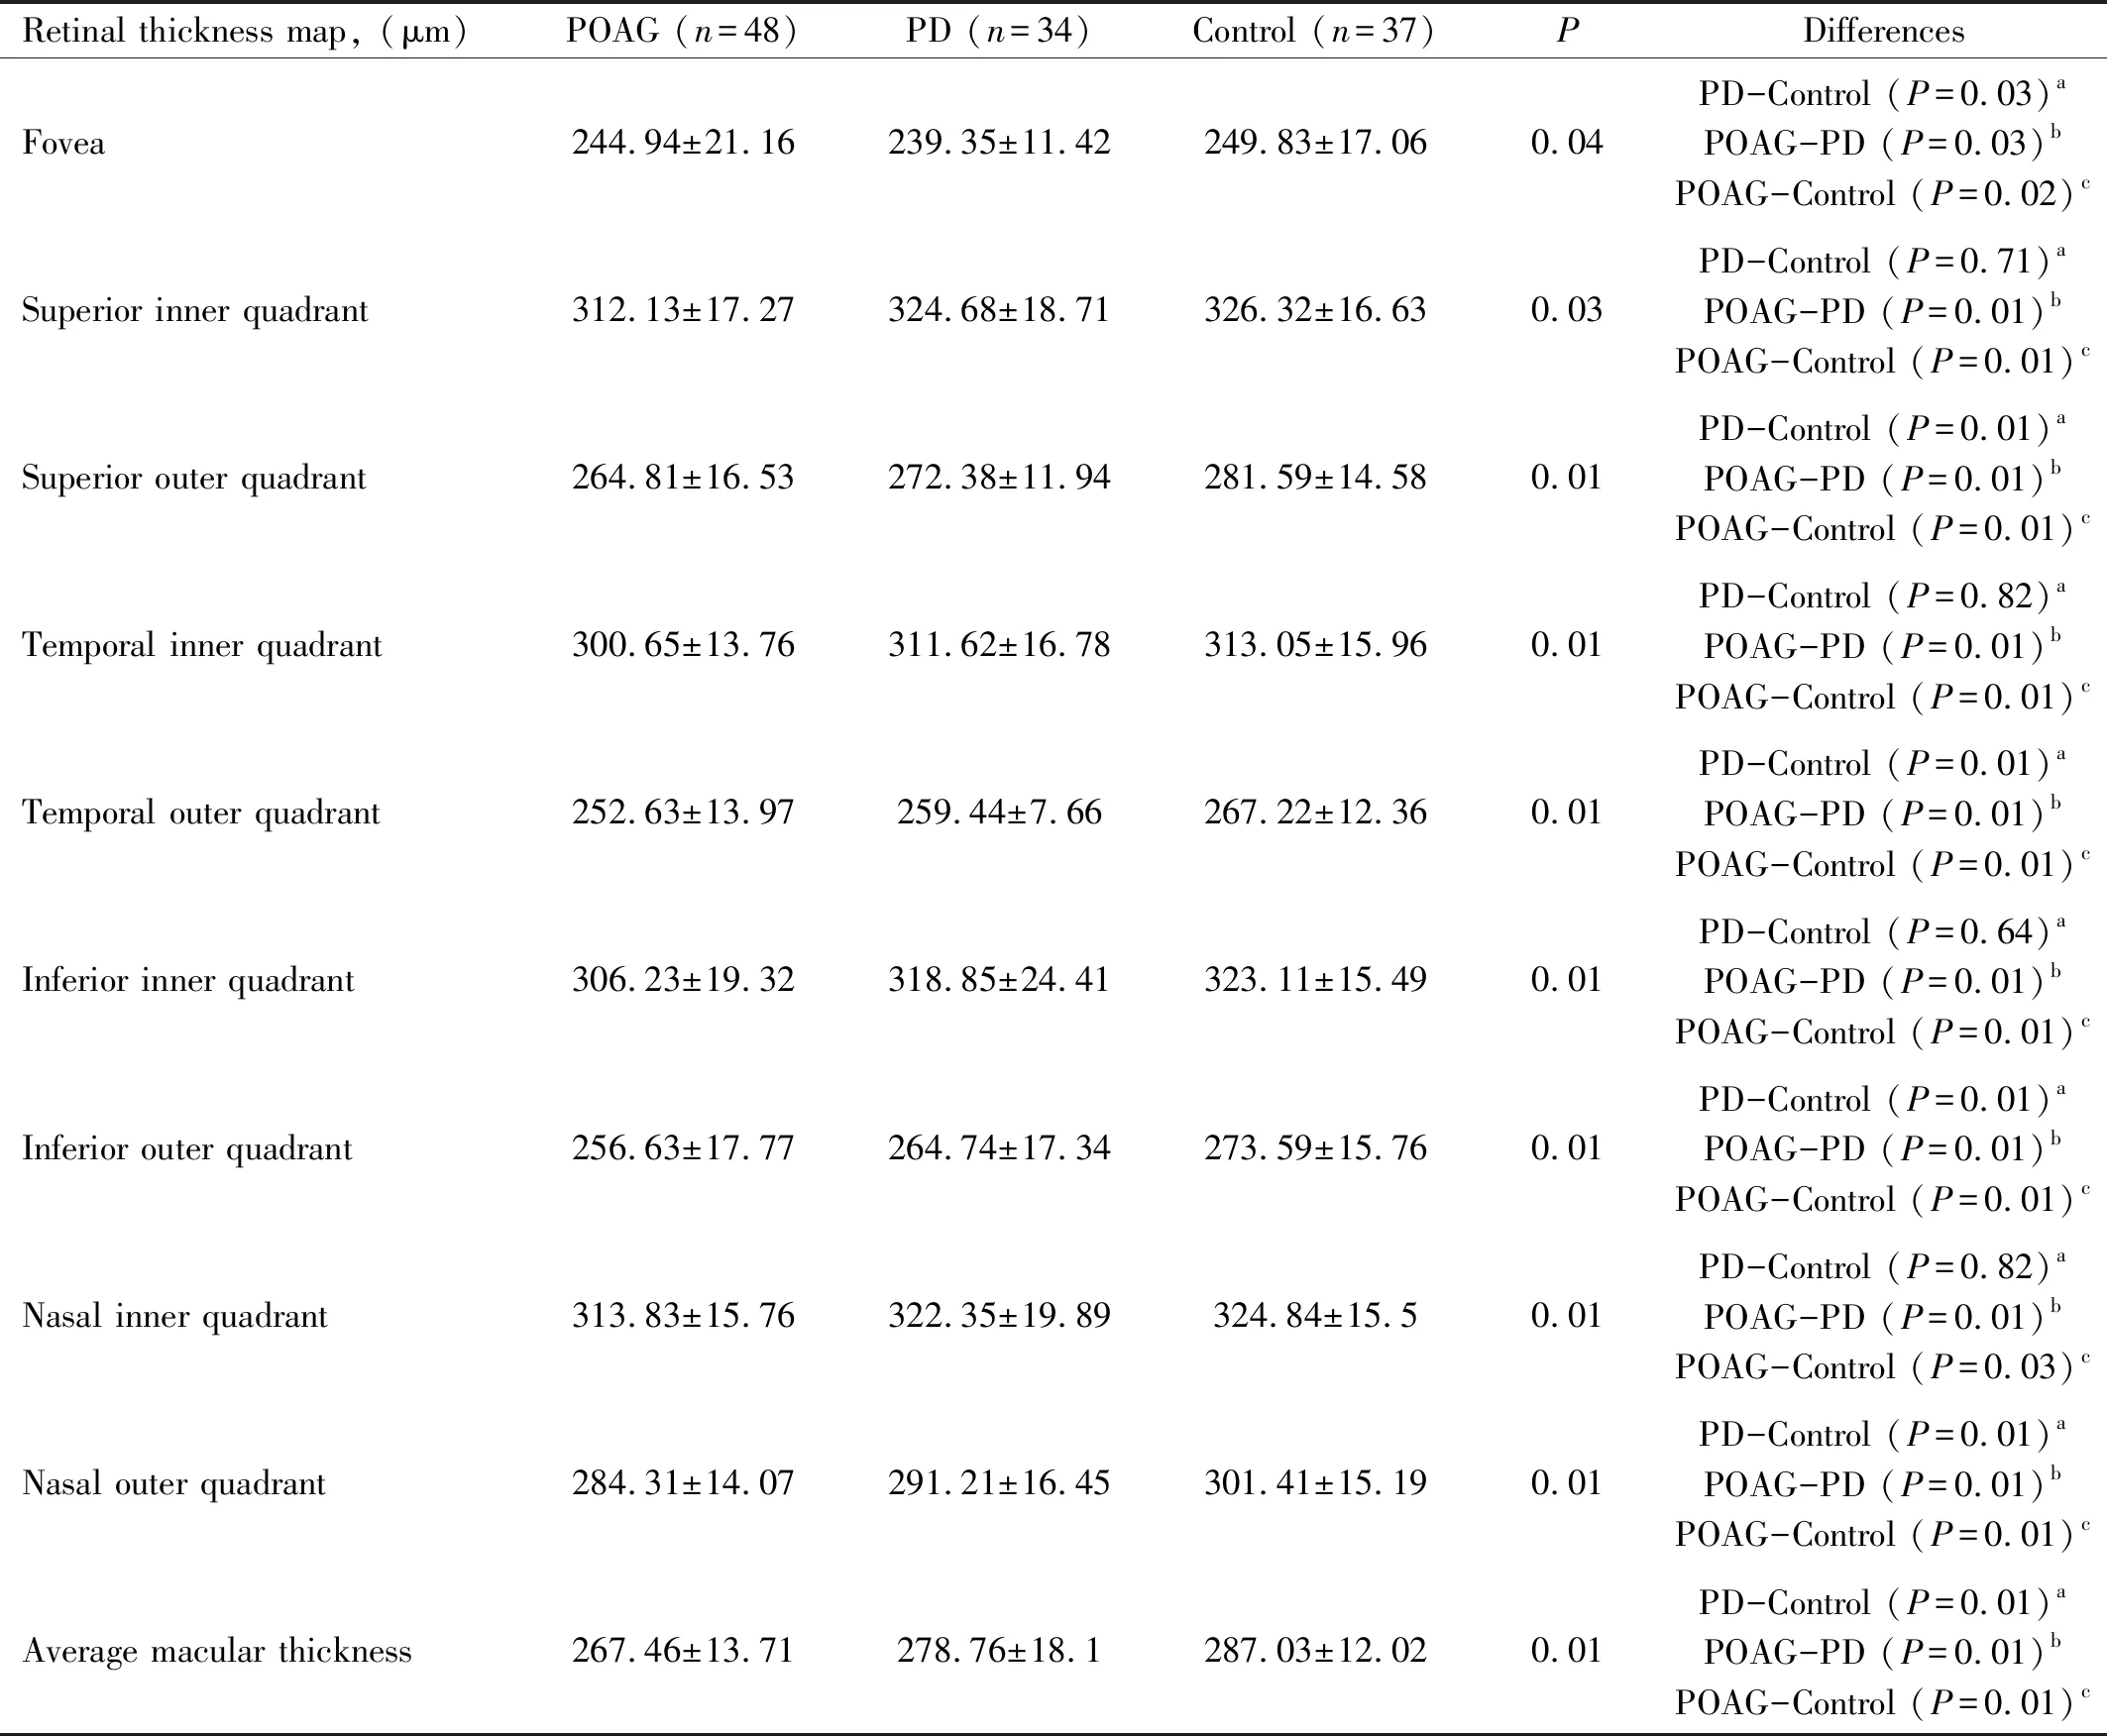
While measuring macula thickness maps of groups according to ETDRS template, for fovea (P=0.04), all outer quadrants (superior, temporal, inferior, nasal) (P=0.01,P=0.01,P=0.01,P=0.01) and mean macula thickness measurements (P=0.01), statistically significant difference was detected between all groups (P<0.05). For all evaluated inner quadrants (superior, temporal, inferior, nasal), macula thickness of patients with POAGD was detected statistically thinner than both PD (P=0.01,P=0.01,P=0.01,P=0.01) and control group (P=0.01,P=0.01,P=0.01,P=0.03); there was not any significant difference between PD and normal group (P=0.71,P=0.82,P=0.64,P=0.82) (Table 3).
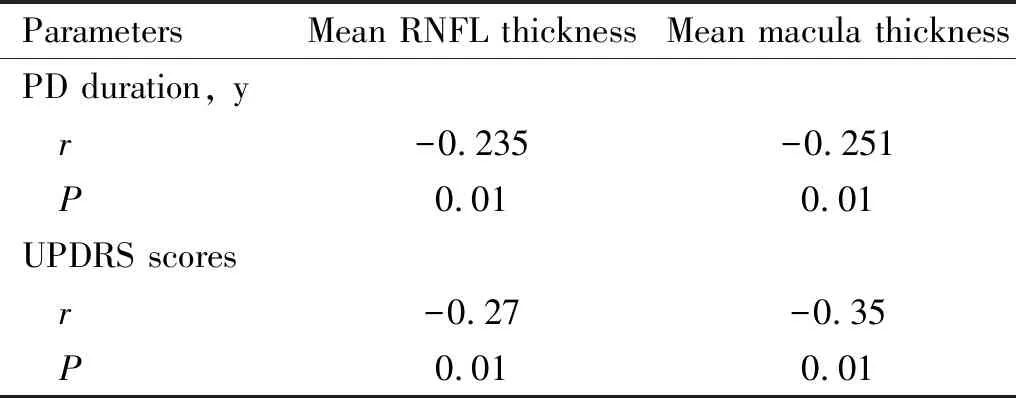
We detected that the disease duration had a weak negative correlation with average RNFL and macular thickness in patients with PD (r= -0.235 andr= -0.251 respectively,P=0.01). The UPDRS score also had a weak negative correlation with average RNFL and macular thickness in patients with PD (r= -0.27 andr= -0.35 respectively,P=0.01) (Table 4).

Table 2 Investigation of retinal nerve fiber layer measurements in groups Mean±sD

Table 3 Macular thickness measurements in groups Mean±SD

Table 4 Correlation between duration of disease, UPDRS Score, and Mean OCT parameters in the PD(n=34)
DISCUSSION
Glaucoma, the major irreversible cause of blindness worldwide, has a predicted prevalence of 60 million people, cause to 8.4 million people with blindness. These figures have been estimated to increase to 80 and 11.2 million, respectively, by 2020[14-15]. It is a disease with an optic neuropathy defined by optic disc cupping and visual field deficency. It has been assessed a neurodegenerative disease on account of its pathophysiology of progressive RGC and axon degeneration and RGC loss[16-17]. Also PD is the second most common neurodegenerative disease worldwide, affecting 1% of the population aged older than 65[18]. Abnormal collection of proteinaceous cytoplasmic inclusions, called Lewy bodies and neuritis, and dopaminergic cell loss in the substantia nigra is the defining neuropathological hallmarks. Dopaminergic cell death also determines the cardinal symptoms of tremor, rigidity, bradykinesia, and postural instability[19].
Dopamine has multiple different roles in retinal function related to cell survival, circadian rhythm, and eye growth. The special amacrine cells released dopamine in the human retina[20]. These dopaminergic cells are accumulated in the proximal inner nuclear layer, and send long processes laterally in sublamina 1 of the inner plexiform layer and into the outer plexiform layer. Dopamine modulates contrast sensitivity and color vision and through D1 and D2 receptors in the retina, which are differentially located in the retinal layers. A complete deficiency of D1 and D2 receptor activation causes to signal alterations and dispersion in contrast sensitivity and color vision[21].
In this study, the two neurodegenerative diseases were compared with SD-OCT findings.We focused only the early stage of POAG and PD, the significant difference was observed during RNFL evaluation between groups generally for all quadrants (except for temporal quadrant). Similarly in macula evaluation, the significant difference was observed between both three groups for fovea, outer quadrants and mean macula thickness. In a sub-statistical study, it was observed that thinning of both RNFL and macular map was more significant for POAG patients than PD group. Exceptionally, it is remarkable that in PD group thinning of foveal region was observed more significant than POAG.
Thinning of RNFL and macula in PD was already known from literature reviews. There is a study of Schneideretal[22]on monkeys. In four years stable PD table that they induced with 1-methyl-4-phenyl-1, 2, 3, 6-tetrahydropyridine (MPTP) injection, similar thinning of RNFL and macula quadrants was detected in PD group. Altintaetal[23]were detected mean RNFL thickness, thinning of outer macula quadrants and significant decrease for macular volume in their study. In this study, they were detected a significant inverse correlation between foveal thickness and total and motor UPDRS score. Also, they determine mid- level inverse correlation between macular volume and P100 latency. In all their recent studies, Senguptaetal[24]were determined thinning of RNFL thickness and macular thickness. In our study, thinning of superior and inferior RNFL quadrants were detected more significant between groups.

One of the important results of our study is finding fovea thickness thinner in PD group than POAG patients. As similar to our study, in a study of Mirietal[28], they detected extension of N70, P100 latency and contrast sensitivities in PD patients. They demonstrated thinning of retinal thickness on 1.5-2 mm temporal of foveola. They determined negative correlation between N70 latency and GCL-IPL thickness. In our study, thinning occurring on outer quadrants of macula was observed more significant than the inner quadrants. In our study, mean intraocular pressure was found higher than normal group but this was not detected statistically significant.
Similarly, thinning of RNFL and macula was known for patients with glaucoma. Especially macular thinning was shown to be related with RGC degeneration and loss in various studies[29-32]. However, in our study, this thinning in macula and RNFL was shown to be more significant for early stage of POAG group than early stage of PD group. This is crucial for providing an insight to pathophysiology of two diseases having a course with neurodegeneration.
Eraslanetal[33]found similar results in their study which they designed similar to our study. They detected that thickness of macula and RNFL was significantly lower in POAG patients than PD group. Additionally, they determined that global volume loss value was higher in PD group. Different from our study, they found thinning on foveal region was more significant in POAG group. There was not any correlation detected between duration of disease and UPDRS scores with OCT parameters. Different from this study, only early stage of POAG and early stage of PD patients were evaluated in our study. Matlachetal[34]in their similar study of which they compare OCT findings of PD and glaucoma patients they found different results. In this study, RGC was not found statistically significantly different in any of the quadrants for PD patients than healthy group. However, the ipsilateral eye to the most-affected body side with bradykinesia in PD patients had a statistically significant thinner superior RNFL compared to healthy controls. There was no significant correlation between RNFL or RGC and disease severity; also, their study did not indicate a correlation between disease duration, dopamine dose, olfactory testing and SD-OCT result. Findings of our study wasn’t support the results of this study.
In conclusion, thinning of RNFL and macula is quite remarkable for POAG and PD patients which are the two neurodegenerative diseases having a course with RGC loss. By using SD-OCT similar thinning was detected on thickness parameters of macula and RNFL for early stage of POAG and early stage of PD group. However, in early stage of POAG group this thinning was more significant. It can be declared that, neurodegeneration on macula due to glaucoma was more destructive than PD. Generally, none of the data obtained by using SD-OCT is specific for PD, but thinning on foveal region is remarkable. Patients can be diagnosed at an early stage prior to the development of functional damages. However, limited numbers of studies focus on the early stage in the literature and the conflicting findings of existing studies necessitate further studies.
LimitationsofourStudyThe study was ignored whether the participants received drug treatment for PD. Also, retrospective study and small sample size was the major limitation. The study population was heterogeneous with respect to the stage of the disease severity and duration of disease. A longitudinal follow up study of a larger population of patients with similar stages and severity scores will be very useful in ascertaining the changes that occur with time in both the RNFL and macular thickness. Also, medication should be considered for the future studies. Further investigations are needed to establish the diagnostic and prognostic role of OCT analysis of macular thickness in an appropriate long-term follow up of a larger PD population.
