An Eco-Route Planner for Heavy Duty Vehicles
2021-04-14MariaPiaFantiFellowIEEEAgostinoMarcelloManginiMemberIEEEAlfredoFavenzaandGianvitoDifilippo
Maria Pia Fanti, Fellow, IEEE, Agostino Marcello Mangini, Member, IEEE,Alfredo Favenza, and Gianvito Difilippo
Abstract—Driving style, traffic and weather conditions have a significant impact on vehicle fuel consumption and in particular,the road freight traffic significantly contributes to the CO2 increase in atmosphere. This paper proposes an Eco-Route Planner devoted to determine and communicate to the drivers of Heavy-Duty Vehicles (HDVs) the eco-route that guarantees the minimum fuel consumption by respecting the travel time established by the freight companies. The proposed eco-route is the optimal route from origin to destination and includes the optimized speed and gear profiles. To this aim, the Cloud Computing System architecture is composed of two main components: the Data Management System that collects, fuses and integrates the raw external sources data and the Cloud Optimizer that builds the route network, selects the eco-route and determines the optimal speed and gear profiles. Finally, a real case study is discussed by showing the benefit of the proposed Eco-Route planner.
I. INTRODUCTION

In this context, Ahn and Rakha [1] investigate the impacts of route choice on vehicle energy consumption and emission rates for different vehicle types. They demonstrate that the faster highway route choice is not always the best from an environmental and energy consumption perspective. For this reason, in the recent years some studies are developing a new environmentally navigation concept called eco-routing. The eco-routing is the identification of the most energy-efficient route for a vehicle to travel between two points and is offered as a way in which drivers can reduce fuel consumption [3]. In the simulation results presented in [2], the authors establish that eco-routing systems can reduce the fuel consumption in most cases and quantifies the fuel savings in the range between 3.3% and 9.3% with respect to typical travel fastest routes on two large metropolitan networks.
Recently, the eco-routing strategies can take advantage by information technology solutions, mainly in the area of advanced traveler information systems. Now, many navigation systems can transmit to the drivers a route selection within a roadway network (shortest and fastest routes, toll routes, etc.)that considers traffic data, accident occurrence, congestion [4].
In this research area, [5] and [6] show by simulation studies that there is a big potential to save energy using eco-routing concepts and traffic data. However, these studies do not present approaches to find optimal routes but only test some routes measuring fuel consumption. Moreover, the authors in[7] determine for the pair origin-destination a Pareto frontier containing optimum solution paths. However, the optimum solution paths are derived by a bi-objective problem minimizing distance and time.
Moreover, [8] and mainly [9] propose an energy optimal real time navigation system for electric vehicle focused on energy optimal route calculation. In particular, [9] uses Internet and smart devices to take data about road slope,traffic conditions and speed limits. In addition, the longitudinal model of the electric vehicle is determined to optimize speeds by a look-ahead concept. However, the authors do not consider weather conditions and the route network used to determine the optimal eco-route is assumed given.
Furthermore, the traffic and geographical information of the road networks require large storage units, and the search algorithms for global optimization may require high computation power, which is not available on current vehicle computing units [4], [6].
Street slope is an important factor that should be considered in an eco-routing strategy. The authors of [10] use a 3D routing model to determine eco-friendly routes for transportation and distribution of goods in urban areas: the street gradient is factored in the estimation of the fuel consumption, which is performed using an Emission Estimation Model based on COPERT III, a computer software able to determine routes between two points and emissions[11]. In addition, [12] solves the eco-routing problem for HEVs in urban areas, at the same time by optimizing the power train control. Driving conditions are considered in [12]and [10], but all computations are performed in a static scenario, without using real-time data, and with fixed origin and destination. Moreover, a personalized energy consumption analysis and prediction framework are proposed in [13] to estimate future energy consumption and the speed of a vehicle. An accumulation energy consumption index is predicted based on the features of the driving behavior for both petrol and electric vehicles. In the same field, [14]develops an online driving cycle prediction method for hybrid electric vehicles based on a three-dimensional stochastic Markov chain model and applies the method to a drivingcycle-aware energy management strategy.
Dynamic traffic environments are considered in [15], which applies Reinforcement Learning to generate the eco-route, in such a way to adapt the algorithm to varying traffic conditions. However, [15] is not targeted specifically to HDVs and uses the Handbook Emission Factors for Road Transport consumption model [16] that is based on a statistical estimation of consumption. In addition, in [17] a fairly accurate vehicle model is used and travel time budget is considered in the optimization model. However, the speed profile is not optimized and the average link speed is used in the calculations.
The authors of [18] and [19] propose a dynamic programming algorithm that allows optimizing the speed profile by associating a graph to the route and the velocities to the graph nodes. Successively, Ozatay et al. [20] utilize the DP algorithm also considering traffic and geographical information. However, the last papers do not find the optimal eco-route. On the contrary, the work [21] proposes an algorithm to predict the eco-route and the optimal speed profile for electric vehicles in a bi-objective eco-routing problem, which takes into account energy and travel time.Also, in [22] the problem of constrained eco-routing is assessed, considering state-of-charge constraints for electric vehicles. The same problem is studied in [23] that includes state-of-charge constraints by using lexicographic product of graphs. Nevertheless, [21], [22] and [23] consider electric vehicles and there is a lack in the related literature of ecoroute strategies devoted to HDVs.
This paper is a contribution to overcome such a gap and proposes a cloud based Eco-Route Planner that is devoted to suggest to the HDV driver the optimal eco-route with the optimal speed and gear profiles that minimize the fuel consumption by respecting the time constraints imposed by the fleet company. The Eco-Route planner is composed of two main systems, the Cloud Computing System and the On-board System. In particular, the On-Board system communicates to the driver the optimal routes and the velocity profiles and sends to the Cloud Computing System the information coming from the on-board components and sensors.
Moreover, the Cloud Computing System includes a Data Management System (DMS) and a Cloud Optimizer (CO),which in turn are made up of a set of components shown in the scheme of Fig. 1. The DMS manages the big data coming from the external services and necessary for the Cloud optimizer. To this aim the paper describes the complex architecture of the data manager and the cloud based optimizer. The proposed cloud-based architecture is able to provide a scalable service, adapting its capability in real time according to actual request volumes of a fleet management system. The DMS is described by characterizing the main components that allow collecting, fusing and consuming the large and heterogeneous sets of data: the Data Storage Component (DSC) (including the Services Data Storage - SDS and the Planning Data Storage - PDS), the Business Logic Component (BLC) (including the Service Data Manager -SDM and the Planning Data Manager - PDM) and the Mission Dashboard.
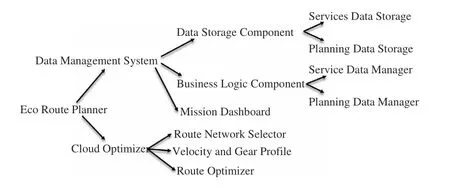
Fig. 1. Eco-Route planner scheme.
Moreover, the CO determines the optimal eco-route and speed and gear profiles by integrating in the selection the predictive traffic data, the road topology and the weather conditions. In such a way the speed and gear profiles are evaluated on the basis of the predicted environmental conditions and the on-board truck conditions with the aim of minimize the emissions. Even if the speed profile is more critical than the gear profile, the considered trucks have about 15 different gears then suggesting the optimal gear is important to reduce the fuel consumption.
In particular. the CO is specified by the description of three components: i) the Route Network Selector (RNS) that builds the route graph network collecting the main possible routes from the origin to the destination; ii) the Velocity and Gear Profile Calculator (VGPC) that integrates predictive traffic,weather conditions, road topography (including slope and curve radius) on the basis of a simplified vehicle longitudinal model and builds a weighted directed graph; iii) the Route Optimizer (RO) that selects the optimal eco-route minimizing the fuel consumption by employing the built weighted directed graph. To this aim, among different algorithms for finding the shortest paths in a graph, we recall for instance recent contributions such as [24] that proposes a memetic algorithm with competition for the capacitated green vehicle routing problem and [25] that presents an arc-routing problem with time-dependent penalty cost. Since the RO has just to determine the minimum path between a weighted directed graph, the application of the Djikstra algorithm is suitable for efficiently finding the solution [26], [27].
The cloud configuration allows obtaining several road data by databases and external data services such as information about the traffic speed limits, road works and weather forecast.
Some pioneer contributions are introduced by the authors: i)paper [28] presents a novel cloud-based architecture that can provide enhanced localization services to Global Navigation Satellite System receivers; ii) in [29] an initial simplified architecture of the Eco-Route Planner is proposed and a method to evaluate the velocity profile by considering only two steps ahead of 2 km is presented; iii) in [30] the algorithm to build the route graph network starting from the 3D maps from external data services is described in detail.

Fig. 2. Eco-Route planner architecture.
The new contributions introduced by this paper are the following:
● the eco-route planner architecture is described in detail by focusing also on the DMS. Indeed, the described cloud-based DMS is very important to obtain the optimal eco-route exploiting the information about traffic and weather;
● comparing with the work in [20] that optimizes the speed profiles in the assigned route, this paper determines the optimal eco-route by computing the speed and gear profiles that minimize the fuel consumption;
● comparing with the contributions of [21], [22] and [23]that consider electric vehicles, our paper optimizes the ecoroute for HDVs, vehicles still widely used today and cause of pollution;
● the proposed methodology is targeted specifically to HDVs and is based on vehicle longitudinal model of the vehicle contrary to the contribution in [15] and in [17] that does not optimize the speed profile;
● comparing with the papers [12] and [10] where all computations are performed in a static scenario with fixed origin and destination, the new proposed Eco-route planner can be applied off-line in the pre-mission phase and in realtime during the in-mission phase. Indeed, thanks to the cloudbased architecture the system can dynamically react to unpredictable events.
The remainder of this paper is organized as follows. In Section II the Eco-Route Planner architecture is presented.Moreover, Section III describes the data management system and Section IV describes the operational scenarios. In addition, Section V describes the CO components also based on the simplified longitudinal model detailed in the Appendix.Finally, Section VI discusses a case study showing the efficiency of the proposed system and Section VII draws conclusions and future works.
II. ECO-ROUTE PLANNER ARCHITECTURE
The Eco-Route Planner is composed of two main software components: the Cloud Computing System and the On-Board system (see Fig. 2).
The Cloud Computing System is a new paradigm that provides scalable, on-demand, and virtualized resources for users [31], [32]. In this paper the Cloud Computing System performs the route planning optimization on the basis of the cloud system data coming from external services (i.e., traffic,weather, maps and topography sources), mission related data(i.e., waypoints, payload, driver) and real-time data provided by the truck on-board system (i.e., position, speed,consumption, environmental sensors). The On-Board system works to optimize the operations of the truck and checks the information coming from the on-board components and sensors.
This paper focuses on the Cloud Computing System description by designing the two main blocks of the system:
● the Data Management System (DMS),
● the Cloud Optimizer (CO).
A. Data Management System Architecture
The presented Eco-Route Planner works with big datasets coming from external sources and in real-time from the trucks.These data are large and heterogeneous sets characterized by what in big data domain is described as the 3 Vs of Big Data[33]: Volume, i.e., the total amount of data stored; Velocity,i.e., the speed of data creation, streaming, store and aggregation; Variety, i.e., how heterogeneity data structures and sources are. The main components forming the data management architecture are:
● the Data Storage Component (DSC), to collect all the raw data from external sources and trucks;
● the Business Logic Component (BLC), to ingest, integrate and fuse the datasets.
1) Data Storage Component: The DSC includes the repositories that collect the vast amount of raw data in native format (structured, un-structured, semi-structured) coming from the external data sources and the truck On-Board System. The component is divided in the following two main sub-components.
a) The SDS is responsible for the storage of data from external sources and mission data. This is a shared area across different modules that store not processed system information coming from different data sources, such as Advanced Driver Assistance System (ADAS) data, traffic forecasting data,weather forecast data, mission and truck data. Such data are stored into the database in order to help the system to plan the best route.
b) The PDS is responsible of the storage of the computed optimal eco-route data and truck data. This storage is a shared area across different modules, which store information,including eco-route, optimal velocity and gear profiles calculated by the optimizer and truck on-board data received from the On-board system.
Both the sub-components operate on-line and off-line,supported by the Business Logic components.
2) Business Logic Components: The BLC operates several types of operations on data provided by external sources such as ingestion, cleaning, transformation, processing, fusion and integration. This component includes two main subcomponents:
a) the SDM, which has the objective to retrieve data from external services, then to store them to the Data Storage components in order to guarantee to have always the most recent data available;
b) the PDM, which is the main interface regarding both the flow of structured planning data and the communication data with the on-board system.
In addition, the Mission Dashboard is the software component that allows the insertion of the mission data by the fleet management company operator.
B. Cloud Optimizer Architecture
The aim of the CO is to determine the best route that an HDV has to follow, in order to reach its destination by: i)minimizing the truck energy and, consequently, the fuel consumption; ii) optimizing the route velocity and gear profiles. The CO optimizes the eco-route considering all relevant stored data for an efficient truck routing: mission data and payload factor, route information, ADAS (e.g. road slopes, curve radius, etc.), traffic condition and weather forecast. Mainly, the CO is divided into three sub-components(Fig. 3):
● the RNS that builds the route network and the corresponding route graph that links the mission departure,waypoints and destination;
● the VGPC that computes the admissible velocity profiles and the corresponding gear profiles for each route of the network selected by the RNS considering ADAS data, traffic,weather conditions and payload factor;
● the RO that determines the best route on the basis of the minimum fuel consumption and the optimal velocity profile.
III. DATA MANAGEMENT AND DATA WAREHOUSE DESIGN
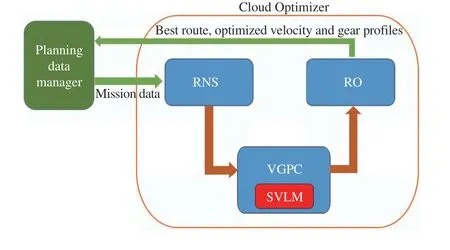
Fig. 3. The cloud optimizer components.
In this section, we provide details about the Cloud-based Data Management architecture which consists of three main layers (Fig. 4): (i) the Application Service Layer, which includes the components that interface with the two external components, the Mission Dashboard and the On-Board System; (ii) the Business Logic Layer, which includes the Service Data Manager, the Planning Data Manager and the Cloud Optimizer components; (iii) the Data Layer, which includes all the Data Storage components.
The Data Storage is a shared area across different architectural modules that store raw and processed information coming from different sources. It includes the following components:
● ADAS, for the collection of road topographic data from external sources such as slopes and curvatures of road segments;
● Traffic, for the collection of real-time and historical traffic information for a specific road segment, including accidents;
● Weather, for the collection of real-time and historical weather data such as temperature humidity, wind speed and specific meteorological events;
● Mission, for the collection of mission related data from the fleet management company, including departure,destination, waypoints, truck type and driver;
● Routing, for the collection of all possible, non-optimized,routing information for a specific mission;
● Eco-route, for the collection of the optimal route and speed and gear profiles for a specific mission as an output of the cloud optimization process;
● On-board, for the collection of real-time on-board data coming from the truck, including vehicle parameters, speed,position and processed data from environmental sensors.
The interaction with the data storage is modelled following a data warehouse design [34]. Such a design is chosen because it is very well suited for the information integration, which helps to handle the integration of heterogeneous data sources.As examples the following subsections show the two main data warehouse models: Mission Data and Geographical Data.
A. Mission Data
The data warehouse design for the mission data is shown in Fig. 5: the rectangles indicate database tables and the lines are primary-key/foreign key constraints. The green tables are fact tables, the orange tables are dimension tables, and the yellow table are utility dimension used by the planning data manager to keep track of where data are loaded.

Fig. 4. Cloud-based data management architecture.

Fig. 5. Mission data scheme.
The table Mission is the fact table and one or more rows are stored for each transport mission. The orange boxes are dimension tables. The Driver dimension contain information about drivers, e.g., age, nationality and years of experience.The Tractor dimension contains information on the tractor,e.g., make, model, number of axels, and engine size. The Trailer dimension contains information on each trailer, e.g.,length, maximum load and number of axes. The Status dimension keeps track of the status of the mission, e.g.,“prepared”, “on-route” or “finished”. The StartDate and EndDate dimension contains timing mission information. The Batch Load dimension contains the detail about where information is loaded, to easily find data that are loaded in a particular day. The Quality dimension keeps track of the quality of each row in the Mission fact table, e.g., if the mission data are altered during the Extract-Transform-Load phase due to quality control policies set up by the trucking company. The information in the Quality dimension enables the detailed tracking of data quality. The OnBoard is a fact table that refers to the GPS and CAN-bus data, that are collected from the trucks and sent to the cloud system to be integrated with the other data sources used in the Eco-Route Planner.
B. Geographical data: Points and Linestrings
A truck mission is planned by specifying a number of points that the truck has to pass, to delivery or pickup goods. Then,the data sources use points to indicate where information is valid, e.g., traffic accidents or weather data. The Point Info shares the dimensions Date and Time and contains latitude,longitude, and altitude. The ADAS data either associate directly the slope and curvature of the points or allow determining them by considering the previous point and the successive one. Moreover, the Point Info is connected with the following dimensions: Accident containing information on accidents duration and changes in speed; Weather Forecast containing information on both short-term and long-term weather reports; Manoeuvres dimension containing information about crossings points in a road necessary to build the alternative routes.
A sequence of points is denoted Linestring and represents a route of the route network.
IV. OPERATIONAL SCENARIOS
This section describes the sequence of events that occur during the application of the Eco Route Planner. More in detail, the sequence of events can be divided considering two operational phases: Pre-mission phase and In-mission phase.
A. Pre-mission Phase
In the Pre-mission phase, the system is configured to compute the best eco-route and the optimal velocity and gear profiles and to send them to the fleet management company before transport mission begins. This phase is described in Fig. 6 by the activity diagram of the so-called Unified Modeling Language (UML) [35].
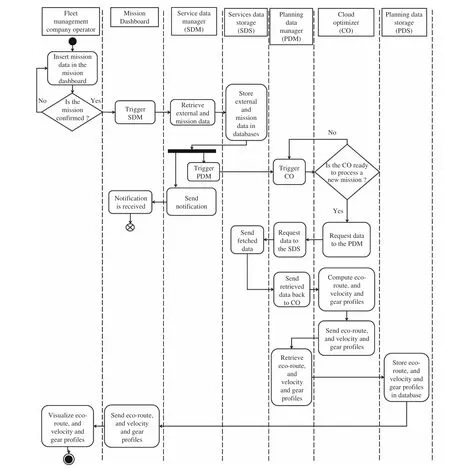
Fig. 6. The UML activity diagram of the Pre-mission phase.
A fleet management company operator inserts mission data into Mission Dashboard and when she/he confirms the transport mission, the Mission Dashboard triggers SDM that retrieves data from external services (ADAS data, traffic,weather, routing information, etc.) and mission data from the dashboard. The SDS stores external and mission data in the corresponding databases, and the SDM notifies to the Mission Dashboard that the mission computation starts to be processed. At the same time, SDM triggers PDM because a new mission is submitted and needs to be scheduled.
In turn, PDM triggers CO in order to check when it is available to manage a new mission. When CO replies to PDM that is ready, PDM retrieves external and mission data from SDS and sends such data back to CO.
Once the data are received, CO computes the best route, and the optimal velocity and gear profiles. Then, CO sends all the computed data to the PDM that stores them in the database by the PDS. Best eco-route and velocity and gear profiles are computed and stored, and are available to be shown to the fleet management company operator by the Mission Dashboard.
B. In-mission Phase
The In-mission phase starts when the truck is ready to perform the transport mission. The on-board optimizer receives the best eco-route, and the velocity and gear profiles computed in the Pre-mission phase. During this phase the onboard system works to optimize the operations of the truck by checking the information coming from the on-board components, sensors and fresh data from the cloud. The UML activity diagram of this phase is shown in Fig. 7.

Fig. 7. The UML activity diagram of the In-mission phase.
PDM gets mission route information from the PDS and uploads these data to the truck On-board system. Then, the truck starts its mission following the mission route information.
During the trip the On-board system sends every 2 minutes status information to the PDM about data collected by sensors(GPS coordinates, slopes, velocity profiles, etc.).
Then, PDM triggers SDM to receive the current conditions of traffic and weather at fixed time interval of 5 minutes.SDM sends to PDM the estimated velocity profile of the best route and the PDM checks if the velocity profile is decreased or an accident occurred in some parts of the route. If this is the case, then the PDM retrieves mission and updated external data by the SDM. Once the data are received, PDM triggers the CO and sends it the collected data. Hence, the CO decides if it is only necessary to update mission data keeping the same route (e.g. adjusting recommended velocities and gears) or if it is necessary to calculate a new eco-route to avoid the zone of the best route affected by traffic jam. After the computation, the CO sends the new velocity and gear profiles and, if it is necessary, the new eco-route to the PDM that stores them in the database. Finally, the PDM sends the stored data to the Mission Dashboard and the On-board system by a dedicated Message Queuing Telemetry Transport [36]communication channel, an ISO standard publish-subscribebased messaging protocol, operating on the TCP/IP stack. In this way, fleet management company operator can visualize the changes, and the truck can follow the new mission ecoroute.
V. CLOUD OPTIMIZER COMPONENTS
This section describes the structure and the main goals of the CO that determines the best route that an HDV has to follow, in order to reach its destination. The data received by CO are retrieved by the PDM from the following databases:
● from Mission: origin, waypoints, destination, truck payload and maximum mission duration time;
● from Routing database: basic geographical maps, fastest route form origin to destination by passing through the waypoints, main crossings in the fastest route;
● from ADAS: slope, curve radius, road speed limits;
● from Traffic: estimated speeds based on traffic conditions;
● from Weather: short and long term information about climate condition on specific areas (e.g., rain, snow, wind velocity, etc.);
● from On-board: vehicle parameters (mass, cross section area, payload, cylinder number, number of crankshaft revolution per cycle, wheel radius, etc.).
It is important to remark that the CO is the intelligence of the Eco-Route Planner and provides the eco-route with the associated speed and gear profiles. To this aim, the necessary phases to obtain the eco-route are performed by the three components of the CO: the RNS, the VGPC and the RO. More precisely, the RNS builds the route network from the external map service. Since this network can not be used to apply the optimization algorithms, the algorithm presented in [30]converts the route network in the Route Network Digraph(RND). At this point the VGPC analyses each road (edge) of the RND and builds a new digraph, named Admissible State Digraph (ASD), where the nodes are the states of the truck(speed and gear) and the edges represent the possibility of passing between two admissible states. Finally, the RO associates the weights to the ADS edges as function of fuel consumption and travel time and determines the optimal ecoroute by applying to the ASD the Djikstra algorithm [26],[27].
A. Route Network Selector
This subsection describes how the RNS builds the route network and the corresponding RND that links the mission origin, waypoints and destination.
First, the CO module receives from the PDM the fastest route r1(in terms of mission duration time) from the departure point to destination point by passing through the waypoints and respecting the maximum arrival time.
Second, the route network, including all the possible routes connecting each major crossing of the fastest route to the next waypoint, is built by the following steps.
Step 1: The road crossings in r1are detected.

Two main problems have to be solved for building the RND G: i) recognizing overlapping road sections; ii) determining the sets V and E. In order to obtain the RND by starting from the route network, an algorithm is presented in [30]. Such an algorithm provides a detailed description on how the route network is converted in the RND. With the aim of showing how the algorithm in [30] works, the following example reports the output of the algorithm application.
Example 1: Fig. 8(a) shows the fastest route r1and the alternative routes fr2,...,r5g, which correspond to crossing point descriptions (φi,λi) with i=1,...,5. Initially, the routes partially overlap (dashed lines) with other routes (see for instance r2, r4, and r5in Fig. 8(a) . The RNS algorithm recognizes where the roads split and join: these points are the nodes of the RND G=(V,E) and the routes connecting them are the M=11 edges of the graph. The output of the RNS is the RDN G=(V,E) shown in Fig. 8(b), whereV=fn1,...,n8g and E=fe1,...,e11g.

Fig. 8. Example of the RND building.
B. Velocity and Gear Profile Calculator
The VGPC analyses each road (edge) of the RND G built by the RNS. In particular, the VGPC determines the admissible velocity and gear profiles for each road of the RND considering ADAS data, traffic and weather conditions, and payload. The aim is to obtain from the RND the new ASD where the nodes are the admissible states (velocity, gear) of the truck in each edge (road) of G. Moreover, the edges are weighted by a function that depends on the fuel consumption and the duration time to perform the distance of edge (road) of G.
To this aim, the VGPC needs the following models:
● the Simplified Vehicle Longitudinal Model (SVLM) to quantify the fuel consumption and travel time on the basis of the truck velocity and gear. Such model is simplified in order to build it in real-time, in particular in the In-mission phase;
● the model that links the fuel consumption to the state and the inputs of the vehicle;
● the computation of the maximum velocity in each road by taking into account the road curve layout and the weather.
1) Simplified Vehicle Longitudinal Model: The following truck dynamics model is obtained by combining the equations(15)-(22) reported in the Appendix:
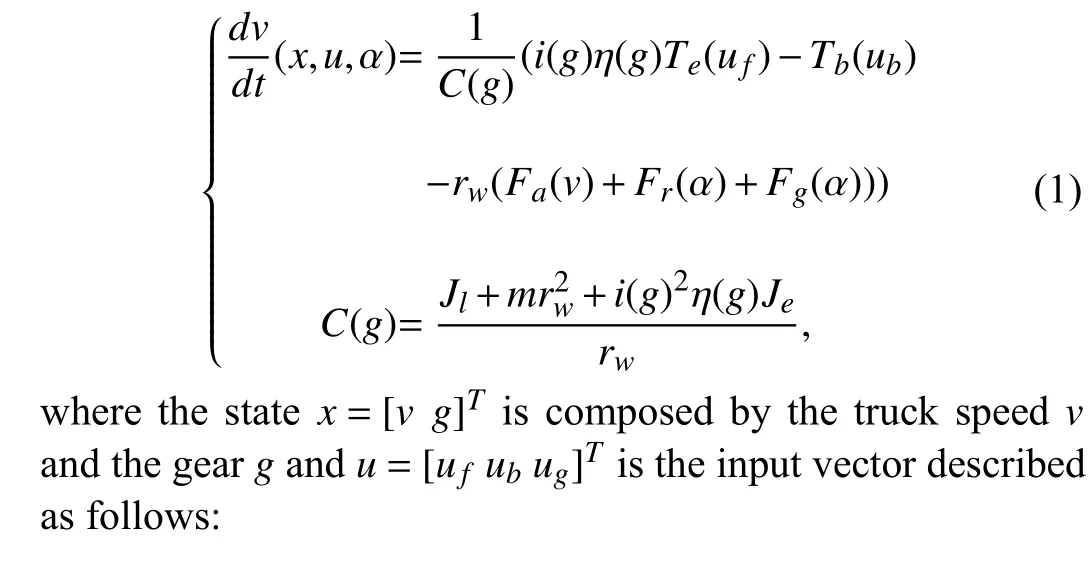
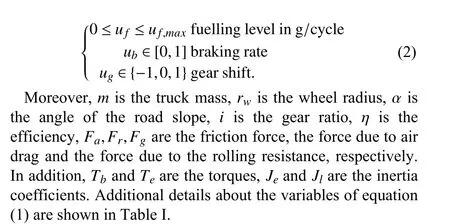

TABLE I VARIABLES
2) Fuel Consumption Model: The relationship between the fuel consumption, the state x and the input vector u is modeled by the following equation that describes the mass flow of fuel in g/s:

where ncylis the number of cylinders and nris the number of crankshaft revolution per cycle.
3) Maximum Speed Computation: In [18] and [19], the authors state that the velocity upper bounds can be set by safety reasons or legal considerations but they do not investigate how to determine them. Indeed, the maximum speed is not necessarily the legal limit (vmax,1) or the traffic speed (vmax,2) obtained by EDSs, but it can depend on weather conditions, road layout, safety driving or comfort. In this section the maximum speed is determined as the minimum value of the maximum speeds obtained by taking into account the road curve layout with the impact of weather, i.e., wind(vmax,3), wet road (vmax,4) and visibility constraints (vmax,5).
Steering. In the related literature [37], the minimum curvature radius Rminfor a given speed is function of the maximum super-elevation e of the roadway and the maximum admissible side friction coefficient fs. Such a coefficient can be computed by:

where the values of f are given on the basis of the weather conditions (i.e., dry, wet, heavy rain and snow conditions):

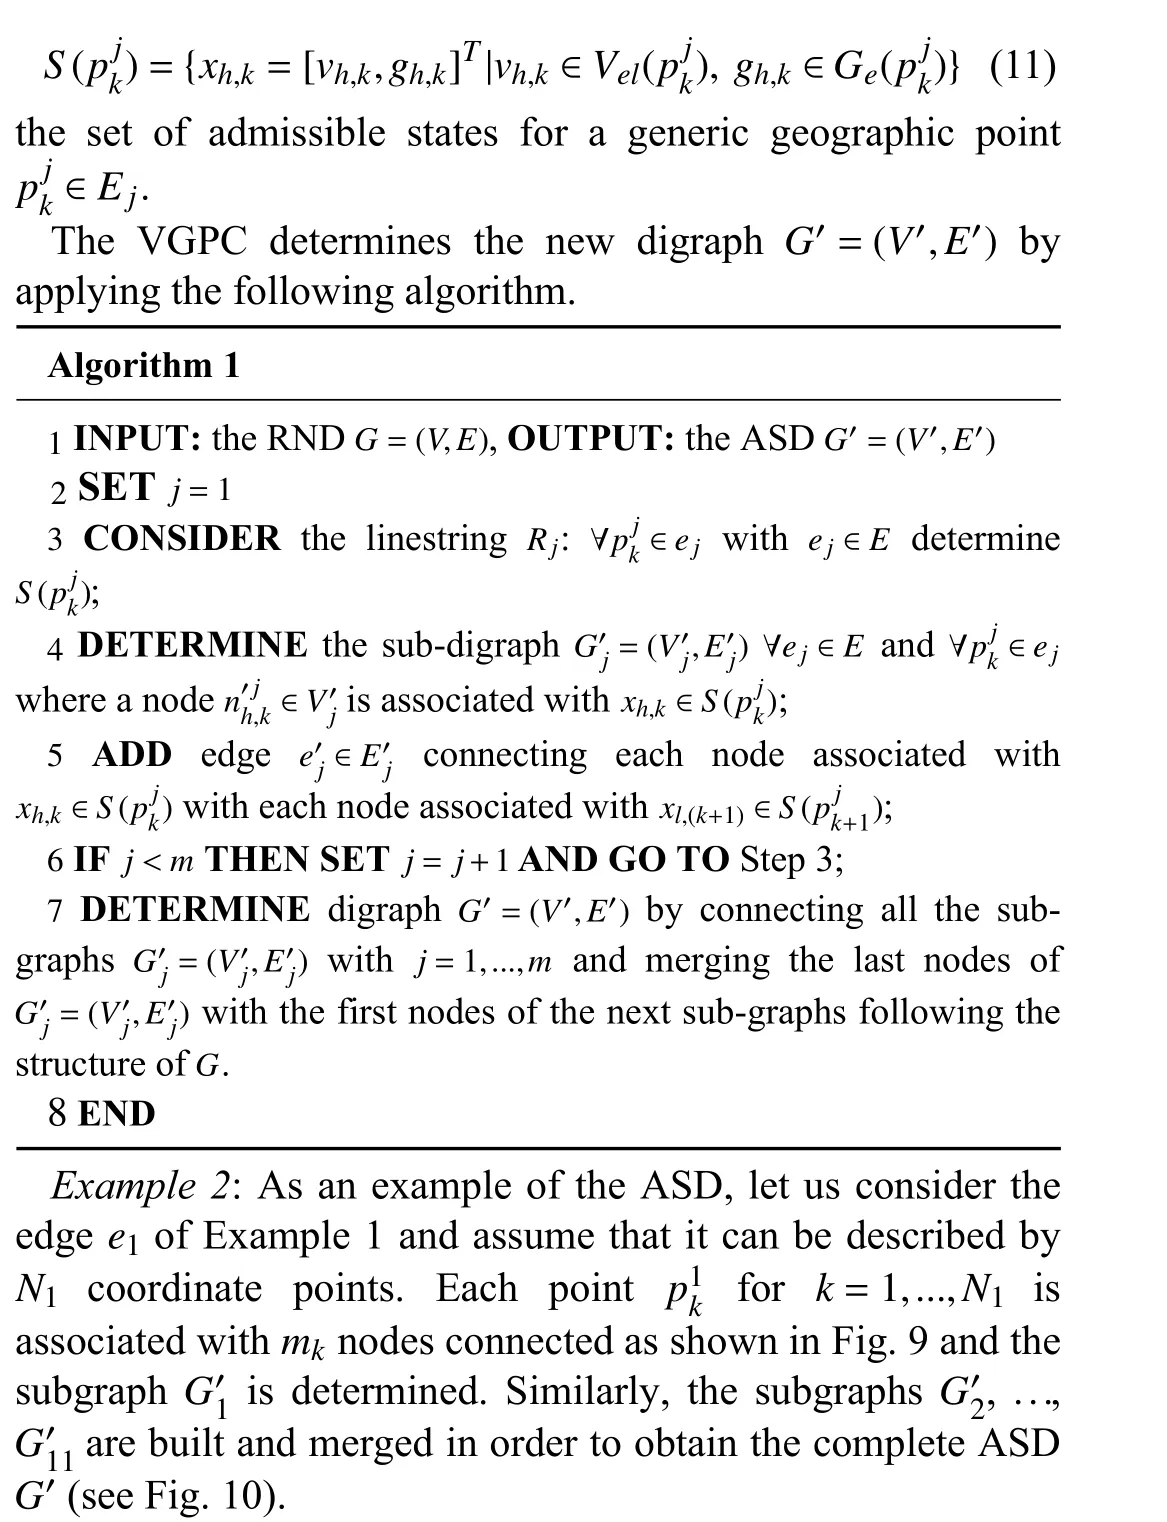

Fig. 9. Digraph G 01 associated to edge e 1 2 E of Example 1.
C. Route Optimizer


Fig. 10. The ASD G 0 for Example 1.
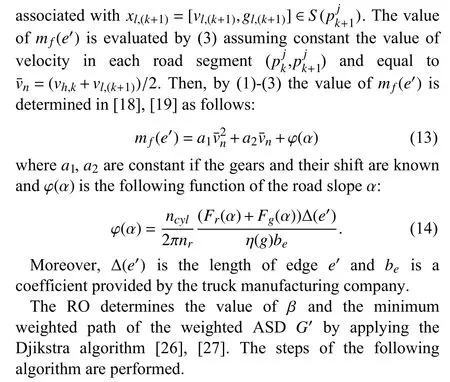

Agorithm 2 INPUT: ASD , ; OUTPUT: the optimal eco-route 2 β=1 γ=0.1 1 G0 TRmax SET ,3 e0 2 E0 ASSOCIATE to each the weight obtained according to(12), (13) and (14)4 G0 TRopt APPLY Djikstra algorithm to , determine the optimal route and the corresponding travel time 5 TRopt >TRmax β=β+γ IF then SET and go to Step 3 6 END.
Algorithm 2 minimizes the fuel consumption, determines the optimal velocity and gear profiles and guarantees the respect of the maximum arrival time constraint.
Also in this case two operational scenarios are considered:Pre-mission phase and In-mission phase.
In the Pre-Mission phase at the beginning, the RO uses a value of the parameter β that allows matching the mission duration time of the fastest route. If the constraint about the mission duration time is not respected (Step 5), then the RO gives more importance to the time in the weights of the graph and re-optimizes by using a higher value of β. When the mission duration time is lower than to the maximum arrival time, the RO sends the eco-route to the PDM. The route is modeled as a linestring, i.e., an ordered sequence of geographical points with the associated velocity and gear profiles.
The In-Mission phase starts when the truck begins its transport mission. Since changes in traffic and weather conditions can make the eco-route not efficient, the eco-route is monitored every 5 minutes. If the estimated velocities suddenly decrease or an accident occurs, then the procedure to calculate the eco-route is activated. In such a case, the new mission departure is represented by the GPS coordinates provided by sensors equipped on the truck. The current GPS coordinates of the truck and the information about accidents,congestion durations, weather conditions are the main data that the RNS, VGPC and RO analyze in order to determine deviations in the forecast eco-route and the velocity and gear profiles.
Hence, the In-Mission phase has to provide the alternative route as quickly as possible and to this aim the RNS selects a set of alternatives by building a reduced RND. Such reduced RND is determined by considering the points before and after the road interruption. Then the new reduced ASD is singled out and is sent to the RO to determine the updated best route in the geographical zone near to the accident position.
VI. CASE STUDY
This section presents a case study devoted to the validation that is planned and performed in order to test the proposed architecture system. Through the validation in a real environment, we assess the system functionality, usefulness and usability based on real-life results.
The validation was based on two models of Ford F-Max trucks: one truck (the demo trucks) was assisted by the Eco-Route Planner, one truck (the base truck) was not supported by the Eco-Route Planner. Both vehicles were equipped with a 500 PS diesel engine, a 12-speed automated manual transmission, and a vehicle weight rating of 42 tons. The trucks were equipped by a standard 13.6 m trailer with the same payload carried for both trucks. In order to obtain a right comparison between the two travels, the two drivers were carefully selected so that they had the same level of experience and after having followed a special refresher course. Moreover, the two drivers performed the complete mission: a driver drove the demo truck for the entire trip and the second one drove the base truck.
The international transport mission started on July 2019 and was performed from Turkey to Italy. During the mission, both vehicles were equipped with a data logging hardware to record the internal variables of Engine Control Unit and Rapid/Control Prototyping Unit software functions.
The mission loaded by the fleet management company was composed of the following waypoints: Gölcük (TK),Igoumenitsa (GR), Bari (IT) and Piacenza (IT). Since it is necessary to get a ferry between Igoumenitsa and Bari, the maximum mission duration time established by the company was 16 hours for the sub-mission Gölcük-Igoumenitsa and 12 hours for the sub-mission Bari-Piacenza, excluding time spent for the truck legal stops.
In the pre-mission phase, the RNS module built the route network shown in Fig. 11.

Fig. 11. Road network of the international transport mission.
The RNS sent the RND G to the VGPC that calculated the admissible velocities for each geographical point of the linestrings associated to the arcs of G. Successively, the VGPC built the ASD G0and transmitted it to the RO. The RO applied Algorithm 2 to digraph G0, determined the eco-route with the optimized velocities and gears profiles and the chosen value β=1.8 allowed respecting mission time constraint. The obtained eco-route is shown in Fig. 12. We note that the RND is about of 30,000 nodes, the ASD is about of 200,000 nodes and all the procedure starting from the route network until the final solution is performed in about 20 minutes.
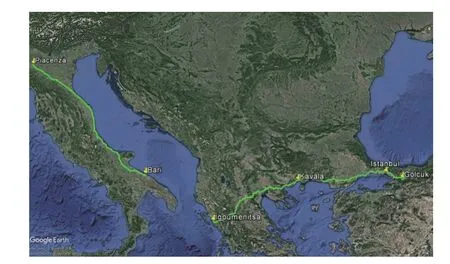
Fig. 12. Eco route obtained by the RO.
It is important to remark that the eco-route is similar to the shortest route: the rationality of this choice is that the longer the road, the higher the fuel consumption is. However, in different cases the shortest road can have more curves or a greater slope and therefore it is not the best road from the point of view of energy saving. Moreover, we remark that a very important element of the selected eco-route is the associated gear and velocity profiles that guarantee the reduction of the fuel consumption.
In addition, considering the vehicle velocity of the base and demo trucks, respectively during the trip, we observe that the base truck had to follow exactly the route that is decided by the fleet company manager, by using the truck cruise control.Moreover, several velocity values are near zero for the base truck: this occurred for the presence of an accident near Bari(Italy) that the demo truck avoided by changing route. Since the base truck could not change the route, in order to respect time constraints, the base truck increased the truck velocity during the route and its mean velocity is slightly higher than the demo truck one.
Regarding the accident occurred near Bari, a recalculation of the eco-route was performed by the CO in about 3 minutes.Figures 13 and 14 show the reduced route network obtained by the RNS and the eco-route determined by the RO,respectively. The segment of road that presents the traffic jam due to the accident is shown in red. The CO decided to exit from the closest crossing to the red segment (exit point 3) and to enter at the first crossing after the accident (enter point 1).
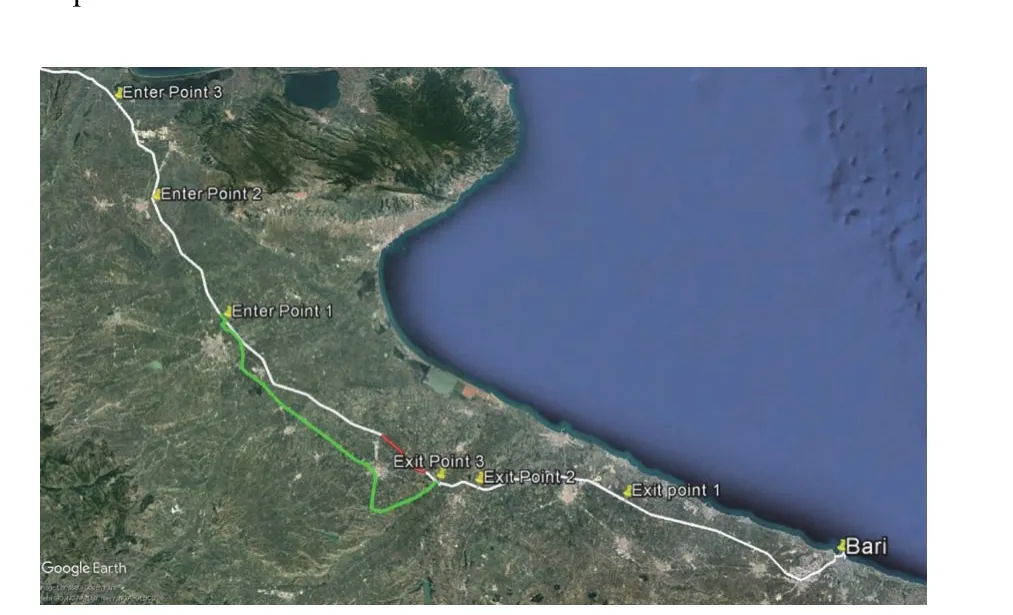
Fig. 13. Reduced route network performed by the RNS during the Inmission phase.
Finally, Table II shows the comparison between the route of the base truck and the one of the demo truck of the whole international mission. The comparison considers the base truck as reference and the fuel consumption of the two trucks is normalized in kilometres. In particular, three performance measures of the proposed Route Planner are investigated: the optimised velocity and gear profiles considering only slopes;the route changes due to traffic and weather conditions; the velocity recalculation based on traffic jams without route change. The results of Table II confirm that the proposed system works correctly: the fuel consumption is reduced by about 11%.

TABLE II COMPARISON BETWEEN BASE TRUCK AND DEMO TRUCK
VII. CONCLUSION
This paper presents an Eco Route Planner system that has the goal of selecting the best eco-route to be traveled by Heavy Duty Vehicles (HDVs) to minimize the fuel consumption by garanteing the requested arrival time.
In particular, the paper describes the main modules of the Eco-Route Planner: the Data Manager that elaborates and fuses the big data coming from external devises and the Cloud Optimizer that builds the Route Network Digraph and the Admissible State Digraph that are used to apply the Djikstra algorithm and determine the eco-route and the associated optimal velocity and gear profiles.
A case study shows the efficiency of the proposed Eco-Route Planner, by showing the results obtained comparing the travels of two HDVs that performed the same mission but one followed the eco-route with the suggested velocity and gear profiles and one that is free of using the standard velocity and route. The results show that there is a saving of the fuel consumption and C O2emission.
However, the results reached can be further improved if some modifications are performed: i) the ADAS data quality has a direct impact on usability of the proposed procedure and checking the slope data accuracy could increase the fuel saving; ii) sometimes the truck drivers did not follow the ecoroute planner instructions because the proposed velocities were too low. Hence, taking into account the need of the drivers could improve the efficacy of the procedure.
Future works will consider an on-board system that will collaborate with the cloud computing system to improve the efficiency of the proposed architecture. Indeed, the on-board system could improve the truck powertrain parameters based on the best route and obtain an additional reduction of fuel consumption.
APPENDIX
1) Simplified Vehicle Longitudinal Model: In this subsection, we describe the SVLM presented in [18] and [19]that is necessary to determine the costs for applying the optimization strategies. The longitudinal dynamics of the truck is given by the following Newton’s second law:

where the involved variables and parameters of (15) and the following ones are summarized in Tables I and III.

TABLE III PARAMETERS
In particular, Fa, Frand Fgare longitudinal forces and are given by the following equations:

4) Acronyms list:
● ADAS, Advanced Driver Assistance System
● ASD, Admissible State Digraph
● BLC, Business Logic Component
● CO, Cloud Optimizer
● DMS, Data management System
● DSC, Data Storage Component
● HDV, Heavy-Duty Vehicle
● HEV, Hybrid Electric Vehicle
● MQTT, Message Queuing Telemetry Transport
● PDM, Planning Data Manager
● PDS, Planning Data Storage
● RND, Route Network Digraph
● RNS, Route Network Selector
● RO, Route Optimizer
● SDM, Service Data Manager
● SDS, Service Data Storage
● SVLM, Simplified Vehicle Longitudinal Model
● UML, Unified Modeling Language
● VGPC, Velocity and Gear Profile Calculator
ACKNOWLEDGMENTS
The authors thank the lead partner manager Jean-Charles Pandazis, Haibo Chen and all the consortium of the European Project optiTruck (optimal fuel consumption with predictive power train control and calibration for intelligent Truck) of the H2020 innovation programme, for their collaborations in the case study results. Content reflects only the authors view and European Commission is not responsible for any use that may be made of the information it contains.
杂志排行
IEEE/CAA Journal of Automatica Sinica的其它文章
- A Multi-Layered Gravitational Search Algorithm for Function Optimization and Real-World Problems
- Dynamic Hand Gesture Recognition Based on Short-Term Sampling Neural Networks
- Dust Distribution Study at the Blast Furnace Top Based on k-Sε-up Model
- A Sensorless State Estimation for A Safety-Oriented Cyber-Physical System in Urban Driving: Deep Learning Approach
- Theoretical and Experimental Investigation of Driver Noncooperative-Game Steering Control Behavior
- An Overview of Calibration Technology of Industrial Robots
