Long-term(42 years)effect of thinning on soil CO2 emission in a mixed broadleaved-Korean pine(Pinus koraiensis)forest in Northeast China
2021-04-14MengguangHANWeifengGAOBaokuSHIandGuangzeJIN
Mengguang HAN,Weifeng GAO,Baoku SHI and Guangze JIN
1Center for Ecological Research,Northeast Forestry University,Harbin 150040(China)
2Key Laboratory for Vegetation Ecology,Ministry of Education,Institute of Grassland Science,Northeast Normal University,Changchun 130024(China)
ABSTRACT Thinning is an important forest management practice that has great potential to influence regional soil carbon storage and dynamics.The present study measured soil respiration(RS,the efflux of CO2 emitted)and its two components(heterotrophic(RH)and autotrophic(RA)respiration)from soil 42 years after thinning in comparison to un-thinning(control). Autotrophic respiration was significantly greater in the thinning plot, approximately 44%higher compared to the control,while both RS and RH were slightly,but not significantly,higher in the thinning plot.Higher fine root biomass might have contributed to the higher RA in the thinning plot.Both RS and RH showed clear soil temperature-dependent seasonal patterns,whereas RA was less responsive to changes in temperature,especially within one specific season.The annual and season-specific temperature sensitivities of RS and RH were lower in the thinning plot,specifically during the mid-growing season.Furthermore,variations in the season-specific temperature sensitivity of RS and RH were less intense in the thinning plot.We conclude that forest thinning can reduce the temperature sensitivity of RS and RH during the mid-growing season and increase soil CO2 emission in the long term.
Key Words: autotrophic respiration, heterotrophic respiration, microbial decomposition, rhizosphere respiration, soil respiration, soil temperature,temperature sensitivity
INTRODUCTION
More than two-thirds of terrestrial carbon(C)is retained in soil pools(Hibbardet al.,2005).Soil respiration(RS),the efflux of CO2emitted from soil,is the second-largest C flux in forest ecosystems, next to photosynthesis (Schlesinger,1997).A large amount of C(75—100 Pg)is released through the RSpathway to the atmosphere as CO2,exceeding that from fossil fuel combustion by ten-fold(Bond-Lamberty and Allison,2010).Therefore,RSis a key process that requires a clear understanding to improve the accuracy of predicting terrestrial C budgets.
Soil respiration is the sum of root and associated rhizosphere respiration(autotrophic respiration,RA)and microbial decomposition(heterotrophic respiration,RH).As a combined signal of these two processes,RSis significantly affected by a complex series of biotic and abiotic factors,namely,soil temperature,soil moisture,soil organic C content,fine roots,and microbial biomass and activity(Hopkinset al.,2013;Moyes and Bowling,2013;Hanet al.,2016;Aliet al.,2018).In temperate forest ecosystems,soil temperature is considered to be the most influential factor for the seasonal variation of RS(Hanet al.,2018),which has been generally used to model the feedback of soil C to global warming with the temperature dependency(Q10)function(Penget al.,2009).In addition to the direct effects of soil temperature on the activity of roots and microbes,soil temperature can indirectly influence RAand RHby regulating substrate diffusion and supply(Davidsonet al.,2006).Comparatively,the effect of soil moisture on soil CO2emission usually has threshold values below or over which values have contrasting effects on RS,which could also confound the impact of soil temperature(Davidsonet al.,1998).Other factors,such as substrates,microbial organisms,and fine roots,often exhibit more complex relationships with RS. These factors may account for changes in RSand its two components following forest disturbance(e.g.,burning and harvest)(Chatterjeeet al.,2008;Akburak and Makineci,2016;Guoet al.,2016;López-Serranoet al.,2016).
Forest management plays an important role in improving forest sustainability and C sequestration(Templetonet al.,2015). As a silvicultural tool, thinning is widely used to reduce competition and wildfire risk and,consequently,to improve tree productivity and preserve the health of forests.The opening of the forest canopy and removal of stand biomass would bring about changes in soil microclimate,root density and activity,soil organic matter,and soil microbes(Chatterjeeet al., 2008; Tianet al., 2010; Bolat, 2014;Akburak and Makineci,2016).However,current thinning practices have ambiguous effects on RSrates, including positive, negative, or neutral effect (Stoffelet al., 2010;Chenget al.,2015;Akburak and Makineci,2016;Panget al.,2016).In a northern hardwood forest,soil surface CO2flux after thinning was not significantly altered(Stoffelet al., 2010). However, Leiet al. (2018) showed that either light or heavy thinning significantly increased RSand its two components in a pine plantation.Conversely,a negative effect of thinning on RShas also been reported in temperate pine forests(Tanget al.,2005;Bolat,2014).
There are different factors affecting RSrates after thinning,including forest type,thinning intensity,site-specific environmental factors, and the time period after thinning(Nilsen and Strand, 2008; Akburak and Makineci, 2016;Panget al.,2016;Leiet al.,2018).For example,a reduction in root density following tree removal can result in decrease in RA(Tanget al.,2005),but the increase in decomposition of remaining residues after logging may more than compensate for this negative effect on RS(Shabagaet al.,2015).It is important to determine the influence of forest management practices over a period(i.e.,a diachronic study),as no general conclusive results about soil C dynamics is available to elucidate the time span elapsed when a forest returns to its pre-treated condition(Nilsen and Strand,2008;López-Serranoet al.,2016).Until now,however,most of the studies concerning the effects of thinning practices on RSwere based on short-term experimental design,with measurements starting less than 1 year immediately following thinning treatment(Akburak and Makineci,2016;López-Serranoet al.,2016).
The Asian temperate mixed forest is one of the three largest temperate mixed forests worldwide and is predominantly distributed in northeastern China,accounting for onethird of the total national forested land area and forest stock(Ministry of Forestry of China,1994).The primary mixed broadleaved-Korean pine(Pinus koraiensisSiebold&Zucc.)forest is the zonal climax vegetation in northeastern China.Since the 1970s, thinning has been the most commonly used forest management practice to obtain wood and achieve local regeneration to improve ecological benefits in mixed broadleaved-Korean pine forest.There is no study examining the long-term effect of thinning on soil CO2efflux in primary mixed-broadleaved forests, and only a few studies have examined the long-term effect of forest thinning on C storage and dynamics (Nilsen and Strand, 2008). In the current study, we aimed to: i) investigate the long-term effect of early thinning on soil respiration and its components in a primary mixed broadleaved-Korean pine forest,ii)evaluate the relationships between RSand its components and biotic and abiotic factors across un-thinning(control)and thinning plots,and iii)identify the factors driving the changes in RS,RH, and RAafter a long-term period following thinning.We hypothesized that both RHand RAare lower in thinning plot compared to the control due to the reduction in C input and tree roots after thinning, and soil moisture is another important factor inhibiting RSwith higher throughfall in the thinning plot than in the control.
MATERIALS AND METHODS
Site description
A field experiment was conducted in a mixed broadleaved-Korean pine forest located in the Heilongjiang Liangshui National Nature Reserve (47◦10′50′′N, 128◦53′20′′E),northeastern China.The site has a continental monsoon climate regime with a mean annual precipitation of 676 mm falling primarily in summer.The mean annual temperature is−0.3◦C, and the frost-free period is 100—120 d. The dominant soil type at this site is classified as Humaquept according to soil taxonomy(Soil Survey Staff,1999).The primary mixed broadleaved-Korean pine forest in this region is the zonal climax vegetation in Northeast China and accounts for 63.7%and 77.4%of the forested area and standing tree volume in the entire reserve,respectively.
Thinning treatment and sampling design
In 1971, thinning was conducted withca. 30%of the tree basal area removed(only boles),including mixed sizes.The harvested tree species wasPinus koraiensis. Table I provides information on the tree stand characteristics of the un-thinning and thinning plots. The two treatments were replicated three times,and each of the six plots was 20 m×30 m,with tens to hundreds of meters of buffer zone outside the plots.In each plot,eight polyvinyl chloride(PVC)collars,10.4 cm in inner diameter and 6 cm in height,were inserted into the soil for RSmeasurements,with an insertion depth of 1—4 cm to ensure gas tightness and minimal disturbance of superficial roots.To distinguish the two components of RS,four root-free subplots(2 m×2 m)were established in each plot in 2009. On the edges of the subplots, trenches were dug to 50—80 cm, below which few roots exist. Trenches were lined with double-layer nylon mesh (37 µm in pore size)and carefully refilled with the excavated soil.All plants growing in trenched plots and inside collars were removed every 2 weeks throughout the growing season during the entire experimental period.Three PVC collars were randomly installed in each subplot for RHmeasurements.
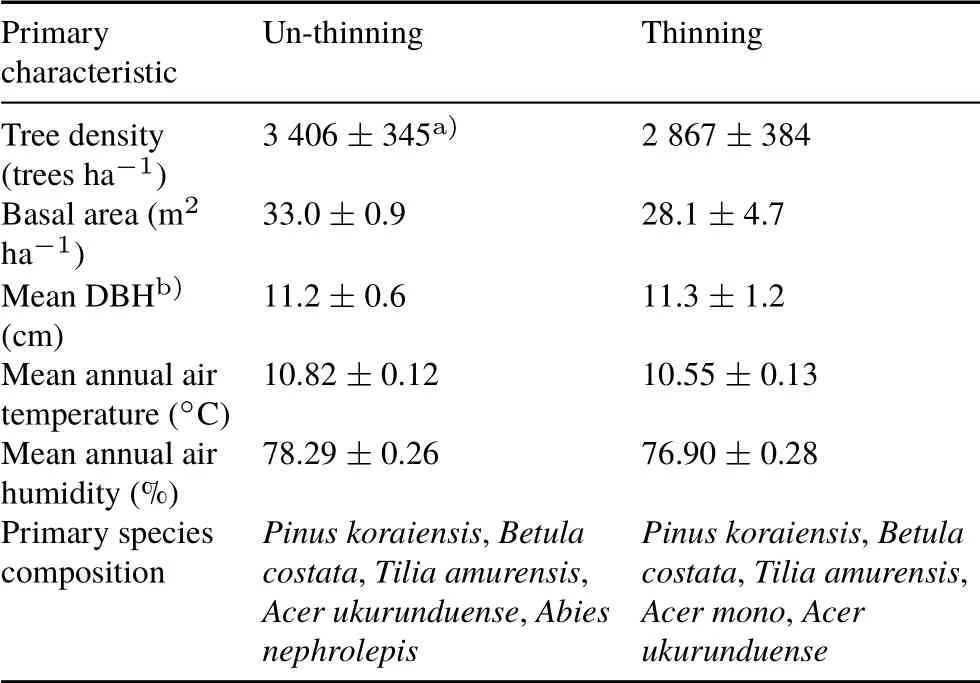
TABLE I Primary characteristics of un-thinning and thinning plots in the field experiment
Soil respiration and soil microclimate
Soil respiration was measured biweekly on rainless days using an LI-6400 portable CO2infrared gas analyzer connected with a 0.991 L chamber(LI-COR Inc.,USA)during the growing seasons of two consecutive years (2013 and 2014)for a total of 20 measurement periods throughout the entire experiment. As mentioned above, 20 measurement collars were randomly installed within each plot,with 8 of them used to measure RSand 12 of them used to measure RH.
Soil temperature was measured at a depth of 5 cm using a probe connected to LI-6400,and soil moisture(volumetric water content) was measured at a depth of 5 cm using a time-domain reflectometry probe(IMKO,Germany)next to each collar.
The growing season was defined as the duration of time when the surface soil temperature rose above 0◦C(Chenet al., 2010). We measured soil respiration from May to October,and three specific periods of the growing season were defined: the early growing season (May—June), the mid-growing season (July—August), and the late growing season(September—October). Because the analyzer could not operate at temperatures below 0◦C,we did not conduct measurements beyond the growing seasons.
Soil properties and fine root biomass
Four soil samples were collected randomly using a soil auger(5 cm in inner diameter)at a depth of 10 cm in each plot at the beginning of each month from May to October(except for June)2013.Soil samples were passed through a 2-mm sieve and pooled as one sample and then preserved at 4◦C for soil microbial biomass C analysis within one week.The chloroform fumigation-extraction method(Vanceet al.,1987)was used to determine soil microbial biomass C.For each sample,one subsample was extracted with 0.5 mol L−1K2SO4.A second subsample was fumigated with chloroform for 24 h in a vacuum and then extracted with 0.5 mol L−1K2SO4.After filtering,the organic C content in the extracts was analyzed using a multi N/C 2100 analyzer (Analytik Jena AG, Jena, Germany). Soil microbial biomass C was estimated as the difference between fumigated and nonfumigated extracts and corrected with a coefficient of 0.45(Brookeset al.,1985;Vanceet al.,1987):

where EC is the difference in organic C content between the fumigated and non-fumigated extracts.
In September 2013,some additional soil samples were collected near RSmeasurement points in each plot to determine other soil properties.These soil samples were pooled as one sample and then air-dried.The light fraction of soil organic C was extracted according to the method of Janzenet al.(1992).Soil organic C and its light fraction were determined using the multi N/C 2100 analyzer.Soil total nitrogen(N)was determined using a Hanon K9840 Auto Kjeldahl Analyser(Jinan Hanon Instruments Co.,Ltd,China).Soil C:N ratio was calculated from soil organic C and total N.Soil pH was measured in 1 mol L−1KCl extract(1:2.5,weight/volume)using a laboratory pH meter(S210-K,METTLER TOLEDO,Switzerland).
Ten soil cores were collected from the 0—40 cm soil layer in each plot using a soil corer(5-cm inner diameter)from May to September 2013. We separated each soil sample into four parts in 10 cm increments.All living fine roots(<2 mm in diameter)were picked out according to color and flexibility and then oven-dried at 60◦C until they reached a constant weight.
Calculations and statistical analyses
We first calculated the mean RSand RHfrom the corresponding collars in each plot, and then the mean RAat the plot level was calculated using the mean RSsubtracted from the mean RH.The mean values of soil respiration rate were applied in the following analyses.Repeated measures analysis of variance(ANOVA)were performed to analyze the individual and interactive effects of thinning and measurement date on RS, RH, RA, fine root biomass, and soil microbial biomass C.We used one-way ANOVA to test the differences in soil microbial biomass C and fine root biomass between the un-thinning and thinning treatments(n=3).Regression analyses were performed to determine the relationships between soil respiration and biotic and abiotic factors.
To describe the temperature dependency(Q10)of soil respiration rates, the following exponential function was used:

whereRis soil respiration rate,R0is respiration rate at 0◦C,βis temperature response coefficient, andTis soil temperature. ApparentQ10values were calculated using Eq.3:

The apparentQ10was used to describe the annual temperature sensitivity using the whole dataset during the growing season.In addition,theQ10function was also fitted for each period of the growing season to describe the season-specific temperature sensitivity(Moet al.,2005;Nohet al.,2017).
All statistical analyses were performed using SPSS statistical software(SPSS Inc.,USA).The significance level was set at 0.05.Graphs were generated using OriginPro 2016(Origin Lab Inc.,USA).
RESULTS
Soil properties and fine root biomass
Over the two consecutive growing seasons,there were no significant differences in soil temperature and soil moisture between the thinning and control plots(Table II).Soil organic C of the thinning plot was 29% higher than that of the control.Total N,C:N ratio,and light fraction of organic C of the thinning plot were all slightly higher compared to the control,but the differences were not statistically significant(Table III). Both soil microbial biomass C and fine root biomass changed markedly with sampling time(from May to October) (Table II). Soil microbial biomass C in the thinning plot was slightly higher than that of the control,and the difference was significant in September;however,contrasting results were observed in August(Table IV).Fine root biomass was 4%—44%higher in the thinning plot than in the control plot throughout the measurement period,while it was only significant in August.
Soil temperature exhibited pronounced seasonal variations, peaked between July and August, and reached the lowest values in the early or late growing season(Table II,Fig.1).Comparatively,soil moisture fluctuated significantly among different measurement periods,especially in 2013.However,there were no consistent or regular seasonal trends for soil moisture.Seasonal changes in soil temperature and soil moisture were similar between the control and thinning plot within each year(Fig.1),with average seasonal coefficients of variation(CV)of 33%and 25%,respectively.
Soil respiration and soil microclimate
Mean values of RS,RH,and RAin the thinning plot were approximately 23%,15%,and 44%higher compared to the control,respectively,and the difference in respiration rates between the thinning plot and the control was significant for RA(Table III). The contribution of RAto RSin the thinning plot was about 17%higher(P <0.05)compared to the control.Both RSand RHshowed pronounced seasonal variations,and basically changed along with soil temperature(Table II,Fig.2).Although we did not directly determine RA,the repeated measurement ANOVA indicated that RAexhibited significant seasonal variations (Table II). In a comparison between the control and thinning plot,RSshowedsimilar seasonal variations,with the CV ranging from 37%to 43%.The seasonal CV of RHwas approximately 17%higher in the latter,while the seasonal CV of RAwas approximately 28%lower in the latter.
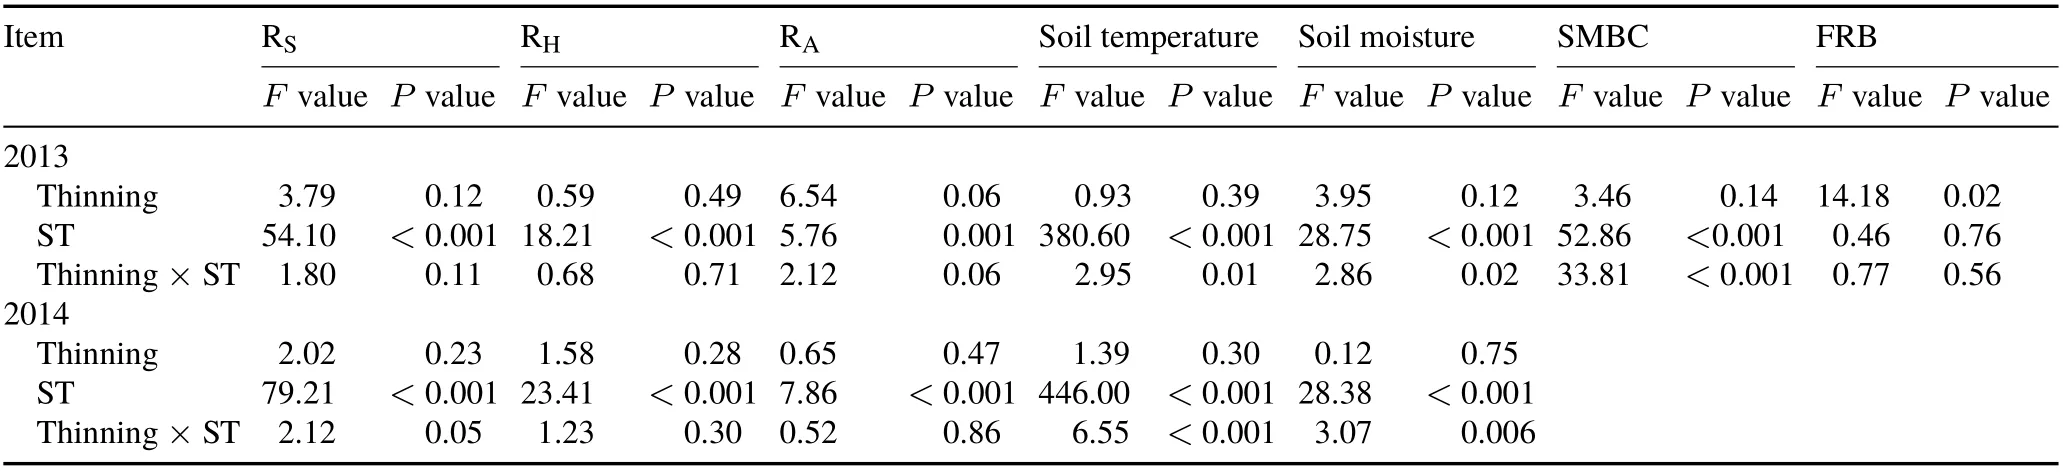
TABLE II Repeated measures analysis of variance results of the effects of thinning and sampling time(ST)on soil respiration(RS),heterotrophic respiration(RH),autotrophic respiration(RA),soil temperature,soil moisture,soil microbial biomass C(SMBC),and fine root biomass(FRB)
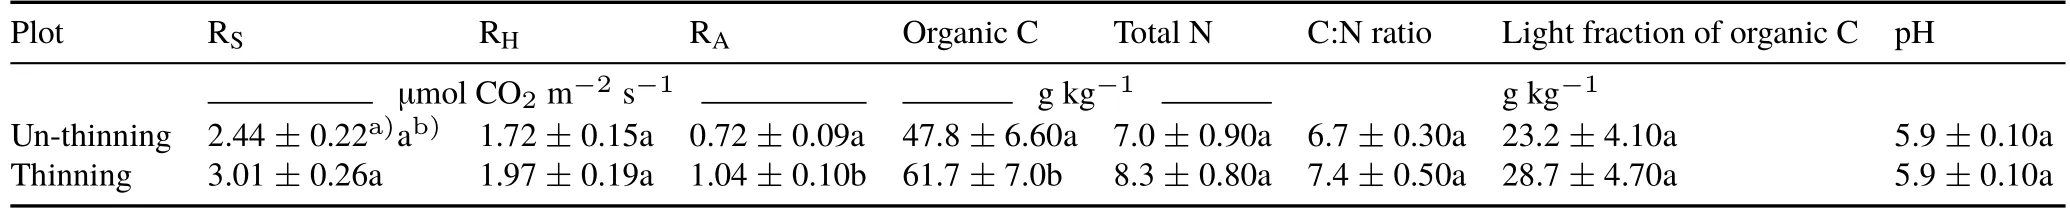
TABLE III Soil respiration(RS),heterotrophic respiration(RH),autotrophic respiration(RA),soil temperature,soil moisture,and other soil chemical and physical properties in un-thinning and thinning plots

TABLE IV Soil microbial biomass C and fine root biomass in un-thinning and thinning plots from May to October 2013
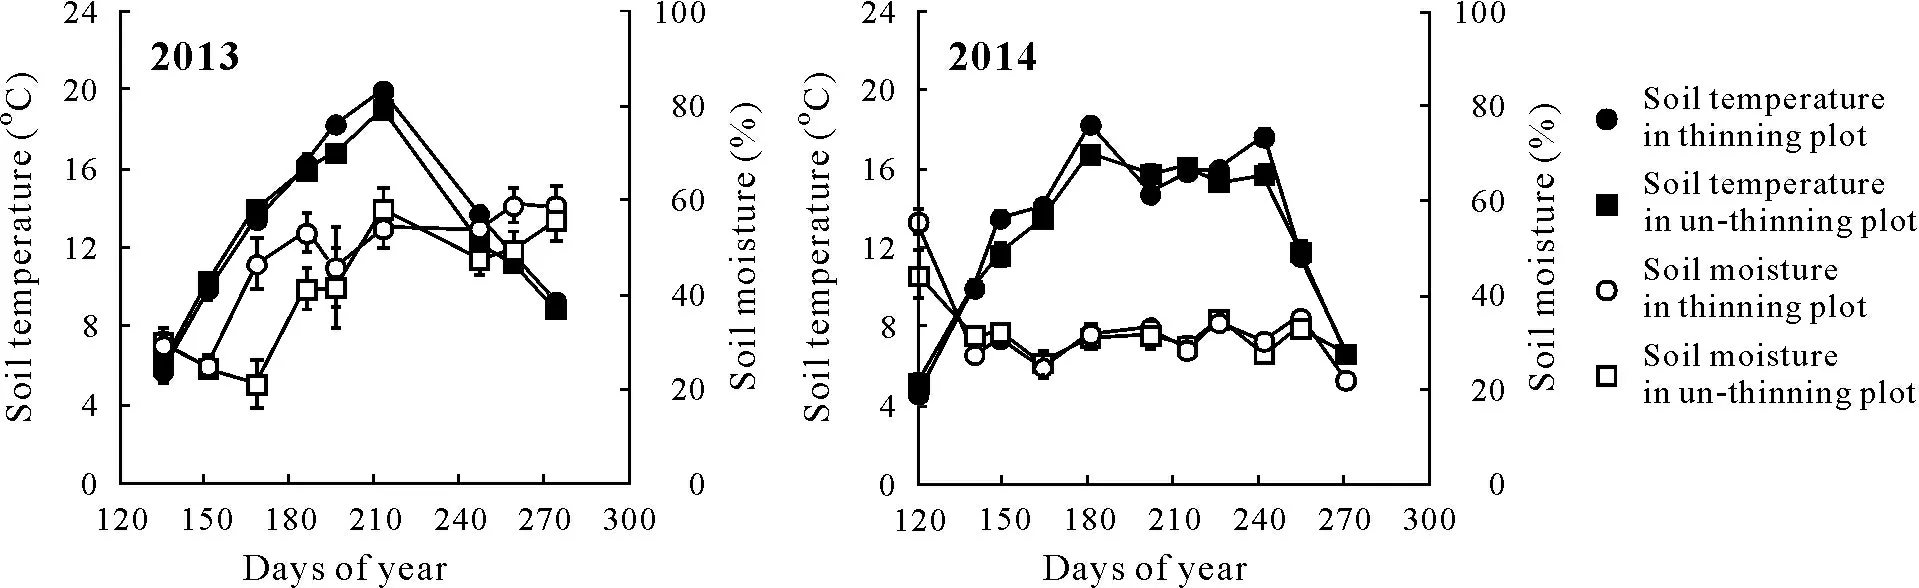
Fig.1 Seasonal changes in soil temperature and soil moisture in un-thinning and thinning plots in 2013 and 2014.Vertical bars represent standard errors of the means(n=3).
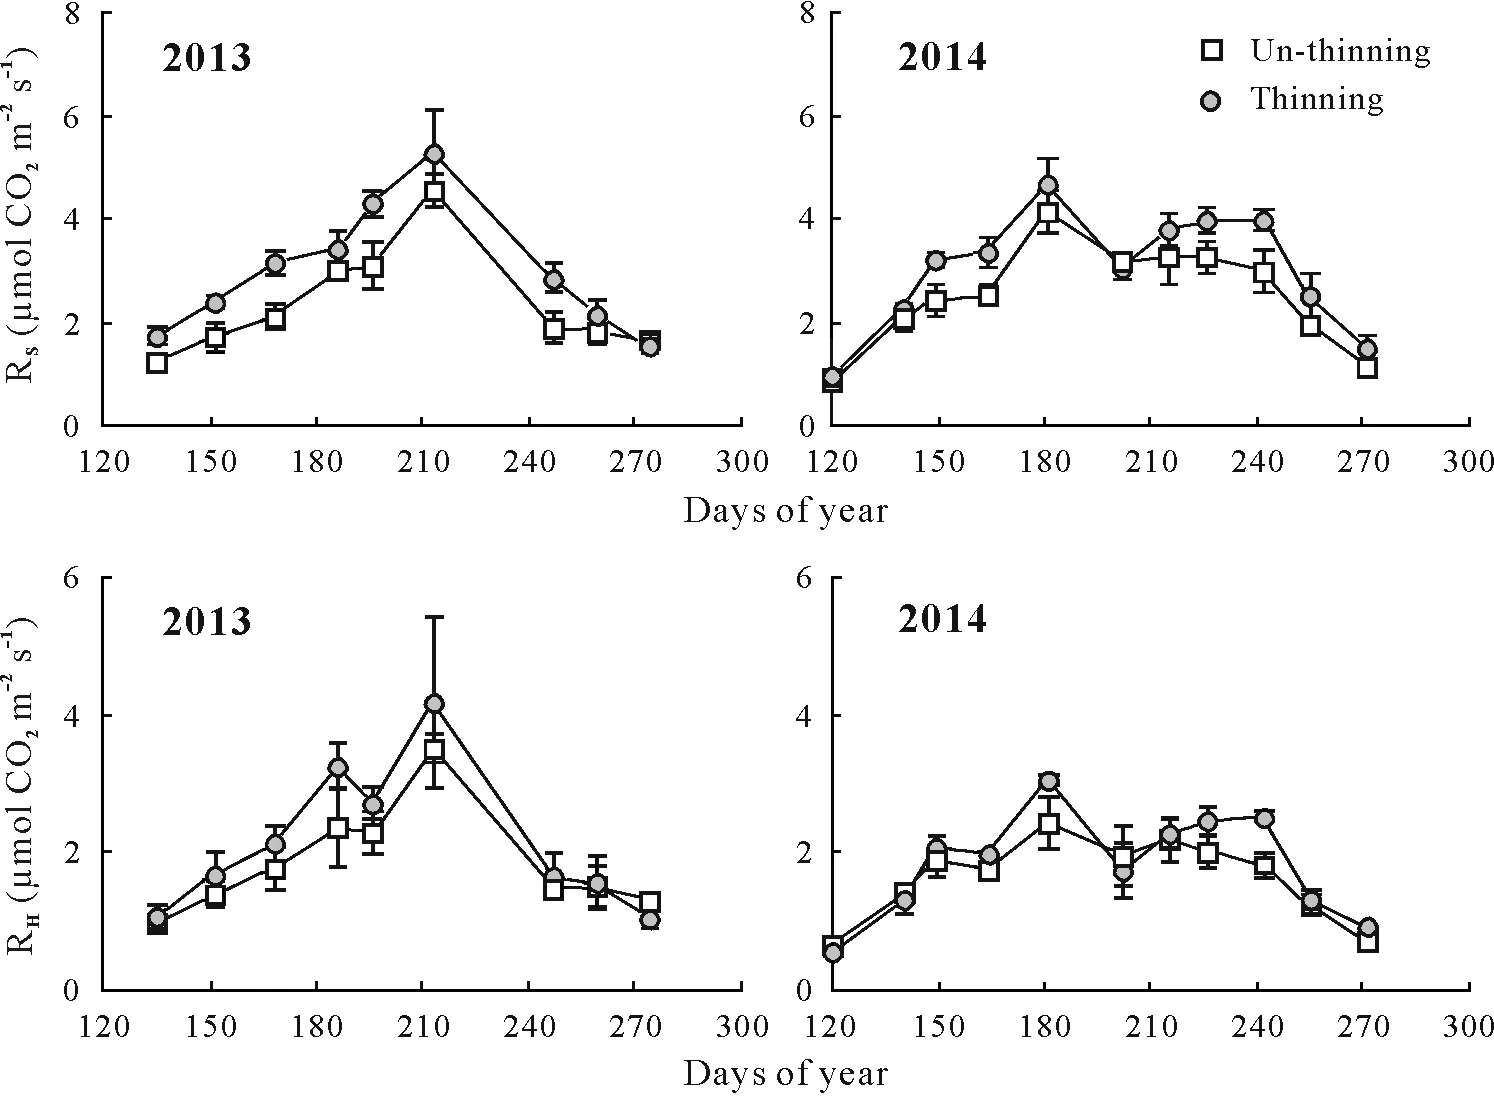
Fig.2 Seasonal variations of soil respiration(RS)and heterotrophic respiration(RH)measured in un-thinning and thinning plots in 2013 and 2014.Vertical bars represent standard errors of the means(n=3).
For the control and thinning plot,RS,RH,and RAwere significantly and positively correlated with soil temperature,and the exponential model could explain 84%—88%,57%—87%,and 33%—50%of the seasonal variations,respectively(Fig.3).Compared with RH,RAwas less controlled by soil temperature,as indicated by its relatively lower determination coefficients.The annualQ10value ranged from 2.51—3.25,2.56—2.92,and 2.29—6.23 for RS,RH,and RA,respectively.Additionally,we also measured the season-specific apparentQ10of RS,RHand RA.SeasonalQ10of RSand RHchanged with season,whereas RAwas not sensitive to soil temperature in most specific seasonal periods(Table V).Generally,seasonalQ10of RSand RHwas higher in the control compared to the thinning plot within the mid growing season,while no difference was found for the early and late growing seasons.Seasonal variations ofQ10of RSand RHwere relatively larger in the control compared to the thinning plot.Both RSand RHshowed a significant parabolic relationship with soil moisture in the control and thinning plot,of which the soil moisture threshold was approximately 38%—40%(Fig.4).There were significant linear relationships between RSand RHand soil microbial biomass C in the two treatments when the outliers were excluded(Fig.5).
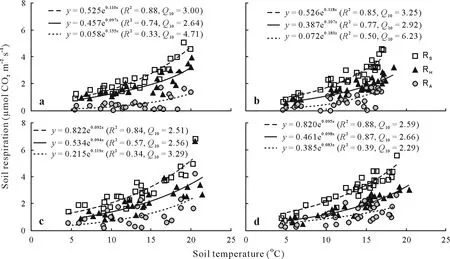
Fig.3 Exponential relationships between soil respiration(RS),heterotrophic respiration(RH),and autotrophic respiration(RA)and soil temperature in un-thinning(a and b)and thinning(c and d)plots in 2013(a and c)and 2014(b and d).R2 =coefficient of determination;Q10 =temperature dependency.
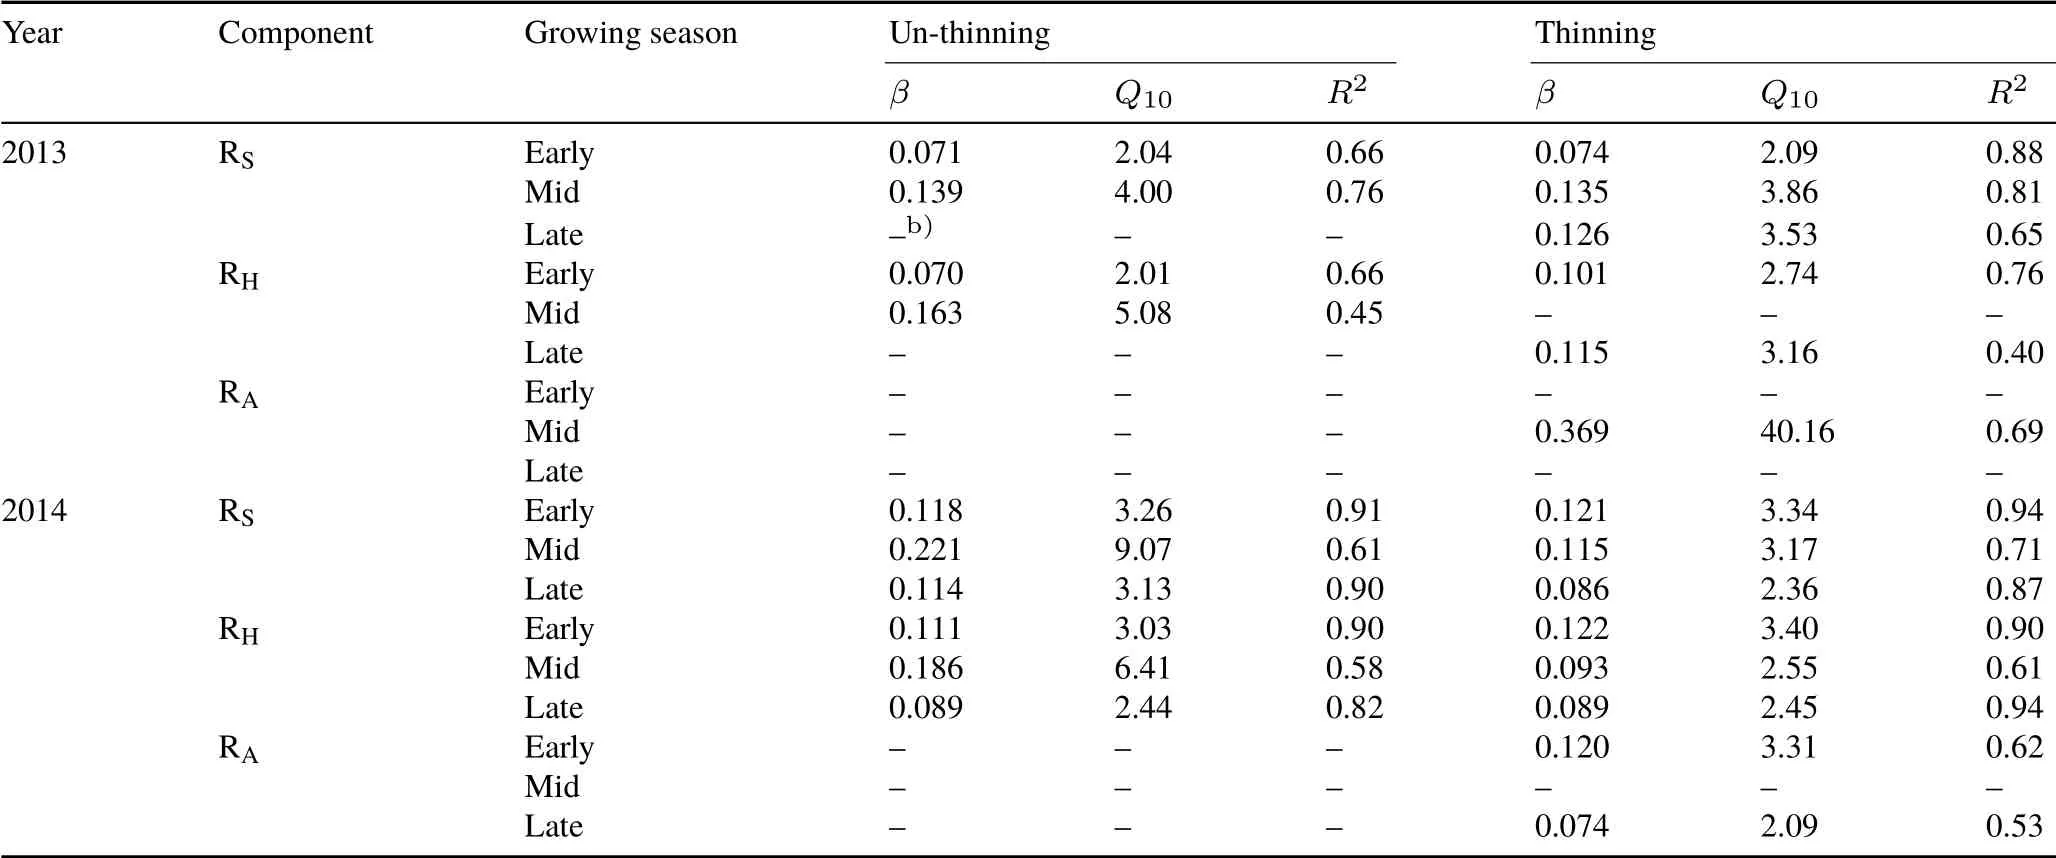
TABLE V Parametersa) derived from the exponential relationship and temperature dependency(Q10)function between soil respiration(RS),heterotrophic respiration(RH),and autotrophic respiration(RA)and soil temperature for each season in un-thinning and thinning plots in 2013 and 2014
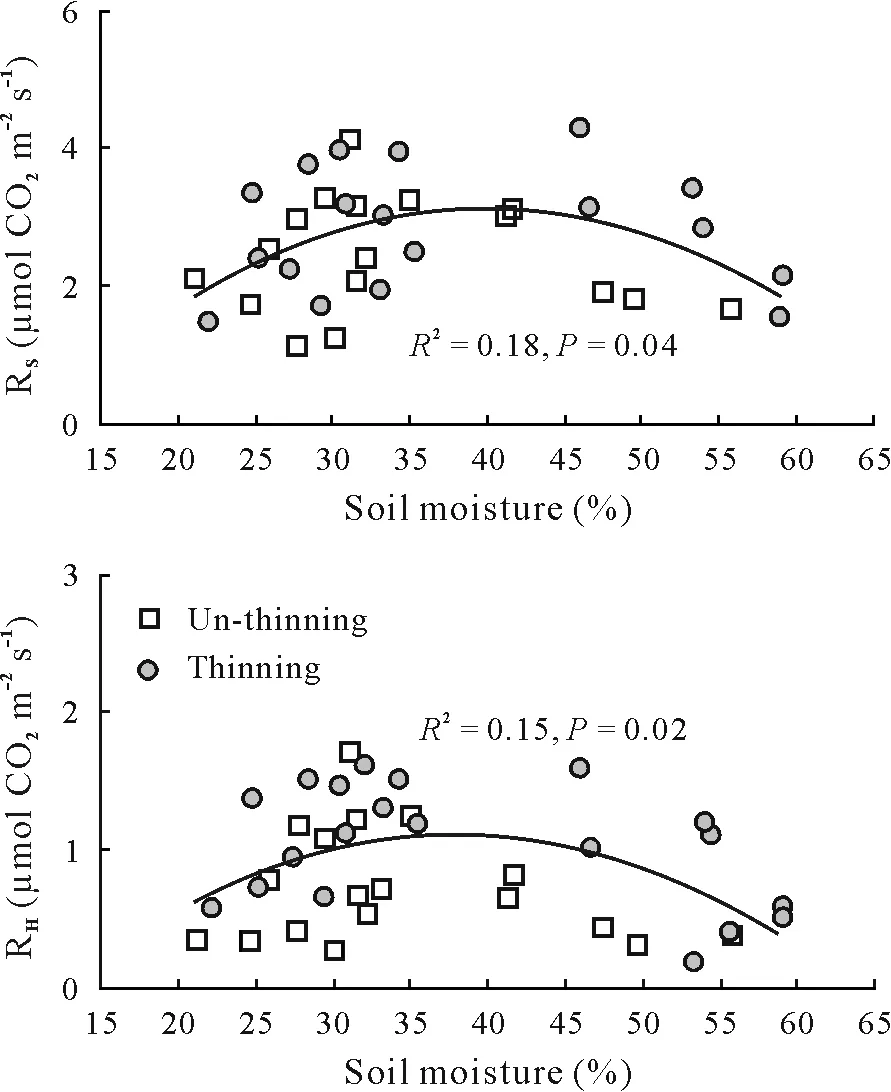
Fig. 4 Relationships between soil respiration (RS) and heterotrophic respiration(RH)and soil moisture in un-thinning and thinning plots.R2 =coefficient of determination.
DISCUSSION
Effect of thinning on soil respiration and soil microclimate
Following thinning,soil temperature is generally expected to increase with the opening of the canopy,i.e.,increased absorption of solar radiation by surface soil(Stoffelet al.,2010;Bolat,2014;Panget al.,2016).In this study,however,soil temperature was similar between the control and thinning plot,which might have been caused by the shading effects of the understory in the gap area(Schliemann and Bockheim,2014),as many saplings,shrubs,and herbs regenerated under the opening canopy in the study site.Similarly,the difference in soil moisture between the thinning plot and control was not significant. Although gaps allow more throughfall to reach the ground, an increase in evaporation may weaken this effect(Simoninet al.,2007).
Most previous studies have shown that thinning could result in an immediate(several months to years after thinning)stimulation of microbial decomposition(Chenget al.,2015;Leiet al., 2018) due to extra input of both above- and below-ground residues(e.g.,coarse branches and dead roots)(Akburak and Makineci,2016).However,it is usually thought that this priming effect would decline to the pre-harvest level after several years(Penget al.,2008;Akburak and Makineci,2016).Unlike the results in the existing literature,however,our findings indicated that thinning still has a weak positive effect on RHeven after a long-term period(42 years),which was inconsistent with the first hypothesis. This may be correlated with the relatively higher content of soil organic C and its light fraction in the thinning plot.The growth of the understory,e.g.,shrubs and herbs,in forest gap areas provides another possible source of C into soil through root exudates(Wetzel and Burgess,2001),although we did not measure understory biomass.Another important factor was that the soil microbial biomass C in the thinning plot was generally relatively higher compared to the control throughout the growing season,and there was a positive correlation between RHand soil microbial biomass C in the two treatments.
Compared to the slight increase in RH, the RAin the thinning plot was 44%higher than that of the control,also contrary to the first hypothesis.There may be two likely reasons for this result. First, fine root biomass was relatively higher in the thinning plot, which might result in higher growth and maintenance respiration of root systems(Luo and Zhou,2006).Root activity could be stimulated as competition for belowground nutrients and water decreased with respect to a reduction in tree density(Chenget al.,2015;Leiet al.,2018).This would increase the growth of understory shrubs and grasses, which might also contribute to increased RA(Leiet al., 2018).Second, removal of trees after thinning increases the light availability within the lower canopy,which then promotes photosynthesis of aboveground parts(Forresteret al.,2012),and this would in turn stimulate the growth of roots(Hopkinset al.,2013),given that above-and belowground activities are highly correlated(Högberget al.,2001).

Fig.5 Relationships between soil respiration(RS)and heterotrophic respiration(RH)and soil microbial biomass C in un-thinning and thinning plots.Outliers were not included in the regression analysis.Error bars represent standard errors of the means(n=3).R2 =coefficient of determination.
Temperature sensitivity of soil respiration
Soil respiration was exponentially correlated with soil temperature,consistent with other studies conducted in temperate forests in northeastern China(Wang and Yang,2007;Han and Jin,2018).At the annual scale,theQ10of RHin the thinning plot was slightly lower compared to the control.As we mentioned above,this may be linked to the input of labile organic C resulting from enhanced root activity and higher fine root biomass in the thinning plot. According to the C quality-temperature hypothesis,theQ10of microbial decomposition would decrease with improvement of C availability(Wanget al., 2016). Comparatively, Chenget al.(2015)also found that thinning decreased the temperature sensitivity of RHin aPinus tabulaeformisplantation.Compared with microbial decomposition,root activity might be more driven by other factors in addition to soil temperature. The phenological change in root growth is closely connected to the phenology of aboveground rather than soil temperature,as canopy photosynthesis has been shown to be more important in driving root activity(Tanget al.,2005;Savageet al.,2013).Thinning resulted in a relatively large decline in the annualQ10of RA, especially in 2014. We determined the season-specificQ10of soil respiration and found that it was not consistent across the growing season,which implies that this may generate substantial bias in the estimation of annual soil CO2emission when using a single apparentQ10(Nohet al.,2017).The season-specificQ10values of RSand RHwere much lower in the thinning plot in the mid-growing season.This may be related to the changes in the input of available substrate during the growing season,as we mentioned above. Our results showed that fine root biomass was higher in the thinning plot. Both photosynthesis and root activity usually peak during summer (Liuet al., 2016), which could stimulate root exudation. In a specific season,RAwas usually not sensitive to changes in soil temperature. The apparent temperature sensitivity of soil respiration was the combined response of respiration to various environmental factors, including not only soil temperature but also soil moisture, substrate availability,photosynthesis, and root biomass(Chenet al., 2010; Hillet al., 2015; Wanget al., 2016; Hanet al., 2018). Within short-term periods,the response of RAto soil temperature in the thinning plot might be overridden by the effects of photosynthesis and fine root biomass(Högberget al.,2001;Hanet al.,2018).
Contributions of RH and RA to RS
We found that changes in RS,e.g., seasonal variation and temperature sensitivity, were mainly determined by RHbecause of the large contribution of RHto RS(58%—94%)(Leiet al.,2018)while the contribution of RAto RSwas relatively low(6%—42%).Forest management practices influence the balance between RHand RAthrough changes in the soil microclimate,inputs of above-and below-ground residues,and the quantities and activities of microbes and roots(Bolat,2014;Akburak and Makineci,2015,2016;Leiet al., 2018). The contribution of RAwas 17% higher in the thinning plot than in the control.This might have been caused by the increased fine root biomass and its activity.Because we conducted the measurements a long time after thinning,in addition to the increases in root growth caused by decreased competition among trees in the thinning plot,the abundant understory shrubs and grasses may further contribute to RA(Leiet al.,2018).However,it is notable that we only measured soil respiration during the growing season rather than throughout the entire year,which may lead to bias in estimating the relative contributions of RHand RA.The processes of root and rhizosphere metabolism tend to persist during the winter period(Subkeet al.,2011).Furthermore,due to the thermal insulation effect of litter cover and snow pack,soil microbes might continue to decompose organic matter during the cold season(Wanget al.,2013;Gaoet al.,2018).Hence,to accurately estimate the influences of forest management on the contributions of roots and microbes to total soil CO2emission, more annual observations are needed,especially in winter.
Effect of soil moisture on soil respiration
As we discussed above,there was no significant difference in soil moisture between the control and thinning plot,and soil moisture contributed little to the differences in RSbetween the two treatments.This contradicted our second hypothesis.Throughout the entire measurement period,we found a significant parabolic relationship between RSand RHand soil moisture both in the control and thinning plot.Generally,soil respiration rates are influenced by soil moisture in two ways.On the one hand,low soil water content limits the accessibility of substrates and the activity of soil microbial organisms(Davidsonet al.,2006;Manzoniet al.,2012); on the other hand, high soil moisture exceeding a threshold value would restrict the oxygen diffusion in the soil pore space and reduce the transportation of CO2between soil layers(Davidsonet al.,1998).
CONCLUSIONS
Our results suggest that forest thinning has positive effects on RSand its source components even for a long-term period (42 years) after thinning. In the thinning plot, RAwas 44%higher than in the control plot,which might have been caused by a higher fine root biomass. Thinning is expected to increase root growth and activity with the decreased competition among trees and understory plants for solar radiation, nutrients, and soil water. Simultaneously,the slight increase in RHcould be the result of changes in exudates,which are also linked to alterations in root density.Our results indicated that RHand RAshowed different responses to temperature changes.Soil temperature was the main driving factor for seasonal variation in RH,while RAwas less responsive to soil temperature during specific seasons. The season-specificQ10values of RSand RHwere lower in the thinning plot during the mid-growing season.Our findings are useful for predicting the long-term effects of forest management practices on soil C dynamics, and further studies concerning the mechanisms underlying forest management-induced changes in RHand RAare necessary in northeastern China.
ACKNOWLEDGEMENT
This work was financially supported by the National Natural Science Foundation of China(No.31730015)and the Fundamental Research Funds for the Central Universities,China(No.2572017EA02).
杂志排行
Pedosphere的其它文章
- Notes to Authors
- Mitigating greenhouse gas emissions from croplands and pasturelands—climate-smart agriculture
- Effects of warming,wetting and nitrogen addition on substrate-induced respiration and temperature sensitivity of heterotrophic respiration in a temperate forest soil
- Larger floods reduce soil CO2 efflux during the post-flooding phase in seasonally flooded forests of Western Amazonia
- Characteristics of greenhouse gas emissions from rice paddy fields in South Korea under climate change scenario RCP-8.5 using the DNDC model
- Effects of the nitrification inhibitor nitrapyrin and the plant growth regulator gibberellic acid on yield-scale nitrous oxide emission in maize fields under hot climatic conditions