Characteristics of greenhouse gas emissions from rice paddy fields in South Korea under climate change scenario RCP-8.5 using the DNDC model
2021-04-14WonjaeHWANGChanyangKIMKijongCHOandSeunghunHYUN
Wonjae HWANG,Chanyang KIM,Kijong CHO and Seunghun HYUN
Department of Environmental Science and Ecological Engineering,Korea University,Seoul 02841(South Korea)
ABSTRACT Understanding the greenhouse gas(GHG)emission from rice paddy fields is essential to come up with appropriate countermeasure in response to global warming.However,GHG emissions from paddy fields in South Korea are not well characterized.The objectives of this study were to estimate the carbon dioxide(CO2)and methane(CH4)emissions from rice paddy fields in South Korea,under the Representative Concentration Pathway 8.5(RCP-8.5)climate change scenario using the DNDC(i.e.,DeNitrification-DeComposition)model at 1-km2 resolution.The performance of the model was verified with field data collected using a closed chamber,which supports the application of the model to South Korea.Both the model predictions and field measurements showed that most(>95%)GHG emissions occur in the cropping period,between April and October.As a baseline(assuming no climate change),the national sums of the CO2 and CH4 emissions for the 2020s and 2090s were estimated to be 5.8×10⁶ and 6.0×10⁶ t CO2-equivalents(CO2-eq)year−1 for CO2 and 6.4×10⁶ and 6.6×10⁶ t CO2-eq year−1 for CH4,respectively,indicating no significant changes over 80 years.Under RCP-8.5,in the 2090s,CH4 emissions were predicted to increase by 10.7×10⁶ and 14.9×10⁶ t CO2-eq year−1,for a 10-or 30-cm tillage depth,respectively.However,the CO2 emissions gradually decreased with rising temperatures,due to reduced root respiration.Deep tillage increased the emissions of both GHGs,with a more pronounced effect for CH4 than CO2.Intermittent drainage in the middle of the cropping season can attenuate the CH4 emissions from paddy fields.The findings of this work will aid in developing nationwide policies on agricultural land management in the face of climate change.
Key Words: CH4,CO2,model performance,paddy soil,rising temperature,tillage depth
INTRODUCTION
According to the Fifth Assessment Report of the Intergovernmental Panel on Climate Change(IPCC),the global atmospheric carbon dioxide (CO2) concentration in 2011 was 391µmol mol−1,approximately 40%higher than the pre-industrial level in 1750. The Earth’s annual average temperature had risen by 0.85◦C for the 133 years between 1880 and 2012(IPCC,2013).The major greenhouse gases(GHGs)affecting temperature rise are CO2,methane(CH4),and nitrous oxide (N2O), all of which are predominantly emitted from anthropogenic processes in the industrial and agricultural sectors.Global anthropogenic GHG emissions from arable land through agricultural activities are estimated at 13.5%of the total emissions(IPCC,2007).
Rice(Oryza sativaL.)is a highly important food crop that feeds more than 50%of the world’s population(Zhou and Sun,2017).Currently,Asia accounts for approximately 91%of the global rice growing area and 88%of global rice production(FAO,2012).Flooded rice paddies are considered a significant anthropogenic source of CH4because of the favorable anaerobic conditions for the growth of methanogens(IPCC,2013).Moreover,CH4is 28 times more powerful than CO2,in terms of the global warming potential(GWP).Both soil properties and local meteorological conditions,such as the soil organic carbon(SOC),clay content,temperature,and moisture, are known to affect CH4emissions from paddy fields (Le Mer and Roger, 2001). The emission of CO2through soil microbial respiration from cultivated land is also significant(Davidson and Janssens, 2006). Common agronomic practices, such as tillage, can facilitate SOC oxidation(Osunbitanet al.,2005)by enhancing the oxygen(O2)supply in paddy fields(Huanget al.,2016).
South Korea’s agricultural area is small, with most cultivated lands sporadically distributed across the country(KOSIS,2012).When a predictive model is performed at a large scale(e.g.,12.5 km2),there is high uncertainty due to the associated inaccuracy with dispersed and small sized land.For this reason,it is necessary to perform model simulation with a high resolution(e.g.,1 km2),based on high-resolution weather and soil data,to more precisely estimate the total national GHG emissions from South Korea.
So far,many process-based models,such as DNDC(i.e.,DeNitrification-DeComposition), DAYCENT (i.e., Daily Century),and COUP(i.e.,Coupled Heat and Mass Transfer),have been developed to estimate GHG emissions in different countries (Liet al., 1992; Partonet al., 1996; Jansson and Moon,2001).The DNDC model presents a technical advantage over other models because it can simultaneously estimate the daily CO2, CH4, and N2O emissions from cultivated land such as rice paddies as affected by various agronomic practices(Liet al.,2011).To utilize DNDC as a successful predictive tool,the results of the model prediction must be verified using field measurements.In many countries(e.g.,Australia,China,India,and USA),the verification of the DNDC model has been conducted by utilizing long-term field data under various local environmental conditions and comparing the data to the model(Liet al.,2011).In South Korea,however,few attempts have been made to verify the performance of the DNDC model using field measurements.A recent exception was the case of Chunet al. (2016),who conducted a comparative study of the CH4emissions between the model prediction and a single field measurement in a paddy field in Jeolla Province.In addition,the prediction of GHG emissions with a high-resolution(e.g.,1 km2),at a nation-wide scale,has yet to be performed in South Korea.
Therefore,the objectives of this study were to i)simulate emissions of two GHGs(CO2and CH4)of from rice paddy fields in South Korea using the DNDC model with a resolution of 1 km2,ii)validate the model results through two-year field measurements of the GHG emissions, and iii)evaluate the effect of tillage depth(10 and 30 cm)and flooding conditions(continuous and intermittent)under the Representative Concentration Pathway 8.5 (RCP-8.5) climate change scenario on the GHG emissions from rice paddy fields across the country.
MATERIALS AND METHODS
Model description
In this study,we used DNDC version 9.5(http://www.dndc.sr.unh.edu/),which was developed in 2012.The DNDC model is a biogeochemical model based on the daily circulation of carbon(C)and nitrogen(N)in agricultural ecosystems(Liet al.,1992).This model can predict emissions of major GHGs, such as CO2, CH4, nitric oxide (NO), and N2O,from the biochemical processes of C and N in agricultural ecosystem.
Site description and model input data
South Korea occupies the southern portion of the Korean Peninsula, which lies in 33◦09′—38◦45′N and 124◦54′—131◦06′E,with a total national land area of 100 019 km2(Fig. S1, see Supplementary Material for Fig. S1). The terrain of South Korea is rumpled and mostly mountainous(63%),with the arable lands primarily located in the west and southeast(KOSIS,2012).For a 1-km2scale resolution,the shapefile format (1:50 000 scale) of the land use data was obtained from the Korea Ministry of Environment.The total paddy land was spilt into 63 808 1-km2grid cells.The total area of the paddy land, calculated by integrating its actual coverage over the 63 808 grid cells,was approximately 12 600 km2(about 13%of the total national land area).
To identify the regional differences in the input data(climate and soil)and GHG(e.g.,CO2and CH4)emissions,the range was expressed based on five administrative districts,Chungcheong,Gangwon,Gyeonggi,Gyeongsang,and Jeolla provinces.The geographical locations of the provinces are depicted in Fig.S1a.
The input data used in the DNDC model prediction are listed in Table I.For the meteorological data,the RCP-8.5 climate change scenario, based on the HadGEM3RA model,was used.RCP-8.5 is considered the‘high-end’case and is often used to simulate an extreme case of climate change.The daily maximum/minimum temperature(◦C)and precipitation(mm)data that correspond to the RCP-scenario were obtained from the Korea Meteorological Administration(KMA)(http://climate.go.kr).The ranges of the climate data for each administrative district are shown in Fig. S2 (see Supplementary Material for Fig.S2).The baseline scenarioover the model prediction period,from 2016 to 2095,was set to the actual measured 2011 weather data.Climate data were obtained from 75 weather stations across the country in 2011 and then interpolated with a 1-km2grid cell using inverse distance weighting and kriging(Marchettiet al.,2012).
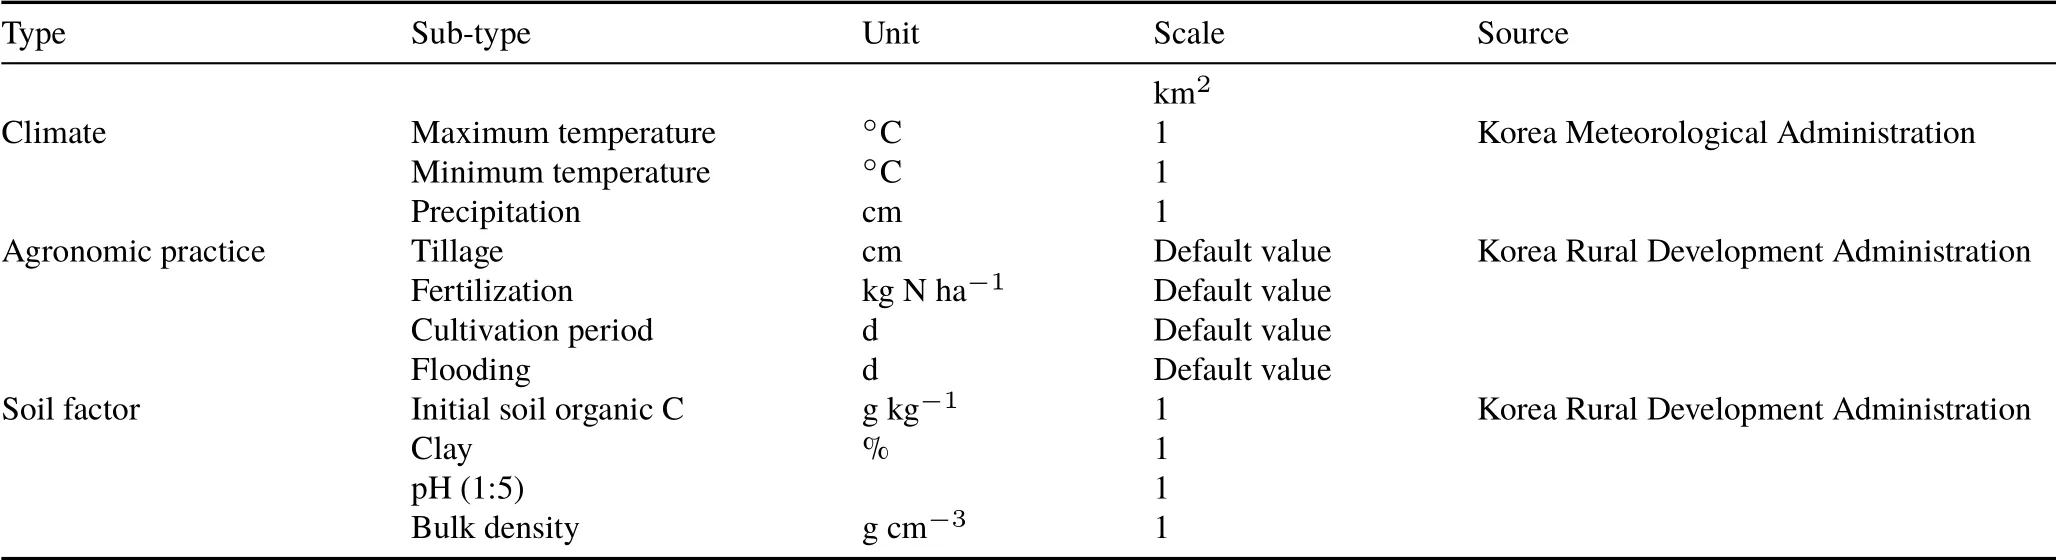
TABLE I Input data for the DNDC(i.e.,DeNitrification-DeComposition)model
For the agronomic data,the common practices recommended by the Korea Rural Development Administration(KRDA)for rice cultivation were applied.The rice cultivation period was set from April 30 to October 21,and tillage was carried out on April 9.Fertilization was assumed to be at a rate of 50 kg N ha−1before rice transplantation(April 8)and 20 kg N ha−1in the middle of the growing season(July 28).As for an irrigation practice,initial continuous flooding from April 14 to July 17 and subsequent intermittent flooding at 5-d intervals from July 27 to September 26 were assumed.Model prediction was run for tillage depths of 10 and 30 cm(referred to as the 10T and 30T conditions,respectively).
The soil chemical data(e.g.,initial SOC and pH)were obtained from a soil database of approximately 365 000 data points established by KRDA. The soil physical data(e.g.,clay content and bulk density)were reprocessed at a spatial resolution of 1 km2on the basis of 377 domestic representative soil series from a 1:25 000 scale soil map.Approximately 61.4%of the soil properties were explained by actual measurements,while the remainder was estimated by interpolation with 1-km2grid cells through the Kriging method(Omran,2012).The distribution of the soil data is shown in Fig.S2.
Following the 5-year spin-up period from 2011 to 2015,we performed an 80-year prediction from 2016 to 2095.The results of the GHG emissions for every ten-year period(2016—2025,2026—2035,etc.)were averaged and referred to as the 2020s, 2030s,etc., respectively. Both CO2and CH4emissions were converted to CO2-equivalents(CO2-eq) using the reported values of specific global warming potentials. Thus, GHG emissions from paddy fields are expressed in t CO2-eq ha−1year−1,unless otherwise noted.
Experimental site and basic input data collection for DNDC model verification
To validate the DNDC model prediction,CO2and CH4emissions were measured from a rice paddy field(37◦35′1′′N,127◦14′16′′E)at the Korea University Agricultural Farm(Deokso field), located in Gyeonggi Province (Fig. S1).During January 2015 and November 2016,GHG emissions were measured approximately once a month(22 data points for CO2and 21 for CH4).The average values of the minimum and maximum annual air temperature during the observation period were 7.7 and 18.9◦C,respectively,and the annual cumulative precipitation was 847 mm.The agronomic practices executed at the Deokso field are slightly different from KRDA recommendations as summarized in Table II.Thecultivation period was from May 1 to October 21,with tillage carried out at a depth of 10 cm on April 10.For fertilization,50 and 20 kg N ha−1was applied on April 10 and July 29,respectively.Intermittent flooding was performed from April 15 to September 24,with 5-d intervals.To characterize the field soil,six composite samples were collected and selected properties(e.g.,bulk density,clay,initial SOC,and pH)were determined.
Measurement of CO2 and CH4 emissions
The GHG measurement system consisted of the closed chamber and the measuring unit in which a moisture filter,a direct current (DC) pump, a flow meter, a gas detector,and a data logger are sequentially connected(Fig.S1).The chamber was an opaque acrylic cylinder with a diameter of 30 cm, a height of 20 cm, and a volume of 25.1 L.During flux measurement,5 cm of the anchor in the cylinder bottom was inserted into the soil. A closed chamber is designed to collect the gas emitted from the soil surface,according to the gas concentration gradient between the soil and chamber. This system detects the concentration change over time until the CO2and CH4concentrations reach steady states in the chamber (Malyanet al., 2016).The gas collected in the chamber is allowed to flow to the measuring unit through a 4-mm polyurethane tube and then circulate back to the chamber.The detector unit is composed of a CO2sensor(Soha-Tech,South Korea),with a detection range of 1—3 000µmol mol−1,and a CH4sensor(Axetris,Switzerland),with a detection range of 1—100µmol mol−1.The DC pump(Motorbank,South Korea)and the air flow meter(Dwyer,USA)were installed to maintain a constant gas flow rate(ca.1 L min−1)of air between the chamber and the detector,thereby creating a continuous air circulation system.In the field, the measurements were repeated twice (e.g.,8:00—11:00 a.m. and 3:00—6:00 p.m.) on a given day and the two measurements were used to obtain a daily average.Each measurement took approximately 3 h.Prior to the field measurements, the system was calibrated using CO2and CH4standard gas(N2balance,11.0 MPa)at 500,1 000,and 2 000µmol mol−1for CO2and 5,10,and 50µmol mol−1for CH4.The coefficients of determination were 0.999 and 0.991 for the CO2and CH4calibration curves,respectively.
The concentrations of CO2and CH4in the chamber were detected once per second and the gas flux(F,mg CO2/CH4m−2h−1)was calculated using Eq.1(Malyanet al.,2016):
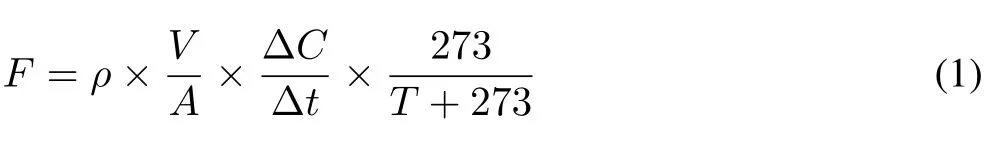
whereρis the density of the gas(mg m−3),Vis the volume of the chamber(m3),Ais the bottom area of the chamber(m2),is the average rate of concentration change (µmol mol−1h−1), andTis the average temperature in the chamber(◦C).
Statistical analysis
To validate the DNDC model performance,the model efficiency(ME)and coefficient of determination(r2)were employed as shown in Eqs.2 and 3(Vaezi,2014):
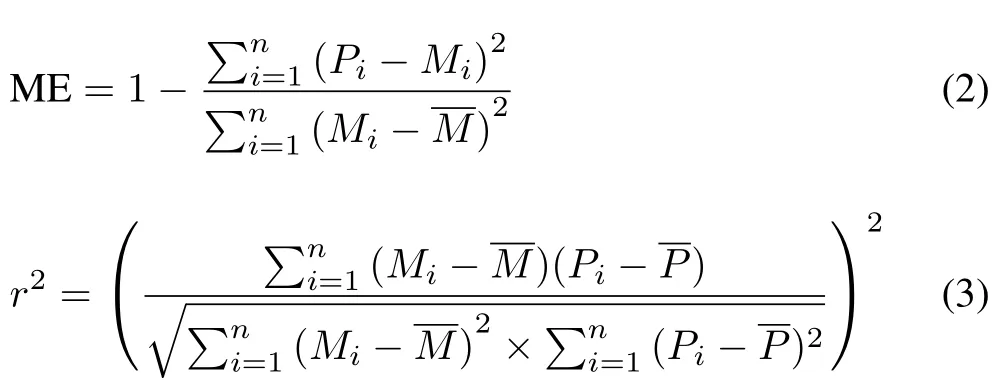
wherePiis the predicted value,Miis the measured value,iis the number of measured values,andandare the means of the predicted and measured values,respectively.
RESULTS AND DISCUSSION
Field measurements and model prediction
The precipitation and air temperature data during the experimental period (January 2015—November 2016) are provided in Fig.1a.The field measurements of CO2and CH4emissions(open circle)are shown in Fig.1b,c,respectively,along with the results of the DNDC model prediction for the respective gas(closed circle).Information regarding the rice cultivation period,flooding/drainage,and the time points of tillage and fertilization are also given.For comparison,the results of the GHG emissions were converted to values in kg CO2-eq ha−1d−1.Two points should be noted here.Firstly,the predicted emissions of CO2and CH4ranged 1.5—181.7 and 0.02—17.7 kg CO2-eq ha−1d−1,respectively,both of which are quite similar to the field measurements.Secondly,for both the field and model data,the most(>85%)GHG emissions from paddy fields occurred during the cropping seasons(April—October).In particular,CH4emissions were negligible(<2.3%)during the non-cropping seasons.
The field measurements of the daily CO2emissions ranged 1.1—159.1 kg CO2-eq ha−1d−1(n= 22), with a daily average of 37.4 kg CO2-eq ha−1d−1over the two years (Fig. 1b). The average value is more than twice the value measured from a continuously flooded paddy field(i.e.,15.0 kg CO2-eq ha−1d−1)located in the Gyeongsang Province (Haqueet al., 2015). Note that the intermittent flooding method was employed in this work,in which 5-dinterval aerobic conditions were applied 20 times during the cropping season.Upon removal of the floodwater by drainage,the soil microbial respiration substantially increases,thereby producing more CO2(Aulakhet al., 2001). Furthermore,the diffusive transport of CO2can be strongly enhanced under intermittent draining compared to continuous flooding(Hillel,1998).
The average CO2emissions in May,just after rice transplanting, were 40.1 kg CO2-eq ha−1d−1. This value is 5.1 times greater than that in March(7.8 kg CO2-eq ha−1d−1). In particular, the emissions increased sharply from May to July, exhibiting a maximum of 159.1 kg CO2-eq ha−1d−1in July,which is consistent with the rising pattern of average daily temperatures during this period.Soil temperature is known as an important climate factor affecting CO2emissions from soil(Huanget al.,2016).With rising soil temperature,microbial enzymatic activity for SOC decomposition is enhanced and thus more CO2is generated(Davidson and Janssens,2006)as long as the O2supply is sufficient enough to maintain the aerobic conditions.
The field measurements of the daily CH4emissions ranged 0.3—13.0 kg CO2-eq ha−1d−1(n=21),with a daily average of 2.9 kg CO2-eq ha−1d−1for the two years(Fig.1c).As described earlier,most of the CH4emissions occurred during the rice growing season from May to October,when the paddy field was intermittently flooded.Methanogenesis,which requires strict anaerobic conditions and low redox potentials (< −200 mV), is established when the paddy soil is submerged by floodwater during the rice growing season(Le Mer and Roger,2001;Yang and Chang,2001).In addition,CH4emissions are also influenced by the number and duration of drainage periods(Minamikawaet al.,2014).Yang and Chang(2001)found that CH4emissions reduced when the redox potential was increased(up to−100 mV),through intermittent drainage after the extended duration of flooded conditions with a low(−200 mV)redox potential.When the soil is saturated by flooding after tillage operation,methanogenesis begins within 10—21 d when the soil redox potential decreases down to−200 mV or less(Le Mer and Roger, 2001). This trend is consistent with the prediction model in this study, as CH4emissions first occurred on the 14th day after flooding (Fig. 1). During this time, the reduced bulk density, caused by intensive tillage, would further promote CH4emissions.Facilitated transformation of SOC into dissolved organic C(DOC),which might develop during the initial 5—7 d of aerobic conditions,can likely exist in paddy soils more so in the case of deep tillage rather than shallow tillage just prior to the introduction of flooding(Le Mer and Roger,2001;Snyderet al.,2009).
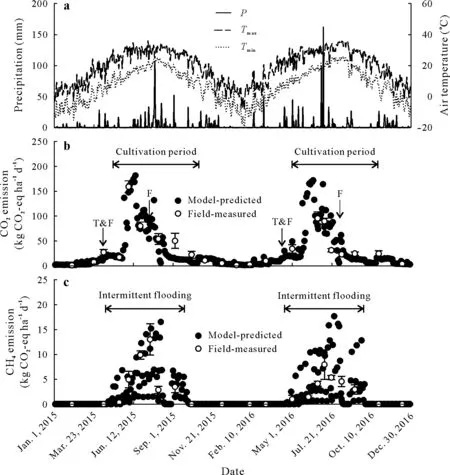
Fig.1 Daily maximum and minimum air temperatures and precipitation during the experimental period(2015—2016)(a)and comparisons of the DNDC(i.e.,DeNitrification-DeComposition)model-predicted and field-measured CO2 (b)and CH4 (c)emissions from a rice paddy field in Deokso,South Korea.CO2-eq=CO2-equivalents;P =precipitation,Tmax =maximum air temperature;Tmin =minimum air temperature;T=tillage;F=fertilization.
For measurements performed in a continuously flooded Korean paddy field,Gutierrezet al.(2013)reported daily CH4emissions of 55.2 kg CO2-eq ha−1d−1(n=6)during the cropping season, which is more than four times the maximum daily value of 13.0 kg CO2-eq ha−1d−1in this study.A similar flooding effect has been reported for other Asian paddy fields.For example,in a Japanese paddy field,annual CH4emission was reduced from 1.1 to 0.4t CO2-eq ha−1year−1after implementation of two drainage practices during the growing season(Minamikawaet al.,2014).
Model verification
The field measurements of the CO2(n=22)and CH4(n=21)emissions were plotted with their respective model prediction in Fig.2,along with the ME andr2values between the two datasets.The ME value is an analytical technique that compares the squared sum of the absolute error with that of the difference between the measured value and mean measured value(Eq.2).The ME value has a range between—∞and 1.A value closer to 1 indicates a greater similarity between the measured and predicted values.The ME for CO2and CH4was 0.82 and 0.83,respectively.Ther2value is the most commonly used regression coefficient,which indicates the ability of the model to explain variations in the measured values (Eq. 3). The closer ther2value is to 1, the better the model matches the pattern of the measurements. Ther2values for CO2and CH4are 0.82 and 0.86,respectively,atP <0.001, indicating a strong agreement between the model prediction and field measurements.
Annual CO2 and CH4 emissions across South Korea
The data range of the model prediction(63 808 cells)of annual GHG emissions was presented in boxplots as a function of the administrative districts(Figs.3 and 4).For a graphic view,GHG emissions are also depicted in Fig.S3(see Supplementary Material for Fig.S3).The magnitude of emissions were grouped into 10 different classes and denoted by 10 different colors.
Regional variation according to administrative districts.In the 2020s,the average CO2emissions in the five administrative districts were in the order of Jeolla>Gyeongsang≈Gangwon>Chungcheong>Gyeonggi(Fig.3),which is consistent with the initial SOC content used as the DNDC model input data.For Chungcheong and Gyeonggi,the CO2emissions were lower than the national average, which is likely due to their initial SOC contents.The average initial SOC contents in Chungcheong and Gyeonggi were 13.3 and 12.6 g kg−1,respectively,both of which are lower than the national average of 14.2 g kg−1.
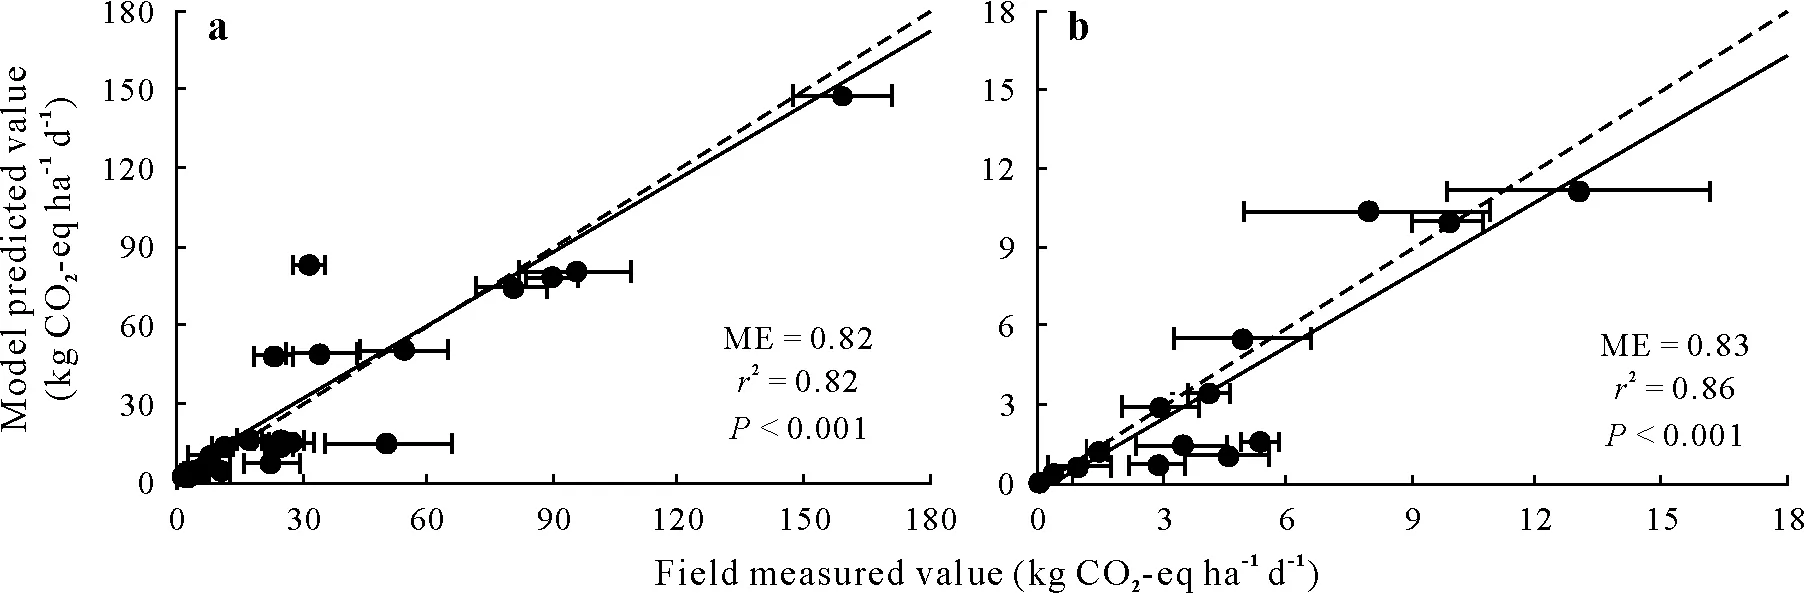
Fig.2 Comparison between the DNDC(i.e.,DeNitrification-DeComposition)model-predicted and field-measured CO2 (a)and CH4 (b)emissions from a paddy field in Deokso,South Korea.The dotted lines are imaginary 1:1 lines.Data points of measured greenhouse gas emissions are the means of duplicates with the standard deviations as error bars.CO2-eq=CO2-equivalents;ME=model efficiency;r2 =coefficient of determination.
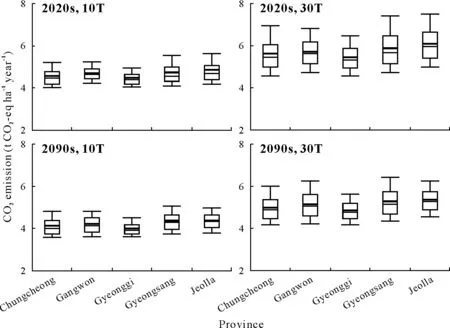
Fig.3 Boxplots of CO2 emissions from paddy fields with a 10-cm(10T)or 30-cm(30T)tillage depth predicted for five provinces in South Korea under the Representative Concentration Pathway 8.5(RCP-8.5)scenario in the 2020s and 2090s using the DNDC(i.e.,DeNitrification-DeComposition)model.The lower and upper borders of each box represent the 25th and 75th percentiles,respectively,and the horizontal and bold horizontal lines within the box indicate the median and average values,respectively.CO2-eq=CO2-equivalents.

Fig.4 Boxplots of CH4 emissions from paddy fields with a 10-cm(10T)or 30-cm(30T)tillage depth predicted for five provinces in South Korea under the Representative Concentration Pathway 8.5(RCP-8.5)scenario in the 2020s and 2090s using the DNDC(i.e.,DeNitrification-DeComposition)model.The lower and upper borders of each box represent the 25th and 75th percentiles,respectively,and the horizontal and bold horizontal lines within the box indicate the median and average values,respectively.CO2-eq=CO2-equivalents.
The sequence of the annual CO2emission remained unchanged until the 2090s,indicating that the level of SOC stocks was mainly responsible for the magnitude of the CO2emissions from paddy fields.The range of annual CO2emissions in the 2020s was between 3.9 and 5.6t CO2-eq ha−1year−1,with a national average of 4.7t CO2-eq ha−1year−1(Fig.3).These values were similar to the results of Pathaket al. (2005) who, using the DNDC model, in the 2010s estimated 2.2—8.8 kg of CO2emissions from paddy fields in India. In this study, the annual average of CO2emissions was slightly reduced to 4.3t CO2-eq ha−1year−1in the 2090s,which is consistent with the declining of the 10-cm depth SOC stocks from 17.6t C ha−1in the 2020s to 16.1t C ha−1in the 2090s(Fig.S4,see Supplementary Material for Fig.S4).
For the average annual CH4emissions in the 2020s,the order was Jeolla>Gyeongsang≈Chungcheong≈Gyeonggi>Gangwon,and the range of the data was between 3.3 and 7.0t CO2-eq ha−1year−1, with a national average of 5.1t CO2-eq ha−1year−1(Fig. 4). Among the five districts,the average of Gangwon was the lowest at 4.6t CO2-eq ha−1year−1.As shown in Fig.S2,the five districts showed significant variation in the annual temperature due to their geographic locations. In the DNDC model, the microbial activity of methanogens is assumed to increase exponentially with temperature rise(Fumotoet al.,2008).Thus,the low CH4emissions from Gangwon are most likely due to its lower annual temperatures (approximately 2◦C) than the national average for a given period. The annual averages of Gangwon were 10.1◦C and 14.4◦C for the 2020s and 2090s,respectively,whereas the national averages were 12.2◦C and 16.3◦C for the 2020s and 2090s,respectively.
Gutierrezet al.(2013)performed CH4emission measurements in eight different locations in South Korea between 2010 and 2011.Their results for the annual CH4emissions were between 5.1 and 12.6t CO2-eq ha−1year−1,which are greater than the results in this work due to the continuous flooding practice employed in their study. However, CH4emissions estimated for Indian paddy fields ranged between 0.2 and 3.5t CO2-eq ha−1year−1(Pathaket al.,2005),which are approximately 70% less than the results found in this study.This difference was presumably due to the low SOC content (2.0—8.0 g kg−1) in India, which is considerably lower than the average SOC(14.2 g kg−1)in South Korea.
Effect of tillage depth.Tillage practices performed on agricultural lands can influence the physicochemical properties of soils and level of GHG production(Le Mer and Roger,2001).Intensive tillage can disrupt soil aggregates and promote SOC decomposition, which can lead to the formation of CO2or CH4,depending upon the degree of the redox potential of the soil(Osunbitanet al.,2005;Snyderet al.,2009).In this study,the predicted emissions of both CO2and CH4,from a given grid cell,with 30T were always higher than those with 10T.
The annual averages of CO2emissions under the 30T condition were 20.9%—25.9%higher than those under 10T across the administrative districts in the 2020s(Fig.3).In the 2090s,the difference between these two conditions was 19.8%—24.3%due to the reduced SOC stocks by that time(Osunbitanet al.,2005).Note that the depletion of SOC in paddy fields was more pronounced at 30T,which decreased by 3.4t C ha−1over 80 years(Fig.S4).
Meanwhile, the effect of tillage depth would be more apparent on CH4emissions.Across the five administrative districts,the CH4emissions under the 30T condition would be 34.8%—45.9%higher than those under 10T for the 2020s(Fig. 4). The CH4emissions under tillage effect would increase by 37.3%—47.1%in the 2090s when two synergetic effects from deep tillage(Snyderet al.,2009)and temperature rise(Le Mer and Roger,2001)are occurring concurrently,even though the SOC levels were lower.
Temporal changes between the 2020s and 2090s.National emissions of CO2and CH4from entire paddy fields in South Korea are shown in Fig.5 as a function of time(from the 2020s to 2090s). The baselines, assuming no climate change,are also shown as dotted lines(30T)or dashed lines(10T),both of which would not significantly vary during the observation period.
The national CO2emissions were predicted to steadily decline until the 2090s, mostly due to the reduction of SOC stocks under the RCP-8.5 scenario.With 10T tillage,CO2emissions in the 2020s would be 5.8×10⁶t CO2-eq year−1and decrease by approximately 0.5×10⁶t CO2-eq year−1until the 2090s. With 30T, CO2emissions in the 2020s were predicted to increase by 24.1% compared to those of the 10T scenario. As mentioned previously, for microorganisms,deep tillage can improve the accessibility of SOC on the surfaces of soil particles,thereby promoting oxidative degradation of SOC and producing more CO2(Osunbitanet al.,2005).As climate change proceeds until the 2090s,the CO2emissions for the 30 cm tillage practice would gradually reduce by 11.1% from 7.2×10⁶to 6.4×10⁶t CO2-eq year−1. The decrease in the root growth at a soil temperature above 25◦C may be attributed to the inhibition of the formation and elongation of the main roots(Arai-Sanohet al.,2010).The inhibition of root growth will reduce the amount of oxygen diffused into the rhizosphere soil through the rice aerenchyma, which in turn causes a decline in the CO2production because of a decrease in the respiration rate(Kludzeet al.,1993).In the DNDC model,the oxygen required for the decomposition of SOC to humus,litter, and DOC is calculated in proportion to the mass of the roots during flooding(Fumotoet al.,2008).The results of the DNDC model also showed that root growth in the 2090s would decrease by 8.1% and 10.2% with 10- and 30-cm tillage(data not shown here),respectively,compared to the 2020s,which is in agreement with the decline in CO2emissions.
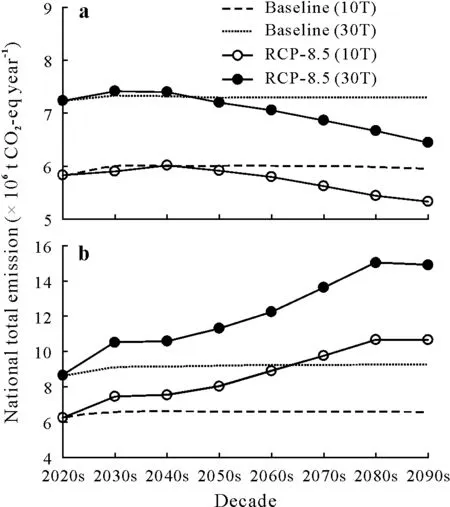
Fig. 5 Estimates of the total national CO2 (a) and CH4 (b) emissions from paddy fields with a 10-cm(10T)or 30-cm(30T)tillage depth for the 2020s—2090s under the Representative Concentration Pathway 8.5(RCP-8.5)scenario in South Korea.The baseline emissions are estimated based on the assumption that there is no climate change.CO2-eq=CO2-equivalents.
Meanwhile,the national CH4emissions would increase at a higher rate, in spite of the gradual depletion of SOC stocks under the RCP-8.5 scenario.For example,with a 30-cm tillage depth,CH4emissions would increase by 73.2%from 8.6×10⁶t CO2-eq year−1in the 2020s to 14.9×10⁶t CO2-eq year−1in the 2090s. As noted earlier, the CH4production is a result of methanogenic fermentation with a C source,and the activity of methanogenesis exhibits a strong positive correlation with temperature(Le Mer and Roger,2001;Malyanet al.,2016).Therefore,it can be stated that for the two parameters that have an opposite effect on CH4emission,the impact of temperature rise overwhelms that of SOC depletion,thus leading to increased CH4emissions under the RCP-8.5 scenario in the 2090s.
Limitations and implications of this study
The accuracy of the high-resolution prediction model is strongly dependent on the quality of the input data(Lugatoet al., 2010). The performance of the DNDC model was assessed through verification with field measurements.However,there were a couple of limitations related to the quality of the input data, which might inevitably lead to uncertainty in the model prediction.
Firstly,because the DNDC model predictions were made on the basis of high-resolution(1 km2)soil and weather data,highly accurate GHG estimations were expected.However,the model was run using the average soil data per grid cell.If the DNDC model was run with the minimum/maximum soil input data from each grid,the uncertainty of the model prediction would be reduced.Therefore,the minimum/maximum soil data for each grid should be constructed and applied for more accurate model predictions.
Secondly,the common agronomic practices for rice cultivation recommended by the KRDA(crop data, the level and timing of fertilization,etc.)were employed,as it is very difficult to collect the data of agronomic practices actually applied in each grid cell.The amount,timing,and type(e.g.,organic or chemical)of fertilizer might have a significant effect on the model prediction of GHG emissions(Chenet al.,2016).In addition,the calibration of the crop data in the performance highly affects the accuracy of the results(Hastingset al.,2010).The results of this study were based on crop data(e.g.,maximum crop yield and water demand)obtained from typicaljaponicarice that is generally cultivated in South Korea.Therefore,to reduce the uncertainty,a governmentdriven commitment to collect agronomic practice and crop data from regional administrative units is desired.
Meanwhile,national GHG emissions can be estimated using Tier 1, 2, or 3 methodologies: Tier 1 relies on a widespread emission factor;Tier 2 utilizes a country-specific emission factor;and Tier 3 encompasses direct measurement and modeling approaches through national application(Reayet al.,2012).In the USA,Tier 3 N2O emissions have already been estimated based on weather data with a resolution of 1 km2,national-level soil data and agronomic practices data(USEPA,2013).Until now,South Korea has been assessing CH4emissions in rice paddy fields utilizing the Tier 2 country-specific emission factors (GIR, 2015). Thus, the results of this study(national CO2and CH4emissions)are meaningful,since this work is the first application of a Tier 3 modeling approach to paddy fields in South Korea using 1-km2scale weather and soil data.More accurate Tier 3 GHG estimates can be performed when minimum/maximum soil data,agronomic practices data,and crop data are collected and used as input data.
CONCLUSIONS
The objective of this study was to estimate the CO2and CH4emissions from entire paddy fields in South Korea under the climate change scenario RCP-8.5.This estimation was made using the DNDC model with weather and soil data at a resolution of 1 km2,between the 2020s and 2090s.In the absence of climate change, national CO2and CH4emissions would exhibit no significant differences between the 2020s and 2090s,ranging 5.8×10⁶—6.0×10⁶and 6.4×10⁶—6.6×10⁶t CO2-eq year−1,respectively.Under the RCP-8.5 scenario, however, the emissions of CH4in the 2090s would increase by 72.6%and 73.2%with the practice of 10- and 30-cm-deep tillage, respectively, compared to the 2020s.On the other hand,the emissions of CO2would decrease steadily under the same circumstances,most likely due to a reduced oxygen demand by the rice root system and the depletion of SOC stocks in paddy soils.The emissions of CH4from paddy fields can be greatly attenuated by intermittent flooding, while the CO2emissions were less influenced by this.In the 2090s,the differences in the regional SOC stocks and local temperatures are mainly responsible for the emissions of CO2and CH4,respectively.The results of this work indicate that the emission inventory of CO2and CH4from paddy fields in South Korea can be documented by the results of the DNDC model prediction.In addition,based on the information on the causative relationship between agronomic factors(tillage and flooding)and GHG emissions,appropriate management of national emissions of CO2and CH4,originating from all paddy fields in South Korea,can be executed in the face of climate change.
ACKNOWLEDGEMENT
This study was funded in part by the Korea Ministry of Environment (MOE)viathe Climate Change Correspondence Program(No.2014-001310008)and in part by Korea University Grant.
SUPPLEMENTARY MATERIAL
Supplementary material for this article can be found in the online version.
杂志排行
Pedosphere的其它文章
- Notes to Authors
- Mitigating greenhouse gas emissions from croplands and pasturelands—climate-smart agriculture
- Effects of warming,wetting and nitrogen addition on substrate-induced respiration and temperature sensitivity of heterotrophic respiration in a temperate forest soil
- Long-term(42 years)effect of thinning on soil CO2 emission in a mixed broadleaved-Korean pine(Pinus koraiensis)forest in Northeast China
- Larger floods reduce soil CO2 efflux during the post-flooding phase in seasonally flooded forests of Western Amazonia
- Effects of the nitrification inhibitor nitrapyrin and the plant growth regulator gibberellic acid on yield-scale nitrous oxide emission in maize fields under hot climatic conditions