Nitrapyrin effectiveness in reducing nitrous oxide emissions decreases at low doses of urea in an Andosol
2021-04-14MayelaMONGEMUOZSegundoURQUIAGAChristophLLERJuanCarlosCAMBRONEROHEINRICHSMohammadZAMANCristinaCHINCHILLASOTOAzamBORZOUEIKhadimDAWARCarlosRODRGUEZRODRGUEZandAnaGabrielaREZCASTILLO
Mayela MONGE-MUÑOZSegundo URQUIAGAChristoph MÜLLERJuan Carlos CAMBRONEROHEINRICHSMohammad ZAMANCristina CHINCHILLA-SOTOAzam BORZOUEIKhadim DAWARCarlos E.RODRÍGUEZ-RODRÍGUEZ and Ana Gabriela PÉREZ-CASTILLO∗
1Environmental Pollution Research Center(CICA),University of Costa Rica,Montes de Oca 11501(Costa Rica)
2Embrapa Agrobiology,Rod.BR 465,km 7,Seropédica,RJ,CEP 23891-000(Brazil)
3Institute of Plant Ecology,Justus Liebig University Giessen,Heinrich-BuffRing 26,Giessen 35392(Germany)
4School of Biology and Environmental Science,University College Dublin,Belfield,Dublin 4(Ireland)
5Soil and Water Management&Crop Nutrition Section,Joint FAO/IAEA Division of Nuclear Techniques in Food and Agriculture,Department of Nuclear Sciences and Applications,International Atomic Energy Agency,Vienna International Centre,Vienna 1400(Austria)
6Nuclear Agriculture Research School,Nuclear Science and Technology Research Institute(NSTRI),Karaj 3148644111(Iran)
7Department of Soil and Environmental Sciences,University of Agriculture,Peshawar 25000(Pakistan)
ABSTRACT In the tropics,frequent nitrogen(N)fertilization of grazing areas can potentially increase nitrous oxide(N2O)emissions.The application of nitrification inhibitors has been reported as an effective management practice for potentially reducing N loss from the soil-plant system and improving N use efficiency(NUE).The aim of this study was to determine the effect of the co-application of nitrapyrin(a nitrification inhibitor,NI)and urea in a tropical Andosol on the behavior of N and the emissions of N2O from autotrophic and heterotrophic nitrification.A greenhouse experiment was performed using a soil(pH 5.9,organic matter content 78 g kg−1,and N 5.6 g kg−1)sown with Cynodon nlemfuensis at 60%water-filled pore space to quantify total N2O emissions,N2O derived from fertilizer,soil ammonium(NH+4 )and nitrate(NO−3 ),and NUE.The study included treatments that received deionized water only(control,CK)and two doses of 15N-enriched urea(65(UR)and 129 mg N kg−1 (UD))without or with 350 g nitrapyrin for each 100 kg N(UR+NI and UD+NI).No significant differences were observed in soil NH+4 content between the UR and UR+NI treatments,probably because of soil mineralization and immobilization(influenced by high soil organic matter content).Nitrapyrin application failed to maintain a stable pool of labeled NO−3 due to the additional NO−3 produced by heterotrophic nitrification,which is not effectively inhibited by nitrapyrin.After 56 d,N2O emissions in UR(0.51±0.12 mg N2O-N kg−1)and UR+NI(0.45±0.13 mg N2O-N kg−1)were not significantly different;by contrast,emissions were 36.3%lower in UD+NI than in UD.It was concluded that the soil organic N mineralization and heterotrophic nitrification are the main processes of NH+4 and NO−3 production.Additionally,it was found that N2O emissions were partially a consequence of the direct oxidation of the soil’s organic N via heterotrophic nitrification coupled to denitrification.Finally,the results suggest that nitrapyrin would likely exert significant mitigation on N2O emissions only if a substantial N surplus exists in soils with high organic matter content.
Key Words: autotrophic nitrification,heterotrophic nitrification,mineral N, 15N tracer,nitrification inhibitor,tropical grass
INTRODUCTION
In the tropics, grassland systems used for grazing are frequently fertilized, which may potentially exert a high impact on nitrous oxide(N2O)emissions.Nitrogen(N)losses to the environment as N2O are of concern because of its warming potential,which is 265 times higher relative to that of carbon dioxide(CO2),and its action as an ozone-depleting agent(Myhreet al.,2013).Most of the data reported on this topic are from temperate systems,and information regarding tropical regions is limited(Breueret al.,2002),particularly from grasslands with high soil organic matter content(above 50 g kg−1)(Molina and Meléndez,2002).
Production of N2O in soils is governed by various complex microbial,physical,and chemical processes(Zamanet al.,2012).Different environmental and biological conditions and physicochemical characteristics of soils influence the relative proportions of the end products resulting from these processes(Volpiet al.,2017).Autotrophic nitrification(oxidation of ammonium(NH+4)to nitrate(NO−3))and denitrification(dissimilatory reduction of NO−3and nitrite(NO−2)to N2O and dinitrogen(N2))are linked to N fertilization(Wrageet al.,2001;Zamanet al.,2008;Saggaret al.,2013;Zhuet al.,2013),while a mechanism known as heterotrophic nitrification involves the oxidation of organic N to NO−3(Mülleret al.,2014;Zhanget al.,2015).
In general,N application rates in grasslands are higher in temperate regions(ca.57 kg N ha−1application−1)(Koci and Nelson,2016)compared to in the tropics(ca.42—46 kg N ha−1application−1)(Rivera,2008;Zamanet al.,2013).In tropical systems,N fertilization is subdivided into six or seven applications (Cabalceta, 1999), while in temperate farming systems, N is usually applied twice a year. Thus,the addition of nitrification inhibitors(NIs)to N fertilizers has been reported as an effective management practice for improving N use efficiency(NUE),given that N is retained in the root zone for a longer period, providing more time for plant uptake,and potentially reducing N loss from the soil-plant system under high application rates (Koci and Nelson,2016).
The NIs,such as 2-chloro-6-(trichloromethyl)pyridine(nitrapyrin)and 3,4-dimethylpyrazole phosphate(DMPP),have been reported to mitigate N2O emissions in agricultural systems with high N demand (Ruser and Schulz, 2015;Alonso-Ayusoet al., 2016). The majority of NIs inhibit the enzyme ammonia monooxygenase(AMO)(Ruser and Schulz, 2015). The action on AMO delays the oxidation of NH+4to NO−2,the first stage of autotrophic nitrification,thus reducing NO−3leaching losses and N2O emissionvianitrification(Trenkel,2010;Dawaret al.,2011).
The effect of NIs on N2O emission may depend on experimental conditions.For instance,although Akiyamaet al.(2010)and Ruser and Schulz(2015)reported in metaanalysis a significant reduction in N2O, Doughertyet al.(2016)and Naueret al.(2018)did not see any effect of applying urea with NIs in Australian dairy farms with ryegrass(Lolium perenneL.).Similarly,Pérez-Castilloet al.(2021)reported no effect of nitrapyrin in a Costa Rican Andosol dedicated to dairy farming, withCynodon nlemfuensisas dominant grass.Contrary to these results,experiments on intact soil cores with addition of urea plus nitrapyrin revealed that addition of NIs increased NH+4-N retention and supported a lower accumulation of soil NO−3-N content with a considerably reduced N2O flux,and a 30%—40%increase in the recovery of the total mineral N,at moisture conditions close to field capacity(Abbasiet al.,2003).
Thus,given the low mitigation action of nitrapyrin reported for Costa Rican Andosols(Pérez-Castilloet al.,2021),this study was set up under controlled conditions (greenhouse) with the aims to: i) get more information on the behavior of N and the processes of N2O production in soil,differentiating autotrophic and heterotrophic nitrification using15N tracer technique,and ii)assess if the nitrapyrin mitigation effect on N2O emissions is affected by urea application rates.In addition,potential differences in microbial community profiles were also investigated.
MATERIALS AND METHODS
Experiment setup
Soil samples(0—15 cm)were collected from a grassland site withCynodon nlemfuensisas the dominant grass, in the Alfredo Volio Mata Experimental Station of the University of Costa Rica(UCR),located in Ochomogo,Cartago(9◦54′39.08′′N,83◦57′16.99′′W,1 584 m above sea level). The soil was classified as Typic Haplustands, with a sandy clay loam texture(28%clay,12%silt,and 60%sand)(Mataet al.,2016).The soil was air-dried,sieved through a 5-mm mesh,and analyzed for basic soil properties(Table I).Soil pH was measured at a soil:water ratio of 1:2.5. Soil organic carbon(C)and total N were determined by dry combustion(Dumas method)using a vario MACRO cube CN analyzer(Elementar Analysensysteme GmbH,Germany).Effective cation-exchange capacity(ECEC)was determined by extraction of cations using 1 mol L−1ammonium acetate buffered at pH 7.Copper was extracted by KCl-Olsen methodology and quantified with an atomic absorption spectrometer(novAA 400p,Analytik Jena,Germany).The soil was characterized by high fertility with a C/N ratio of 9.8 and a high organic matter (Cabalceta and Molina, 2006).The phosphorus content and minor elements were above the recommended levels forC.nlemfuensis(Cabalceta and Molina,2006;Rivera,2008).The high copper content is of particular interest because it acts as a cofactor of the AMO enzyme,the nitrapyrin’s target(Duncanet al.,2016).
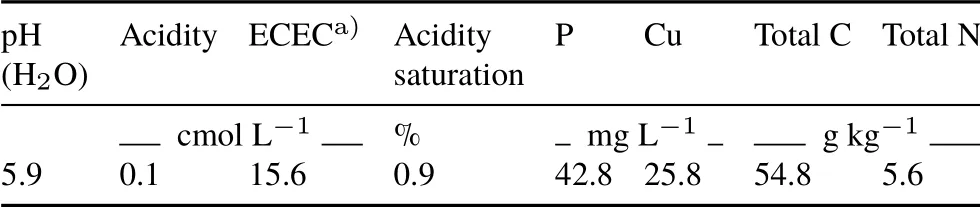
TABLE I Chemical properties of the sieved (< 5 mm) Andosol from the Alfredo Volio Mata Experimental Station of the University of Costa Rica
Based on the gravimetric soil water contents(five replications),fresh soil equivalent to 950±5 g of dry soil was placed in each pot and packed to a bulk density of 0.65 g cm−3.Two months before the initiation of the treatments,C.nlemfuensis,from the original soil location,was transplanted to the pots.
During the period of grass establishment,the pots were kept in a protected environment.Water was applied to the grass in each pot three times a week,and the grass was cut to a height of approximately 5 cm after 28 and 56 d of planting.This ensured the proper development of the pasture and their root system before the treatments were applied and prevented pasture aging through successive cuts(Villalobos and Arce,2014).
The trial was set up in two sets of pots,using a complete randomized block design.The first set,for measuring N2O emissions, included five treatments and four replications(total 20 pots).The second set,for the destructive analysis of mineral N variation in six sampling days,included only three treatments and three replications(total 54 pots).The treatments,detailed in Table II,were applied once after the cut at day 56 of the transplanting of the grass.Nitrogen was applied as urea at two rates, 65 and 129 mg N kg−1. The first dose, equivalent to 41.7 kg N ha−1, represented one of six fractions that are usually applied in dairy farming to reach the recommended dose of 250 kg N ha−1year−1forC.nlemfuensis,while the second corresponded to twice that dose.
Nitrapyrin and15N-labeled urea(2 atom%)were applied in solutions to achieve a homogenous distribution.Nitrapyrin working solution with a concentration of 32 mg L−1(below the water solubility of nitrapyrin)was prepared with deionized water at 25◦C.A volume of 25 mL of the working solution was added drop by drop on the soil surface of each pot according to the predefined treatment.Nitrapyrin was applied 2 d before the fertilization because previous studies had shown that in permanent pastures, the application of N process inhibitors a few days before the N application was more effective in reducing the combined losses of N as NH3, N2O, and NO−3, with respect to simultaneous or subsequent application(Zaman and Nguyen,2012).After urea was applied,deionized water was added by weight to achieve 60%water-filled pore space(WFPS)in all the pots.
Control of WFPS
The soil in each pot was maintained at 60% WFPS by weighing and adding deionized water.The gravimetric humidity (Hg) needed to reach that level of WFPS was determined using the following equation (Martinset al.,2017):

The moisture adjustment by weight did not consider the change in the biomass of the grass and was carried out every day the first week after the application of the treatments and three times a week from day 7 onwards.On the sampling dates for N2O,the humidity adjustment was made 15—30 min before each flux was measured. During the test, NO−3leaching was prevented by keeping the soil moisture below field capacity, which had previously been determined by saturating the soil with water and measuring humidity and weight,after 48 h of drainage.
Soil mineral N analysis and isotopic monitoring
Soil mineral N,as NH+4-N and NO−3-N,was determined on days 0,2,5,12,28,and 56 after treatment application.The soil of each pot was homogenized,after which a 25-g sample was immediately extracted with 100 mL 2 mol L−1KCl(99.999%purity,Suprapur®,Merck,Germany)for 2 h using an orbital shaker at 200 r min−1.The concentrations of NH+4and NO−3were determined by flow injection analysis on a Lachat FIA-8000 continuous flow analyzer(Hach,USA).
Contents of soil15NH+4and15NO−3+15NO−2were analyzed by the15N diffusion method modified by Mathieuet al. (2006a), in which NH+4and NO−3+ NO−2were sequentially converted from KCl extracts by first alkalizing the solution with approximately 0.1 g MgO and then,with 0.5 g Devarda’s alloy.Both NH+4and NO−3+NO−2were collected on a GF/D glass fiber disc suspended on a stainless-steel wire and impregnated with 10µL 2.5 mol L−1KHSO4.The15N isotopic analyses were carried out by the Laboratory of Stable Isotope Facility of the Department of Plant Sciences of the University of California,USA.
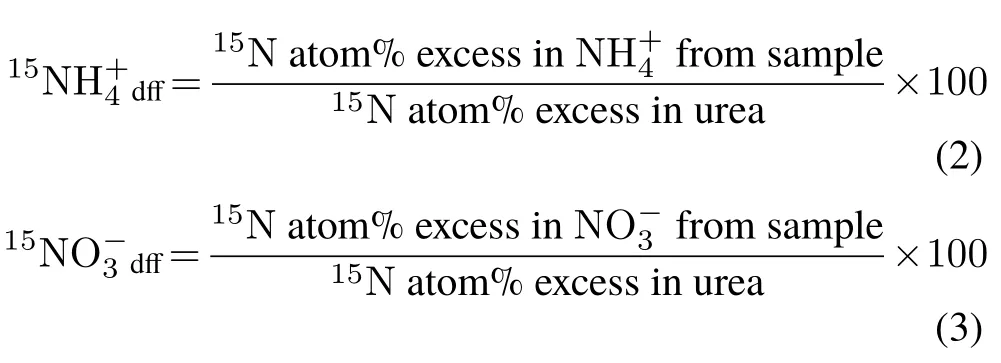
The percentages of15NH+4and15NO−3derived from fertilizer(15NH+4dffand15NO−3dff,respectively),i.e.,urea,were calculated using the following equations:
Measurement of N2O emissions and the isotopic signal of 15N2O
Nitrous oxide fluxes were measured immediately after urea application,and then every day during the first week,three times during the second week,twice a week during the third and the fourth weeks,and finally,every seven days until day 56 after fertilization.Emissions of N2O and the isotopic signal of15N2O were monitored using a cavity ring-down spectrometer(CRDS,Picarro G5102-i,Santa Clara,USA)operated in close mode at default company settings,and the static chamber methodology.The chamber,a 12-L cylindrical plastic container,consisted of a lid with two ports,one for the air outlet to the analyzer and another for the re-entry of air into the chamber.A Nafion dryer(PermaPure LLC.,Halma Holdings Company,USA)was placed to remove the excess water on the analyzer inlet.
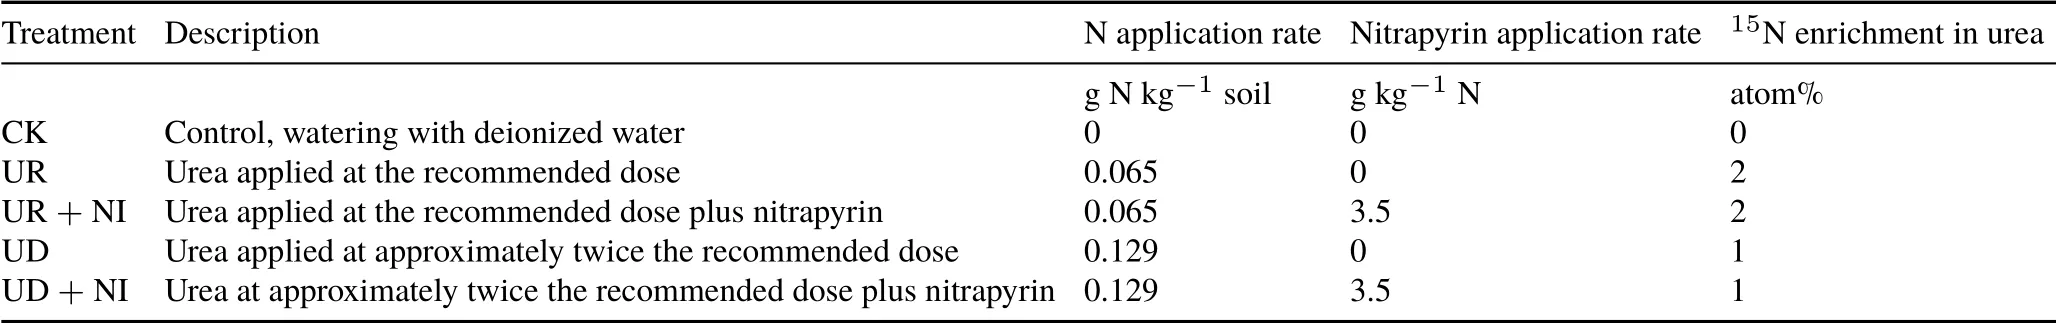
TABLE II Details of the treatments in the pot experiment conducted with an Andosol from the Alfredo Volio Mata Experimental Station of the University of Costa Rica
Each pot was sampled for 15 min after the chamber was closed,and the system was purged with ambient air for 5 min between measurements.The air temperature inside the chamber was recorded during the measuring period,and the atmospheric pressure was taken from the average daily value reported by the Station at the Geophysical Research Center of the University of Costa Rica. Proper operation of the CRDS was checked by measuring the N2O concentration of an ultrapure air cylinder and the concentration of a standard gas(0.45µmol N2O mol−1gas in air)with an uncertainty of 3%,at the beginning and end of each sampling day.The minimum detectable flux(MDF),0.128µg N2O-N kg−1soil h−1,was calculated following Christiansenet al.(2015)for the headspace volume of 0.001 5 m3(after subtracting the volume occupied by the pot),a dry soil weight of 0.95 kg,and a chamber mean air temperature of 23◦C.The quantification limit,0.384µg N2O-N kg−1soil h−1,was set to three times the MDF. The flux of N2O (F,µg N2O-N kg−1soil h−1)was calculated using the following equation:
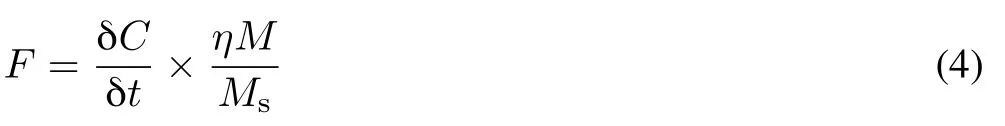
where δC/δtis the change of N2O concentration with time(µmol N2O mol−1headspace air h−1),ηis the moles of gas in the headspace,calculated using the ideal gas law,Mis the N mass(28µg Nµmol−1N2O),andMsis the dry soil weight(kg).
The change of N2O in the headspace was evaluated using a second-order polynomial fit, with the obtained concentrationvs.enclosure time.The flux at the time of coverage(t= 0) was estimated using the slope,i.e., derivative of the polynomial function (Christiansenet al., 2015). The parameterηwas evaluated with temperature and pressure recorded during the sampling of the pot,and the calculated volume,taking into account the volume of the chamber,the volume occupied by the pots,the system of hoses,and the equipment cavity.
The quadratic regression coefficient of N2O flux was used as an evaluation and rejection criterion for the N2O flux data analysis.If the quadratic regression coefficient was less than 0.96,and the flux data were lower than the detection limit,the values were replaced by the detection limit.If they were greater than 0.13µg N2O-N kg−1soil h−1but lower than the quantification limit,the reported values were kept.Finally,if the data were greater than the quantification limit,and the quadratic regression coefficient of concentration change rate of N2O was lower than 0.96, the N2O fluxes were rejected.
Cumulative N2O emissions value(Ec,mg N2O-N kg−1soil)were calculated following the trapezoidal method:
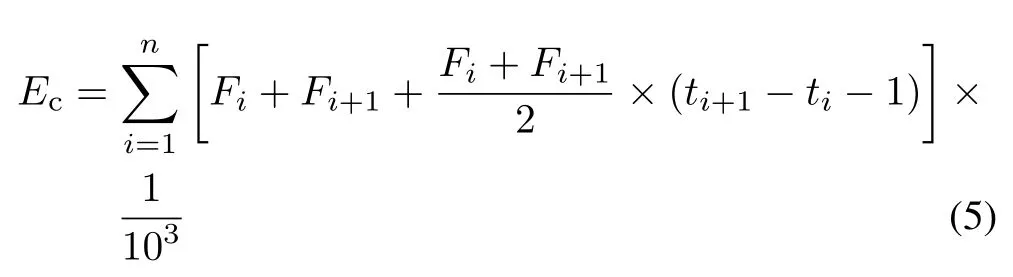
whereFiandFi+1(µg N2O-N kg−1soil h−1)are the N2O flux at timetiandti+1(h), respectively. The conversion factor 103was required to obtain values in units of mg kg−1(Chenet al.,2014).
The isotope value of the15N2O emitted(δ15N2O,‰)was obtained by Keeling plot,in which theX-axis corresponds to the reciprocal of the concentration(1/N2O)andY-axis to the value of the isotopic signal of the15N2O emitted(δ15N,‰)accumulated at timet.In this linear graph of descending slope,the intercept is equal toδ15N(Patakiet al.,2003).Then,δ15N2O was converted to15N abundance(atom%)using the following equation:

where 0.3663%is the natural abundance of15N in air.
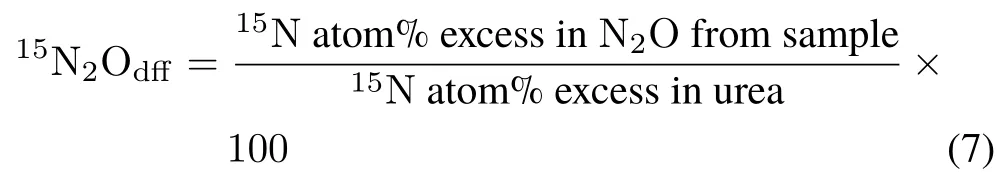
Finally,the percentage of15N2O derived from fertilizer(15N2Odff)was calculated as the quotient of15N enrichment(atom%)from the sample and15N enrichment(atom%)in urea:
Analysis of NUE
By definition,NUE is the ratio of the N(derived from the15N-enriched urea)taken up by plants to the total amount of N added(Tubert-Brohmanet al.,2013).The grass was cut 28 and 56 d after the application of the15N-labeled urea.Each sample was dried in an oven at 60◦C for 72 h.After the weight of the dry foliage was determined, the whole sample was milled to powder with a ball mill. The total N content in the foliage samples was quantified by dry combustion in an N autoanalyzer using the Dumas method in the Agronomic Research Center,UCR.The15N content in the samples was analyzed using a continuousflow isotope-ratio mass spectrometer(Finnigan DELTAplus,Thermo Fisher Scientific,Germany)coupled to the output of an ECS4010 Costech total C and N analyzer(Finnigan MAT,Germany)in the John Day Stable Isotope Laboratory at Embrapa Agrobiologia (RJ), Brazil. The amount of N derived from fertilizer in the plant(Ndfp,g)was calculated according to the following equation:
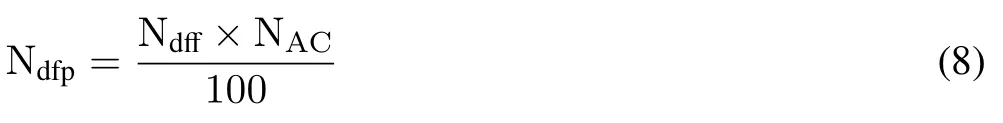
where NACis the accumulated N(g)and calculated using Eq. 9 and Ndffis the percentage of N derived from the fertilizer(%)and calculated using Eq.10:
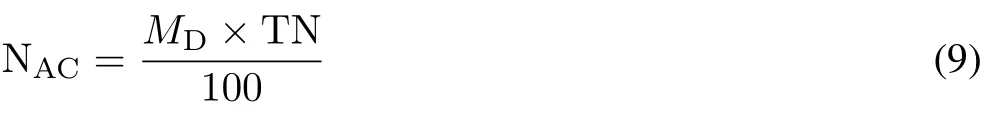
whereMDis the dry matter of the foliage(g)and TN is total N of the foliage(%);
whereAfoliageandAfertilizerare15N atom%excess(atom%)in foliage and fertilizer,respectively.
Finally,NUE(%)was calculated as:

Microbial community analysis
Total genomic DNA was obtained from soil samples(0.25 g)of the UR,UR+NI,UD+NI,and control treatments at days 0, 28, and 56(12 samples). Extraction was carried out using PowerSoil DNA isolation kit (MO BIO Laboratories, USA)following the manufacturer’s instructions. Extracted DNA was quantified, checked for purity with a 2000c NanoDrop spectrophotometer(Thermo Fisher Scientific,Germany),and maintained at−20◦C prior to amplification of the 16S rRNA genes.Polymerase chain reaction(PCR)was performed with the primers 907r/341f and denaturing gradient gel electrophoresis(DGGE)analysis of the amplicons was performed with a DCode system(Bio-Rad,USA),both according to the protocol of Castro-Gutiérrezet al.(2016).
Statistical analysis
Data distribution normality was tested using the Shapiro-Wilk test. The outliers of the N2O fluxes were evaluated using the Grubbs test. In total, 10%of all flows(34 data)were rejected.These values corresponded to pots with dead grass or with the pestPhyllophagasp.The treatments were compared using an analysis of variance(ANOVA).In the case of N2O fluxes per day of measurement,the analysis was carried out using incomplete randomized blocks because of the rejected data. The comparison of N2O cumulative emissions was done after 28 and 56 d of urea application.In all cases,significant differences between treatments were defined atP <0.05,and the Tukey test was used to separate the means.Data are presented as mean±standard deviation.Statistical data analyses were performed using Infostat version 2017.
RESULTS AND DISCUSSION
Soil mineral N
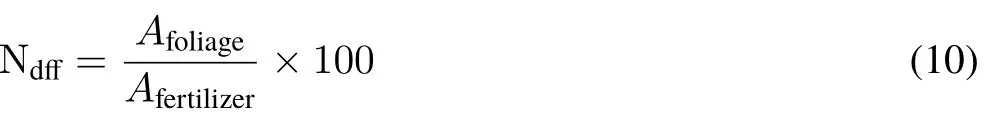
The contents of soil mineral N,NH+4,and NO−3increased rapidly during the first several days after urea application(Fig.1a,b).The increase in soil NH+4content up to 16.5±0.5 mg N kg−1for UR and 17.8±0.9 mg N kg−1for UR+NI,observed in the first 24 h of N fertilizer application,was likely due to the rapid urea hydrolysis at 60%WFPS(Martinset al.,2017).Soil NO−3content reached its maximum(20.9±5.9 mg N kg−1in UR and 22.7±1.8 mg N kg−1in UR+NI)after 5 d of fertilization.The increase in NO−3content and the simultaneous decrease in NH+4content between days 0 and 5 in treatments UR and UR + NI, indicated rapid net nitrification following urea hydrolysis.This finding was corroborated by the enrichment of the15NO−3pool derived from the15NH+4pool(Fig.1c,d)(Mathieuet al.,2006b).
Ten days after fertilizer application,soil NH+4and NO−3contents decreased quickly by more than 90%,and reached a baseline by day 28 after fertilization(Fig.1a,b).This was partially attributed to rapid plant uptake. In addition, the reduction of NH+4was due to nitrification, as mentioned earlier,and potentially to immobilization.The decrease of NO−3also reflected denitrification processes, given that leaching losses were avoided.
No significant differences were observed in soil NH+4and NO−3contents between the UR and UR+NI treatments(Fig.1a,b).A reason for the non-significant difference in NH+4accumulation could be the immobilization of soil NH+4,influenced by high soil organic matter content,which would mask any reduction in nitrification(McTaggartet al.,1997). The dilution of15NH+4derived from15N-labeled urea confirmed the NH+4production at low or natural15N abundanceviamineralization in both treatments(Table III)(Mathieuet al.,2006a).In addition,the significantly greater(P <0.05) decrease in the15NH+4pool between days 2 and 5 in pots fertilized with urea only (Fig. 1c) indicated that mineralization was contributing to the accumulation of NH+4caused by a reduction in the nitrification by nitrapyrin application.
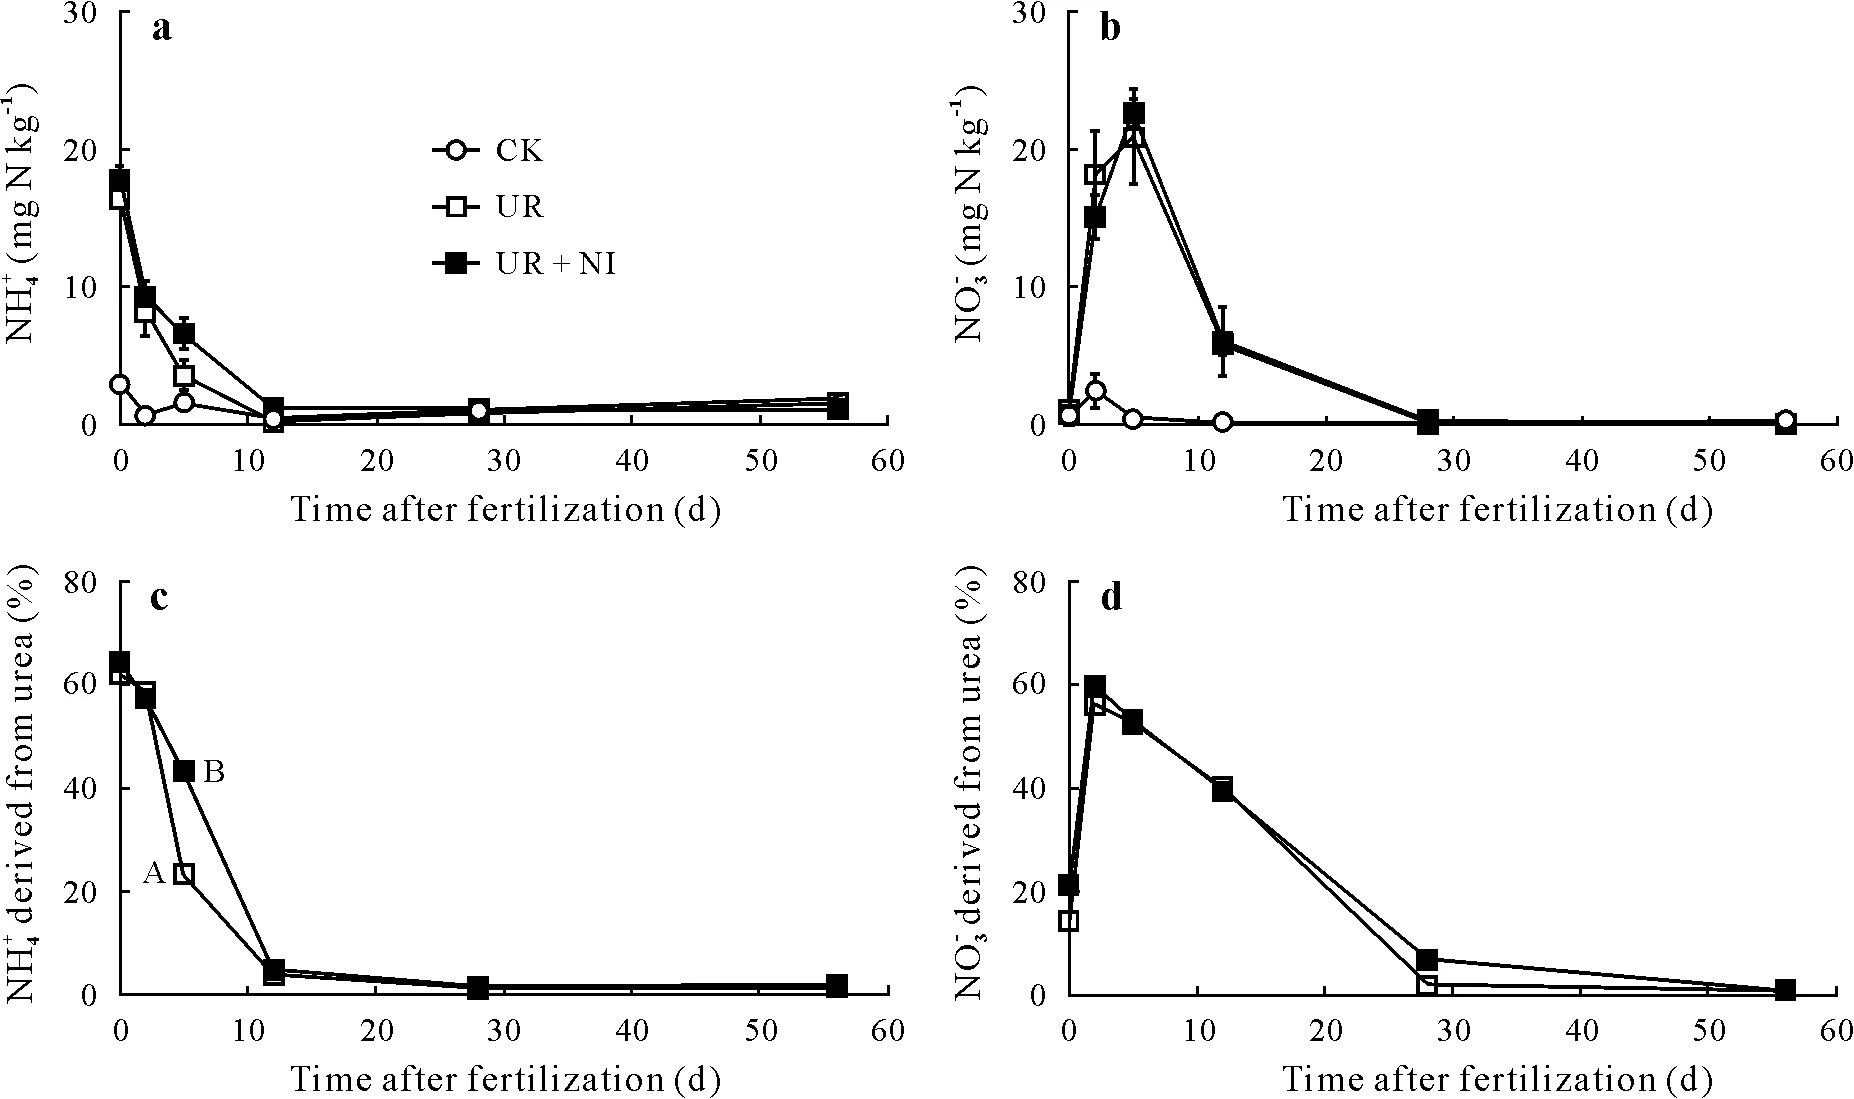
Fig.1 Soil ammonium(NH+4 )(a)and nitrate(NO−3 )(b)and the percentages of NH+4 (c)and NO−3 (d)that were derived from 15N-labeled urea in the CK,UR,and UR+NI treatments of a pot experiment conducted with an Andosol from the Alfredo Volio Mata Experimental Station of the University of Costa Rica.See Table II for treatment details.Vertical bars indicate standard errors(n=3).In subfigure c,the uppercase letters A and B beside the points at day 5 represent significant difference based on Tukey test(P =0.05).
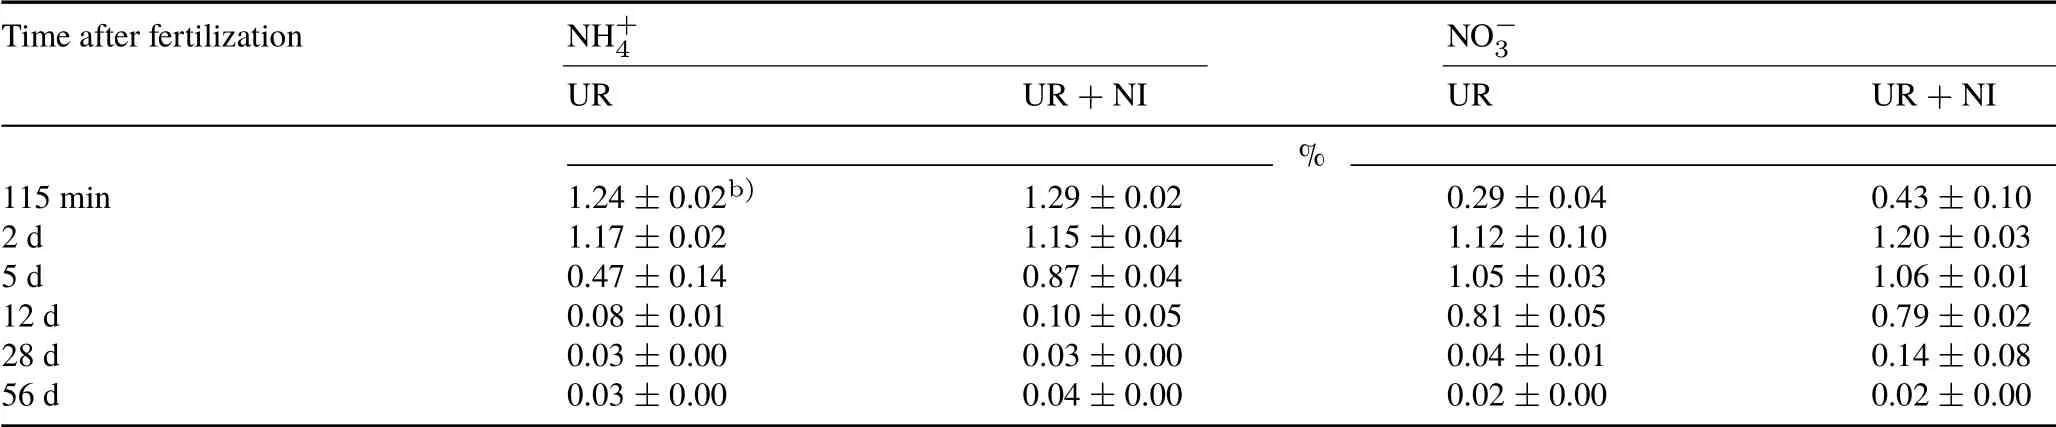
TABLE III Variation of the 15N enrichment in soil ammonium(NH+4 )and nitrate(NO−3 )in the treatmentsa) of 15N-labeled urea application(UR)and 15N-labeled urea plus nitrapyrin application(UR+NI)of a pot experiment conducted with an Andosol from the Alfredo Volio Mata Experimental Station of the University of Costa Rica
Close soil NO−3contents between UR and UR + NI were due to the additional NO−3produced by heterotrophic nitrification,a relevant mechanism in grassland soils with high organic matter content and pH below 6.5(Mülleret al.,2014;Liet al.,2015;Wanget al.,2016).This conclusion is based on: i) the soil NO−3content change, which was larger than the variation in NH+4content(Fig.1a,b),ii)the decrease of the enrichment in15NH+4(Fig.1c),likely caused by mineralization of organic matter(Mathieuet al.,2006a),and iii)the percentage of soil NO−3derived from urea,which reached only a maximum value close to 60%(Fig.1d).
Nitrapyrin application did not maintain the15NO−3pool stable from days 1 to 12 after fertilization(Table III),indicating an inflow of unlabeled or low-abundance NO−3.These results do not agree with those reported by Fisket al.(2015),who found that NI decreased gross nitrification rates in a Haplic Arenosol (organic matter 11—18 g kg−1, pH 6.2).This difference in the decline of the15N enrichment of the NO−3pool is arguably related to the different nitrification processes(autotrophicvs.heterotrophic).For example,Faeflenet al.(2016)compared the contributions of autotrophs and heterotrophs to nitrification in Oxisol(organic matter 22 g kg−1, pH 5.0) and reported that autotrophic nitrification was the main nitrification pathway.In the Andosol from grassland,the main pathway of NO−3production was possibly heterotrophic nitrification,which is not effectively inhibited by nitrapyrin.
At a low application dose of N as urea,the soil mineral N originated mostly from the fertilizer in the first several days after fertilization,with a maximum between 60%and 65%;this percentage decreased to less than 5%by around day 12.This finding suggests that the N fertilizer was quickly mineralized and extracted by the grass,which already had a well-developed root system,leading to low availability of NH+4for the action of the inhibitor.
N2O emissions
As expected,experimental pots fertilized with N exhibited N2O fluxes higher than the emissions of the control.Emissions of N2O reached their peak 2 d after fertilizer application(Fig.2a),similar to results from tropical soils with C/N ratios between 10.6 and 9.8(Martinset al.,2017;Pérez-Castilloet al., 2021). This finding was contrary to those reported by Abbasiet al.(2003)and Cuiet al.(2013)from soils with higher C/N ratios(16.2—17.3)in temperate regions,where maximum rates of N2O emissions were observed between days 14 and 28 after fertilization.The N2O emission peaks at day 2 may be due to the lower content of humic acids in the soil organic matter(lower C/N ratio).According to Donget al.(2009),high content of humic acids would suppress the growth of autotrophic ammonia-oxidizing bacteria and therefore,could delay soil nitrification.
The oxidation of accumulated organic N in high-fertility soil could contribute to N2O emissions and explains the slight increase in emissions from the control treatment,which reached the maximum flux 4 d after fertilization.Under the experimental conditions,heterotrophic denitrification was arguably favored by 60%WFPS(Aitaet al.,2015;Martinset al.,2017).Moreover,heterotrophic nitrification has proven to be an important source of N2O emissions in soils with a high content of organic matter and a slightly acidic pH in experiments carried out with fertilizers enriched with15N(Zhanget al.,2015).
It should be noted that N2O fluxes of UR and UR +NI only showed significant differences on day 0 (0.86±0.14 mg N2O-N kg−1soil d−1in URvs.0.19±0.04 mg N2O-N kg−1soil d−1in UR+NI).Fluxes of N2O from the UD pots were always higher than those from the UD+NI pots(Fig.2a),and the differences were significant on day 1(0.33±0.03 mg N2O-N kg−1soil d−1in UDvs. 0.13±0.01 mg N2O-N kg−1soil d−1in UD+NI)and day 7(4.86±1.61 mg N2O-N kg−1soil d−1in UDvs.1.94±0.86 mg N2O-N kg−1soil d−1in UD + NI). Nitrous oxide fluxes from all the treatments approached the baseline between days 16 and 20(Fig.2a).This condition mirrors mineral N depletion,as a result of N absorption by grass and N lossesviagaseous N emissions(Fig.1a,b).
Fig.2 Fluxes(a)and cumulative emissions(b)of nitrous oxide(N2O)from the treatments in a pot experiment conducted with an Andosol from the Alfredo Volio Mata Experimental Station of the University of Costa Rica.See Table II for treatment details.Vertical bars indicate standard errors(n=4).Different uppercase letters at the end of the lines in subfigure b represent significant differences based on Tukey test(P =0.05).
Mean cumulative emissions of N2O-N(Fig.2b)remained below the emission factor of 1%of N applied,established by the International Panel on Climate Change(IPCC)(2006),which is consistent with the low soil mineral N content discussed above. More than 90% of the N2O emissions occurred in the first two weeks after the application of urea-15N,when Andosol presented the highest contents of mineral N (Fig. 1a, b). In particular, the cumulative emissions of the UD pots(1.13±0.15 mg N2O-N kg−1soil)were significantly higher than those of the UD+NI pots(0.71±0.07 mg N2O-N kg−1soil)since day 2,which represented a reduction of 37% N2O emissions by the application of nitrapyrin.Therefore,the loss of N as N2O decreased from 0.9%of the N applied in UD to only 0.55%in UD+NI.This trend is consistent with the substantial decrease in N2O emissions reported by Abbasiet al. (2003) or McTaggartet al.(1997)when nitrapyrin was applied with N at doses higher than 100 mg N kg−1(above 120 kg N ha−1).
In contrast to the results presented for UD and UD+NI,the UR and UR+NI treatments did not exhibit significant differences in the cumulative N2O emissions (Fig. 2b),suggesting that the inhibitory effect of nitrapyrin on N2O emissions decreases in a tropical Andosol when the NH+4content available for nitrification is low(Van Groenigenet al.,2010).A non-significant difference between urea fertilization with and without nitrapyrin was reported in grasslands by others(Doughertyet al.,2016; Naueret al.,2018; Pérez-Castilloet al.,2021)when an equivalent dose of urea and NI was applied.In summary,an inhibitory effect of nitrapyrin was observed on N2O emissions,but its impact was minimal when the soil mineral N content was low(Fig.2b).
Nitrous oxide fluxes from UD+NI tended to be higher than those from UR or UR + NI from day 4 onwards;however, the cumulative N2O emissions did not exhibit significant differences among the treatments, suggesting that the management of nitrogenous fertilization with the application of nitrapyrin could offset the environmental impacts of N surplus in the tropical Andosol studied.
Contribution of urea to N2O flux
The isotopic15N signature of the emitted N2O was lower than that of the fertilizer(Fig.3).This suggests that part of the emitted N2O originated from unlabeled N sources such as soil organic N. This finding contrasts with the results of Abbasi and Adams (2000) that all N2O emitted in an incubation experiment(undisturbed soil with pH 5.1,total C 47.3 g kg−1,and C/N ratio 13.9,receiving 70 mg urea-N kg−1)was derived from the15N-labeled urea.Such difference is related to autotrophic and heterotrophic nitrification.In the present study,N2O emissions may come partially from the oxidation of soil organic N to NO−3through heterotrophic nitrification and the reduction of this NO−3viadenitrification in anaerobic microsites that coexist in the soil profile(Seyet al.,2008;Mülleret al.,2014;Martinset al.,2017).Moreover,the15N-enriched N2O from the labeled urea demonstrates the production of NO−3viaautotrophic nitrification(Stange and Döhling,2005).
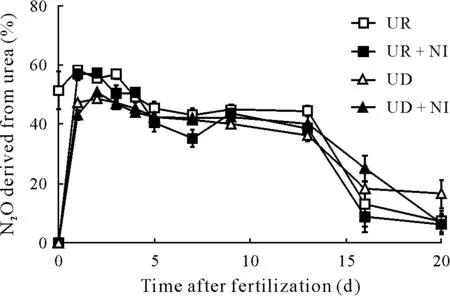
Fig.3 Percentages of the emissions of nitrous oxide(N2O)derived from 15N-labeled urea applied in the treatments of a pot experiment conducted with an Andosol from the Alfredo Volio Mata Experimental Station of the University of Costa Rica.See Table II for treatment details.Vertical bars indicate standard errors(n=4).
The N2O originated from the15N-labeled urea(Fig.3)showed the same trend as the content of soil NO−3derived from urea.Thus,during the first 5 d after fertilization,the percentages of N2O flux derived from the fertilizer were similar to those of the NO−3produced,while 20 d later,the contribution of urea-N in both N2O and NO−3was very low.One day after fertilization,urea-derived N2O from the UR and UR+NI treatments was significantly higher(P <0.05)than that from the UD+NI treatment but not significantly higher (P >0.05) than that from the UD treatment. The UD treatment, with the higher dose of urea application,produced higher percentage of N2O derived from the organic N of the soil,compared to the UR treatment.This finding could be explained by that urea-N increases soil organic N mineralization and particularly decreases the C/N ratio of the light fraction of the soil organic matter(Kuzyakovet al.,2000).
NUE
The NUE obtained forC.nlemfuensiswas low(Table IV),at around 24%at day 28(first growing cycle)and around only 9.4%in the following 28-d period,with a global average of 33%,and a maximum cumulative efficiency of 41.0%±9.7%for the UD treatment. These remarkably low values of NUE were at least partly due to the immobilization of N fertilizer by soil organic matter(78 g kg−1C),and NH3losses, considering the rapid hydrolysis of urea and its application on the surface,which are favorable factors for the production of NH3.
No significant differences were observed in NUE between the doses of urea applied,or between the uses of urea with and without nitrapyrin,although treatments containing urea alone, contrary to expectations, showed the highestNUE values.Application of nitrapyrin to the Andosol studied could increase N losses through NH3volatilization, and slightly reduce NUE in the UR+NI and UD+NI treatments(Abaloset al.,2014).
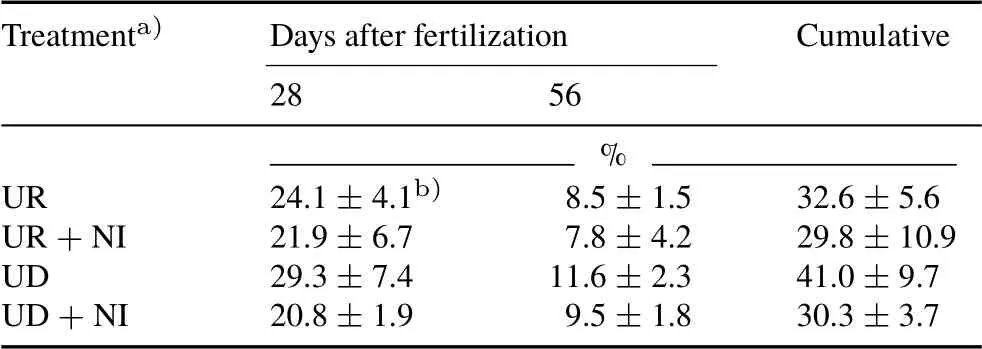
TABLE IV Nitrogen fertilizer use efficiency in the treatments of a pot experiment conducted with an Andosol from the Alfredo Volio Mata Experimental Station of the University of Costa Rica
Finally,the inhibitory effect of nitrapyrin on nitrification(especially when the dose of urea-N was doubled)did not affect the production of the forage biomass(data not shown).This was because, quantitatively, the losses of N in the form of N2O were minimal(less than 1%of the applied N)compared to the doses of N applied.
Microbial population analysis
The DGGE analysis of all soil treatments and control showed diffuse band patterns. Such arrangement can be related to diverse microbial communities with populations in relatively equivalent proportions.It was also not possible to observe differences between experimental groups because their band patterns were mostly indistinguishable from each other(Fig.S1,see Supplementary Material for Fig.S1).
Applications of urea cause changes in soil pH and osmotic potential.These changes can cause short-term alterations in the biomass and composition of the soil microbial community(Geisseler and Scow,2014).For example,in vitroand field studies where urea was applied to soil(90—120 kg N ha−1),showed evident changes in microbial community composition with decreased biomass and functional diversity in less than 10 d.However,over time(e.g.,90 d and even 3 years of continuous application),the communities would be reestablished and their composition profiles would become not distinguishable compared to those from pretreated soils(Starket al.,2007;Lupwayiet al.,2011,2012;Robertset al.,2011).Presumably,the monitoring time was too long to see this short-term effect.
CONCLUSIONS
In a tropical Andosol of high organic C and N contents and under pasture vegetation,the soil organic N mineralization and heterotrophic nitrification constitute the main processes for the formation of NH+4and NO−3.In this study,the15N technique allowed us to precisely determine the sources of N2O emissions(direct oxidation of the soil organic Nviaheterotrophic nitrification or its productionviaheterotrophic denitrification), which are critical for mitigation of N2O.Nitrapyrin would likely exert a significant mitigating effect on N2O emission,only if a substantial N surplus exists in soils with high organic matter content.Further studies are needed to study tropical soils with different organic matter contents and other NIs,in order to find efficient mitigation practices to reduce N2O emissions.
ACKNOWLEDGEMENTS
This research was supported by the International Atomic Energy Agency(IAEA),Vienna,Austria through a Coordinated Research Project(No.CRP D1.50.16)of Soil and Water Management and Crop Nutrition Section,Joint FAO/IAEA Division of Nuclear Techniques in Food and Agriculture,and by the University of Costa Rica(No.VI-802-B7-505).We thank Miss María José Moya,Mr.José Manuel Monge,and Mr.José Rolando Montiel from the Environmental Pollution Research Center(CICA)of the University of Costa Rica for their help in fieldwork.
SUPPLEMENTARY MATERIAL
Supplementary material for this article can be found in the online version.
杂志排行
Pedosphere的其它文章
- Notes to Authors
- Mitigating greenhouse gas emissions from croplands and pasturelands—climate-smart agriculture
- Effects of warming,wetting and nitrogen addition on substrate-induced respiration and temperature sensitivity of heterotrophic respiration in a temperate forest soil
- Long-term(42 years)effect of thinning on soil CO2 emission in a mixed broadleaved-Korean pine(Pinus koraiensis)forest in Northeast China
- Larger floods reduce soil CO2 efflux during the post-flooding phase in seasonally flooded forests of Western Amazonia
- Characteristics of greenhouse gas emissions from rice paddy fields in South Korea under climate change scenario RCP-8.5 using the DNDC model