Nutrient cycling and greenhouse gas emissions from soil amended with biochar-manure mixtures
2021-04-14CarlosROMEROChunliLIJenOWENSGabrielRIBEIROTimMCALLISTERErasmusOKINEandXiyingHAO
Carlos M.ROMEROChunli LIJen OWENSGabriel O.RIBEIROTim A.MCALLISTERErasmus OKINE and Xiying HAO∗
1Agriculture and Agri-Food Canada,Lethbridge Research and Development Centre,Lethbridge,Alberta T1J 4B1(Canada)
2Department of Biological Sciences,Faculty of Arts&Sciences,University of Lethbridge,Lethbridge,Alberta T1K 3M4(Canada)
3Department of Animal and Poultry Science,University of Saskatchewan,Saskatoon,Saskatchewan S7N 5A8(Canada)
ABSTRACT Integrating biochar into cattle diets has recently emerged as a potential management practice for improving on-farm productivity.Yet,information concerning the cycling of biochar-manure mixtures is scarce.A 70-d incubation experiment was conducted within two surface(0—15 cm)Mollisols with contrasting textures,i.e.,sandy clay loam(Raymond)and clayey(Lethbridge),to evaluate the effects of biochar(3 Mg ha−1)on cumulative greenhouse gas(GHG)emissions and related fertility attributes in the presence or absence of cattle manure(120 Mg ha−1).Five treatments were included:i)non-amended soil(control,CK),ii)soil amended with pinewood biochar(B),iii)soil amended with beef cattle manure(M)(manure from cattle on a control diet),iv)soil amended with biochar-manure(BM)(manure from cattle on a control diet,with pinewood biochar added at 20 g kg−1 of diet dry matter),and v)soil amended with B and M at the aforementioned rates(B+M).A total of 40 soil columns were prepared and incubated at 21 ◦C and 60%—80%water-holding capacity.On average,total CO2 fluxes increased by 2.2-and 3.8-fold under manure treatments(i.e.,M,BM,and B+M),within Raymond and Lethbridge soils,respectively,relative to CK and B.Similarly,total CH4 fluxes were the highest(P <0.05)in Raymond soil under B+M and BM relative to CK and B,and in Lethbridge soil under M and BM relative to CK and B.In Lethbridge soil,application of BM increased cumulative N2O emissions by 1.8-fold relative to CK.After 70-d incubation,amendment with BM increased(P <0.05)PO4-P and NO3-N+NH4-N availability in Raymond and Lethbridge soils compared with B.A similar pattern was observed for water-extractable organic carbon in both soils,with BM augmenting(P <0.05)the occurrence of labile carbon over CK and B.It can be concluded that biochar,manure,and/or biochar-manure have contrasting short-term effects on the biogeochemistry of Mollisols.At relatively low application rates,biochar does not necessarily counterbalance manure-derived inputs.Although BM did not mitigate the flux of GHGs over M,biochar-manure has the potential to recycle soil nutrients in semiarid drylands.
Key Words: animal husbandry,black carbon,carbon dioxide,methane,Orthic Black Chernozem,soil fertility
INTRODUCTION
The Canadian prairie,a massive semiarid steppe landscape covering about 55 M ha of western Canada,contains a vast reservoir of carbon (C) and associated soil nutrients (Janzenet al., 1998; Wanget al., 2014). However,the size of this organic pool has dramatically decreased in response to altered land use(Thomaset al., 2017a; Anet al.,2019),cattle grazing(Thomaset al.,2018;Zhanget al.,2018a,b),and cropland management(Haoet al.,2001).At present,inorganic fertilizers(e.g.,urea-N)are being intensively employed to meet the rising demand of both dryland(>75 kg N ha−1)and irrigated(>150 kg N ha−1)cereal crop production(Bereset al.,2018).Similarly,animal waste by-products(e.g.,manure and compost)are surface-applied as alternative,cost-effective NPK fertilizer sources(Thomaset al.,2017b)in areas with densely populated livestock,e.g.,southern Alberta,Canada(Larney and Hao,2007).
Manure can be applied to improve soil physical, chemical,and biological properties(Haoet al.,2003;Lupwayiet al.,2014).However,the turnover rate of organic matter(OM)within manure is rapid.Negative environmental impacts,such as increased greenhouse gas(GHG)emissions,are frequently observed following the broadcast application of manure in semiarid regions.For example,Thomas and Hao(2017)reported that cattle manure increased N2O emissions by 60%compared with a non-amended rainfed Mollisol cropped with barley (Hordeum vulgareL.) near Lethbridge, Alberta. Fast catabolism of manure OM can foster CO2,CH4,and N2O emissions(Zhanget al.,2017)and soil nutrient mineralization (i.e., positive priming effect)(Fanget al.,2015).It is therefore desirable to develop management strategies to mitigate the loss of nutrients from manure-treated croplands.
Biochar is a pyrolyzed (thermally decomposed) form of black C that has been promoted as a promising soil additive within environmental quality frameworks(Lehmanet al., 2011; Gulet al., 2015). Biochar is biochemically recalcitrant(Zimmerman,2010),with its reactive,porous surface favoring the sorption of organic molecules within the soil matrix(Lehmannet al.,2011;Josephet al.,2015).Biochar may also improve soil pH (Glaseret al., 2002;Smebyeet al.,2016)and soil nutrient retention(Lairdet al.,2010;Ippolitoet al.,2012;Lentz and Ippolito,2012)when applied at 10—60 Mg ha−1.However,the use of biochar at such rates is impractical in extensive,large-scale agricultural settings due to its limited availability,powdery nature,and associated high cost(e.g.,1 500 and 2 150 US$t−1in the USA and Canada,respectively)(Jirka and Tomlinson,2015).Alternatives to enhance biochar efficacy include low-demand application approaches,such as the use of biochar as a bulking agent for manure composting,a composite within manure mixtures,and an additive to animal diets(Kammannet al.,2017;Saleemet al.,2018;El-Naggaret al.,2019).
The occurrence of biochar within manure mixtures is a key driver of soil biogeochemistry in semiarid drylands and is frequently positively correlated with bulk soil C,labile OM pools,and soil microbial/enzyme activity(El-Naggaret al.,2015;Elzobairet al.,2016).Ippolitoet al.(2016)concluded that the co-application of dairy cattle manure and hardwood biochar increased metal extractability(e.g.,Zn)and soil water status(0—30 cm)in a calcareous silt-loam soil of southern Idaho,USA.At the same location,Lentzet al.(2014)found that biochar-manure combined applications maximized manure net N mineralization and overcame reductions in corn(Zea maysL.)yield associated with biochar-only amendment.In Saudi Arabia,El-Naggaret al.(2015)reported increased N,P,and K nutrient availability and reduced cumulative CO2emission rates from a calcareous sandy soil treated with a mixture of woody waste biochar and poultry manure.
Integrating biochar with animal husbandry through dietary manipulation is a potential management practice for improving soil quality and on-farm productivity.Saleemet al.(2018)reported that addition of pinewood(Pinusspp.)biochar to a forage diet(up to 2%of diet dry matter)improvedin vitroruminal fermentation and microbial protein synthesis.Addition of pinewood biochar was also found to reduce overall enteric CH4production in an artificial rumen system(Saleemet al.,2018).Josephet al.(2015)concluded that feeding cows a mixture of molasses(0.10 kg d−1)and jarrah wood(Eucalyptus marginata)biochar(0.33 kg d−1)increased soil nutrient availability and OM sequestration(0—40 cm)in a manure-amended Australian Chromosol.A potential economic benefit of this practice was also discussed by the authors.However,to our knowledge,no reports have been published on the effect of biochar additionviaanimal feed applications from arable soils in North America.
The objective of this study was to broaden our understanding of the factors governing GHG (i.e., N2O, CO2, and CH4)emissions and soil nutrient(i.e.,inorganic N and P)availability within two surface(0—15 cm)biochar-manuretreated Mollisols with contrasting textures.Specifically,under controlled conditions,we aimed to determine:i)the influence of pinewood biochar on beef cattle manure nutrient cycling and ii)the potential of feeding pinewood biochar to cows for improving soil fertility in southern Alberta,Canada.We hypothesized that dietary addition of pinewood biochar to cattle manure would temporarily decrease GHG emissions and soil nutrient availability due to its recalcitrance to decomposition.
MATERIALS AND METHODS
Characterization of soils and amendments
Soil samples were collected from two long-term cropping field sites in southern Alberta, Canada. The study sites were near Raymond, Warner County (49◦31′12′′N,112◦42′27′′W,elevation 932 m above sea level)and Lethbridge,Lethbridge County(49◦38′00′′N,112◦48′00′′W,elevation 929 m above sea level). The Raymond soil is a Mollisol-type, classified as a sandy clay loam Ustic Haplocryoll(USDA Soil Taxonomy)or Orthic Dark Brown Chernozem(Kessler series,Agriculture and Agri-Food Canada(AAFC)Soil Classification).The dominant soil at Lethbridge is a Mollisol-type,classified as a clayey Ustic Haplocryoll(USDA Soil Taxonomy)or Orthic Dark Brown Chernozem(Lethbridge series, AAFC Soil Classification). Both soils are deep and well-drained, and derived from calcareous glaciofluvial(Raymond)or glaciolacustrine(Lethbridge)deposits(CanSIS,2013).The particle size distribution,based on Gee and Bauder(1986),was 60.1%sand,7.6%silt,and 32.3%clay for the Raymond soil and 28.1%sand,25.4%silt,and 46.5%clay for the Lethbridge soil.
Composite samples were collected from the top mineral layer(0—15 cm)using a hand shovel,sealed in tubs and transported to the laboratory where they were air-dried for 1 week at 22◦C.Visible plant litter and root fragments were removed before samples were coarsely ground to pass through a 2-mm sieve.Subsamples of sieved soil(<2 mm)were then finely ground to pass through a 0.15-mm mesh for total C(TC),total nitrogen(TN),and total phosphorus(TP)determination.Initial soil pH and electrical conductivity(EC)were determined using a 2:1(water:soil,volume:weight)slurry.Soil inorganic nitrogen(NH4-N+NO3-N)was determined by extracting 5 g of soil with 25 mL of 2 mol L−1KCl and quantified by the modified indophenol blue technique(Simset al.,1995)using a microplate spectrophotometer at 650 nm(Multiskan GO,Thermo Fisher Scientific,Waltham,USA).Soil inorganic phosphorus(PO4-P)was determined by extracting 2.5 g of soil with 25 mL of 0.5 mol L−1NaHCO3(Olsenet al.,1954).Concentrations were quantified by colorimetry using a discrete analyzer(EasyChem Pro, Systea Analytical Technology, Anagni, Italy). Finely ground samples were used to determine TC and TN by dry combustion using a CN analyzer(NC2100,Carlo Erba Instruments,Milan,Italy).Total P was determined by digesting finely ground samples with 18 mol L−1H2SO4(Parkinson and Allen,1975).Solutions(digestate)were quantified by colorimetry with a discrete analyzer.
Biochar was supplied by Cool Planet Energy Systems,Inc.,Greenwood Village,USA,which markets biochar products under the brand names CoolTerra®and CoolFauna®.The biochar provided was derived from pinewood and created using the company’s proprietary Engineered BiocarbonTMtechnology, which includes a front-end biomass pyrolysis(<650◦C) and a patented post-pyrolysis treatment step.The biochar had an ash content of 17 g kg−1as determined by standard ASTM 1762 methodology.It was characterized by a surface area of 152 m2g−1(ASTM D6556) and a bulk density of 122 kg m−3(dry mass basis) (InnoTech Alberta,Vegreville,Canada).Biochar contained 254 g kg−1volatile matter (dry mass basis), with an overall biochar hydrogen:carbon ratio of 0.28.The latter indicates a highly stable biochar with significant C sequestration potential(Enderset al., 2012). Biochar (3 g) was added to a 50-mL Erlenmeyer flask with 30 mL of Milli-Q®ultrapure water(≤18.2 MΩ cm−1),mixed(30 min at 180 r min−1),and then allowed to settle for 60 min at room temperature.Biochar pH and EC were determined using a 10:1 (water:biochar,volume:weight)slurry.Filtered biochar extracts were analyzed to determine water-extractable NH4-N,NO3-N,and PO4-P concentrations by colorimetry.Finely ground biochar samples(<0.15 mm)were used to determine TC,TN,and TP concentrations.
Solid manure was retrieved from beef cattle housed in a tie-stall barn(four heifers per diet)at the Agriculture and Agri-Food Canada Lethbridge Research and Development Centre(AAFC-LeRDC).The material contained an average water content of 770—790 g kg−1.Two types of manure were employed in this study:i)manure from beef cattle on a control diet(e.g.,600 g kg−1barley silage,350 g kg−1barley grain,and 50 g kg−1standard supplement on a dry matter(DM)basis),and ii)manure from beef cattle on a control diet with addition of pinewood biochar(e.g.,600 g kg−1barley silage,330 g kg−1barley grain,50 g kg−1standard supplement,and 20 g kg−1pinewood biochar on a DM basis).Manure was sampled after 2-week diet adaptation.Heifers were handled following the guidelines of the Canadian Council on Animal Care(CCAC,2009),and the protocols had been previously reviewed and approved by the AAFC-LeRDC Animal Care Committee.Manure TC,TN,TP,NO3-N+NH4-N,PO4-P,pH, and EC were determined as previously described for biochar.Selected chemical properties of soil,biochar,and manure are presented in Table I.
Scanning electron microscopy
The surface morphology of raw (fresh) and cattledigested pinewood biochar was visualized using an S-3400 N scanning electron microscope(SEM)(Hitachi Science Systems,Hitachinaka,Japan)operated at 5.0 kV.Before SEM imaging,biochar particles were coated with gold to improve sample conductivity.Cattle-digested biochar was separated from manure by forceps. The mixture was suspended in Milli-Q®ultrapure water at a water:manure ratio of 10:1(volume:weight) and shaken slightly to remove adhering manure particles.The recovered biochar was then rinsed and dried at 40◦C for 24 h.
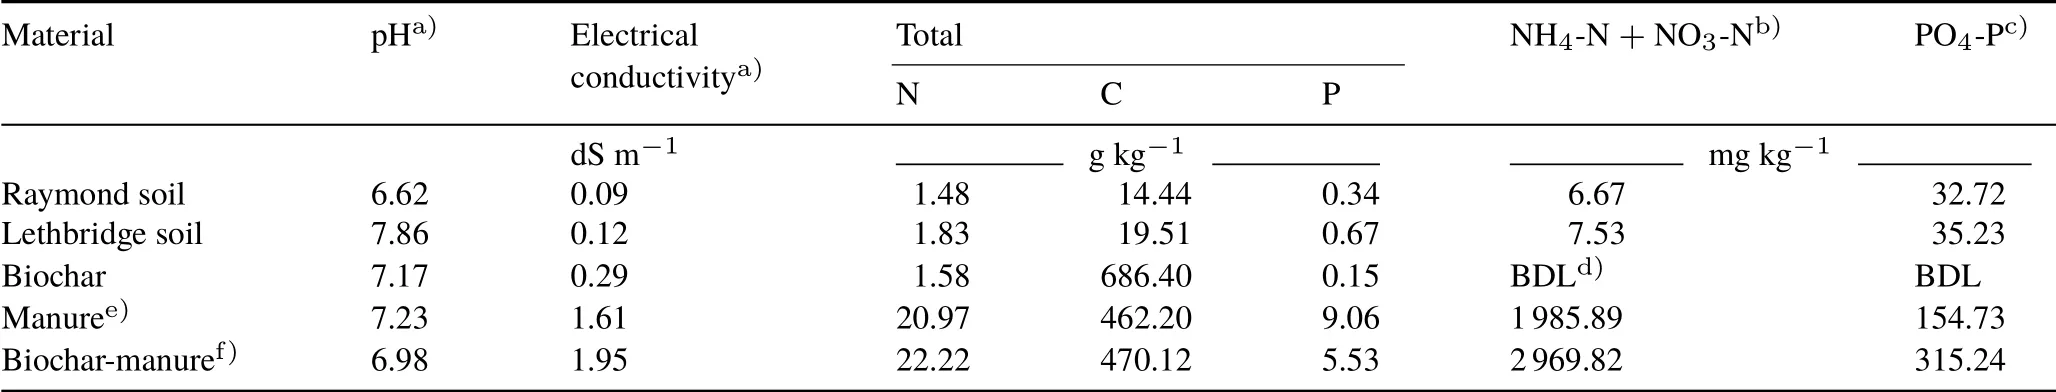
TABLE I Selected chemical properties of surface(0—15 cm)Mollisols with sandy clay loam(Raymond)and clayey textures(Lethbridge)and biochar,manure,and biochar-manure amendments
Incubation experiment
A 70-d incubation experiment was conducted to investigate the effects of biochar, manure, and biochar-manure mixtures on cumulative GHG emissions and soil nutrient availability. The experimental design was a randomized complete block with four replicates. Biochar was applied and thoroughly mixed with soil by hand at a rate of 3 mg g−1dry weight(DW)(3 Mg ha−1equivalent),considering a soil depth of 10 cm and a bulk density of 1.0 g cm−3.The manure was then mixed separately or in combination with biochar (control diet only) at a rate of 120 mg g−1fresh weight (120 Mg ha−1equivalent). A non-amended soil was employed as a control(i.e.,no biochar or manure application).This resulted in the following five treatments:i) non-amended soil (control, CK), ii) soil amended with pinewood biochar (B), iii) soil amended with beef cattle manure(M)(manure from cattle on a control diet),iv)soil amended with biochar-manure(BM)(manure from cattle on a control diet,with pinewood biochar added at 20 g kg−1of diet DM), and v) soil amended with B and M at the aforementioned rates(B+M).
Replicate soil columns(n=4)were constructed using 60-mL syringes following the protocol outlined by Campbellet al.(1993).The syringes were sealed at the bottom with a Whatman glass microfiber filter(Grade GF/A,1.6µm)and capped to prevent water from draining.Treated soil samples(30 g DW equivalent) were mixed with laboratory-grade BDH®Ottawa sand(30 g DW equivalent)(VWR Analytical,Radnor,USA)and packed into the columns to attain a bulk density of about 1.2 Mg m−3.A glass-wool pad was placed over the contents of each column to prevent soil dispersion during the addition of water.Milli-Q®ultrapure water was added to each soil mixture to bring it to 60%water-holding capacity(WHC),pre-determined for each treatment.The tops of the columns were covered with perforated Parafilm®M to encourage aeration.The WHC was maintained at 60%by adding Milli-Q®ultrapure water about once per week during the first 30 d of the experiment and then increased to 80%until the end of the incubation period.When not sampled,soil columns were maintained at 21◦C.As a reference,soil columns(n=4)were packed with 60 g of Ottawa sand and held at equivalent soil moisture levels.
Gas sampling and analysis
Soil columns were retrieved for CO2, N2O, and CH4measurements for a total of 17 sampling events(0,1,3,7,9, 15, 17, 21, 28, 30, 32, 35, 42, 49, 56, 64, and 70 d).For gas sampling,the Parafilm®M cover was removed and the soil columns were sealed in 1-L mason jars with lids equipped with a rubber septum.Gas samples(10 mL)were taken immediately after capping from the jars,with reference soil columns(Ottawa sand)representing the initial gas concentration at time zero,and after 2 h of incubation for each treatment.Gas collection was blocked by replication such that all units in replicate 1 were completed first,followed by replicates 2—4.Gas samples were then immediately injected into pre-evacuated 5.8-mL vials.Samples were analyzed for CO2,N2O,and CH4concentrations using a Varian 3800 gas chromatograph(Varian Instruments,Walnut Creek,USA)equipped with thermal conductivity,flame ionization,and electron capture detectors (TCD, FID, and ECD, respectively).The injector and column temperatures were kept at 55◦C.The carrier was P10 gas(10%methane and balance argon)for ECD and helium for TCD and FID.The channel was maintained at a static pressure of 150 kPa.
Gas concentrations were used to calculate fluxes (expressed as mg CO2-C,N2O-N,and CH4-C kg−1soil h−1)using the linear slope of gas concentrations between time 0 and 2 h,soil dry mass in the column(excluding the Ottawa sand),the volume of the jar head space(adjusted for the soil column),standard atmospheric pressure,incubation temperature, and the ideal gas law. All measured fluxes were extrapolated to daily averages.Cumulative GHG emissions over the entire 70-d incubation period were calculated by linearly interpolating between measurements and summing daily fluxes to acquire an estimate of total emissions,expressed as mg CO2-C,N2O-N,and CH4-C kg−1soil.
Soil and leachate analyses
Soil columns were retrieved on 7 and 14 d of incubation for water-extractable PO4-P(available P,AP)and NH4-N+NO3-N(available N,AN)analyses.Leachates were obtained by adding 40 mL of 0.01 mol L−1CaCl2in four 10-mL increments.Immediately after leaching,the bottom of each syringe was recapped and the top of each column was covered with perforated Parafilm®M.Additionally,final soil samples(on 70 d)were extracted with Milli-Q®ultrapure water at a water:soil ratio of 2:1(volume:weight).Extracts collected on each sampling day were immediately stored at−19◦C and analyzed within 1 week for water-extractable PO4-P and NH4-N+NO3-N.Soil AP and AN(mg kg−1)were indexed as follows:
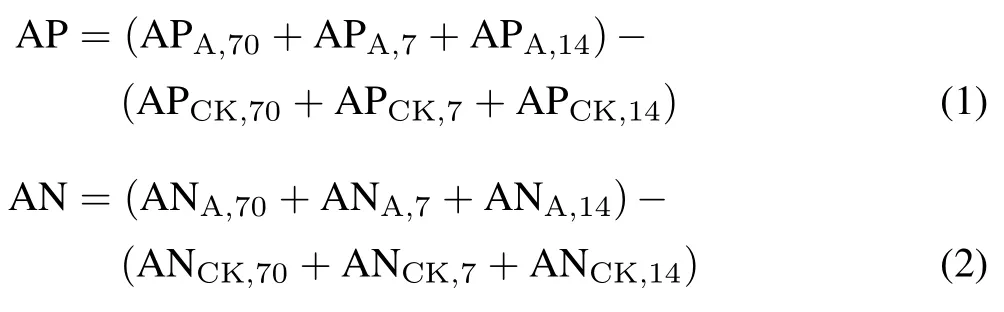
where A represents the amended(i.e.,B,M,B+M,and BM)soil and the subscript numbers reprensent the sampling time.Although we acknowledge the fact that employing 0.01 mol L−1CaCl2over water may underestimate AP concentrations(Self-Daviset al.,2000),the addition of a diluted salt solution was a necessary step to ensure water percolation through the Mollisols columns(Liet al.,2016).
Final soil samples(on 70 d)were analyzed to determine pH,EC,TN,TC,and TP as previously described for initial soil measurements.No carbonates were detected upon soil treatments with 6 mol L−1HCl (Ellert and Rock, 2008);subsequently,TC was considered a surrogate of soil organic C(SOC).Additionally,water-extractable organic C(WEOC)(mg kg−1)and water-extractable N(WEN)(mg kg−1)were quantified in 15 mL syringe-filtered(<0.45µm)aliquots using a TC (TOC-VCSH) and TN (TNM-1) combustion analyzer(Shimadzu,Kyoto,Japan)as described by Chantignyet al.(1999).
Statistical analysis
Comparisons among soil treatments(CK,B,M,B+M,and BM)were carried out for cumulative CO2, N2O,and CH4emissions,soil nutrient availability(i.e.,inorganic P and N), and WEOC and WEN pools (after 70 d) within Raymond and Lethbridge soils using analysis of variance(ANOVA)procedures,with soil treatment(amendment)as the main factor and replicate(block)as a fixed variable.The assumptions of normal distribution and equal variance were tested using a modified Shapiro-Wilk statistic(Rahman and Govindarajulu,1997)and Levene’s test,respectively.Mean effects were separated using Fisher’s protected least significant difference atP <0.05.The distribution of CH4fluxes lacked normality,and hence a non-parametric test(Kruskal-Wallis) was performed atP <0.05 (Conover, 1999). All analyses were conducted using InfoStat V2017 statistical package(Di Rienzoet al.,2013).All figures were developed with SigmaPlot version 13.0 (Systat Software, San Jose,USA).
RESULTS AND DISCUSSION
Scanning electron microscopy
Scanning electron microscopy images revealed that the surface of the raw biochar was rough and porous(Fig.1)and mainly comprised of cracked,wood-derived coarse needleshaped particles with large-sized macro pores(>10µm).Furthermore,it was observed that the biochar separated from the cattle manure was partially covered by an outer coating of organo-mineral phases(Fig.1).This layer was presumably enriched by macronutrients and trace elements,as previously reported by Josephet al.(2015)for animal-digested biochar.
Soil chemical properties
Application of M increased Raymond TN and TP by 1.42-and 1.54-fold,respectively,compared to CK(Table II).Similarly,BM addition increased Raymond TN,SOC,and TP by 1.47-,1.91-,and 1.66-fold,respectively,compared to CK.Adding biochar alone or in combination with manure to Raymond soil had no influence(P >0.05)on pH(7.28—7.54) and EC (0.23—0.36 dS m−1) estimates (Table II).In Lethbridge soil, TN and SOC were increased by 1.28-(M) and 1.49-fold (B+M), respectively, compared to CK(Table II).The manure treatments(i.e.,M,BM,and B+M)increased(P <0.001)Lethbridge EC relative to CK and B.Adding biochar alone or in combination with manure to Lethbridge soil had no influence(P >0.05)on pH(7.55—7.83)and TP(0.59—0.65 g kg−1)estimates.The application of biochar alone to Raymond or Lethbridge soils did not significantly alter pH,EC,TN,SOC,or TP relative to CK.
Three factors might explain the lack of short-term responses upon biochar amendment, namely: i) insufficient black C or pyrogenic OM substrate imposed by our relatively low application rate(equivalent to 3 Mg ha−1),ii)insufficient biochar-soil exposure time imposed by our 70-d laboratory incubation, and iii) the proximate/elemental composition of biochar.Changes in soil chemical properties in response to biochar have been reported(Gulet al.,2015;El-Naggaret al.,2019),frequently based on greater application rates,ranging from 20 to 200 Mg ha−1(Ippolitoet al.,2016),and longer time scales (>1 year) (Zimmermanet al., 2011).The chemically-inert character of biochar within the studied Mollisols could also potentially arise from its neutral pH(7.17)and low ash content(17 g kg−1)(UC Davis Biochar Database,2015).Pokharelet al.(2018),using an incubated Orthic Black Chernozem from north-central Alberta,reported higher biochar-induced responses on soil labile C and N pools after feedstocks(pine sawdust)were pyrolyzed at 550◦C(BC550)and further steam-activated at 5 mL min−1for 45 min(BC550-S),rather than torrified at 300◦C(BC300).BC550 and BC550-S were characterized by greater ash content(54—64 g kg−1)and basic properties(pH 7.50—8.20)than BC300(ash 27 g kg−1,pH 4.92).This ultimately augmented the potential of biochar to influence soil nutrient cycling and mitigate GHG emissions in a grassland ecosystem(Pokharelet al.,2018).Mollisols,of slightly-alkaline calcareous nature,are expected to be minimally affected by biochar owing to their high activity clays and strong buffering potential(Brady and Weil,2002).Similar to our findings,Mechleret al.(2018)also found no significant changes in soil pH,SOC,and TN upon addition of a mix of pine and spruce(Piceaspp.)wood biochar(3 Mg ha−1)to a Grey Brown Luvisol(pH 7.2)in southern Ontario.
Water-extractable organic C and N and C:N ratio
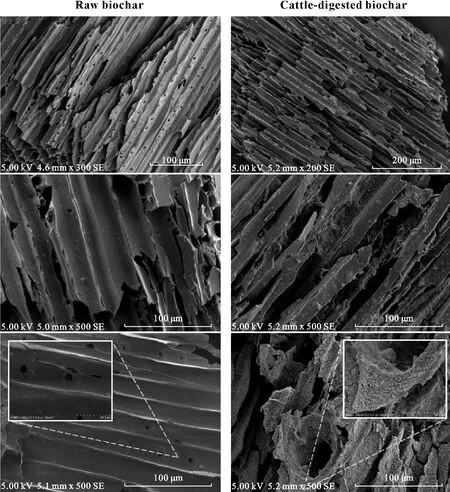
Fig.1 Scanning electron microscopy images of raw pinewood biochar and cattle-digested biochar applied to surface(0—15 cm)Mollisols.Note the presence of a bacterial biofilm on the surface of biochar that has passed through the intestinal tract of cattle.
After 70 d,Raymond BM(158.43 mg kg−1)contained more(P=0.033)WEOC than CK(42.27 mg kg−1)and B (48.42 mg kg−1) (Fig. 2a). The concentration of WEN in Raymond(4.59—46.62 mg kg−1)was also affected(P=0.015)by biochar-manure with BM ≥B+M ≥M=CK=B (Fig. 2a). After 70 d, Lethbridge BM (94.45 mg kg−1)and B+M (94.20 mg kg−1) contained more (P= 0.022)WEOC than B(48.88 mg kg−1)and CK(56.26 mg kg−1)(Fig.2b).The concentration of WEN in Lethbridge(7.27—26.89 mg kg−1)was unaffected(P=0.080)by soil treatment(Fig. 2b). Changes in OM supply may explain the effects of BM and B+M on WEOC and WEN concentrations.It is well known that a wide array of manure components(carbohydrates,polysaccharides,aromatic C,etc.)with diverse chemical nature(Milleret al.,2018)increase both WEOC and WEN fractions(Chantigny,2003;Liet al.,2019).Similarly,biochar-manure mixtures may further increase the pool size of WEOC and WEN by enhancing OM accumulation in surface soil layers.Amin(2018)found that dry corn stalk biochar co-applied with farmyard and/or poultry manure significantly increased OM contents over CK in a calcareous sandy soil(0—20 cm)cropped with barley.In our study,reduced WEOC and WEN concentrations within B may arise from the sorption of dissolved OM onto the reactive,porous surface of biochar(Ahmadet al.,2014).Alternatively,the absence of significant changes in pH (towards alkalinity)upon B addition(Table II)may have limited dissolved OM release from Raymond and Lethbridge soil matrices.Smebyeet al.(2016)demonstrated that mixing biochar with an acidic Acrisol sharply increased soil pH from 4.9 to 8.7,resulting in a 15-fold increase of WEOC pools(from 4.5 to 69 mg L−1).Those authors concluded that alkaline-induced shifts towards negatively charged sites triggered dissolved OM desorption and solubility from soil mineral phases.In our study,the latter mechanism(i.e.,the absence of significant changes in pH)was likely prevalent since the former(i.e.,biochar sorptionof OM)should have induced significant reductions in WEOC and WEN within B relative to CK.Overall,our results are consistent with laboratory findings by El-Naggaret al.(2015)in a calcareous sandy soil,where K2SO4-extractable C was higher in poultry manure-treated soil(29.5—60.2 mg kg−1)than in woody waste biochar-treated soil (23.2—40.8 mg kg−1).
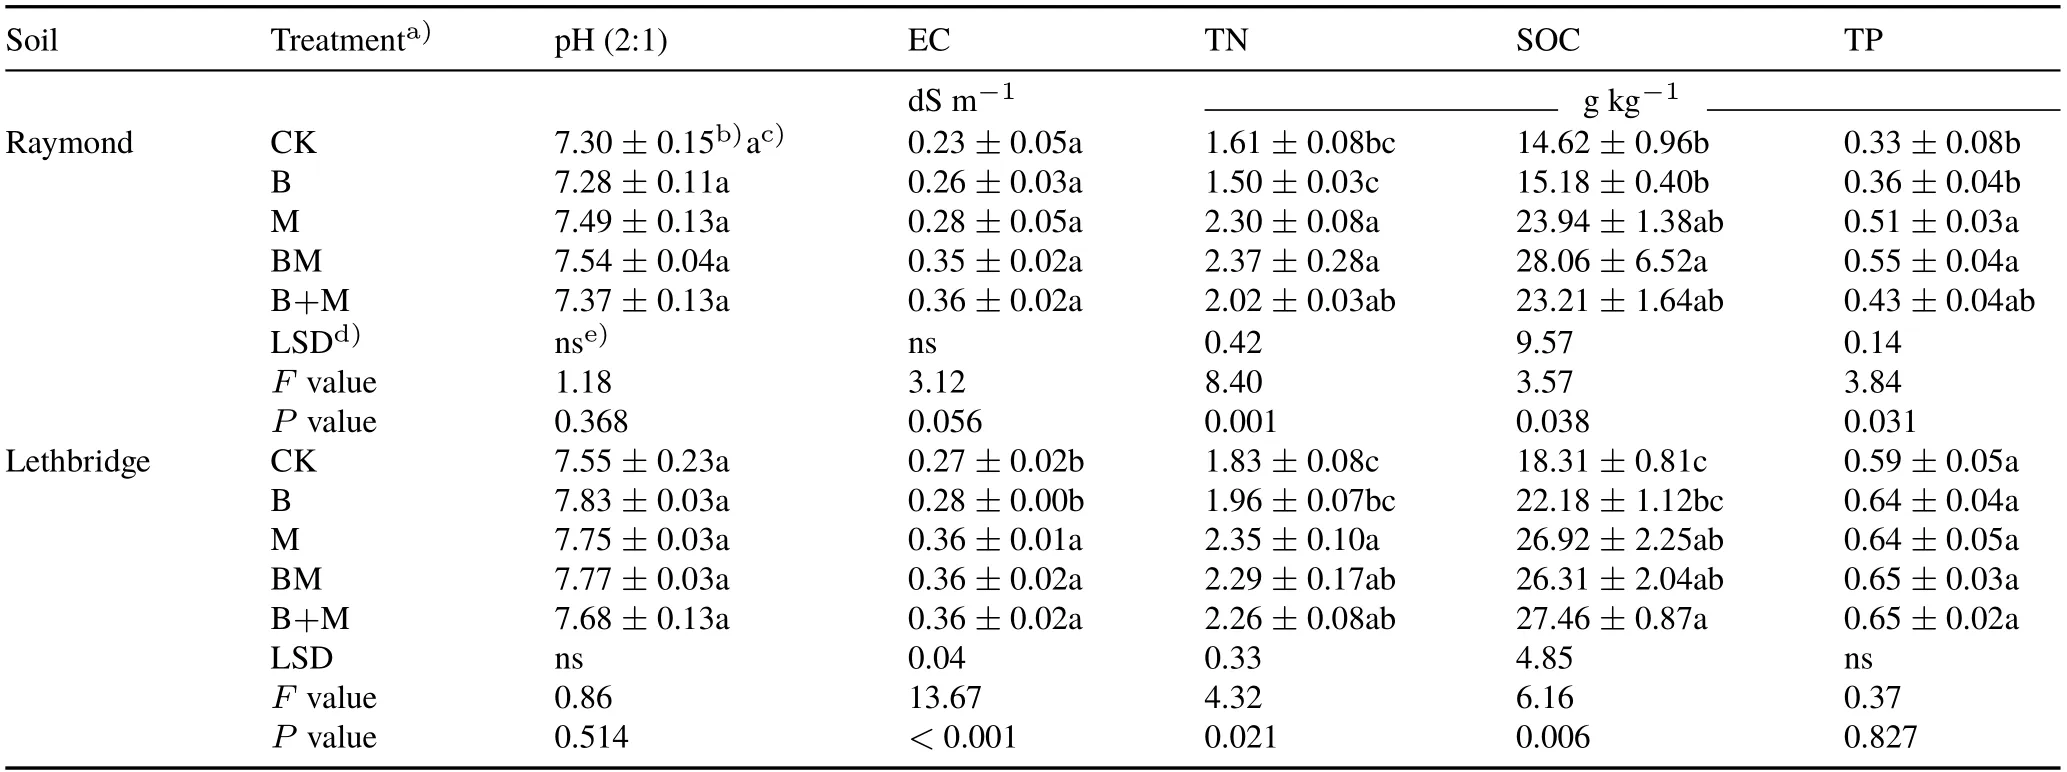
TABLE II Soil pH,electrical conductivity(EC),total N(TN),soil organic C(SOC),and total P(TP)in surface(0—15 cm)Mollisols with sandy clay loam(Raymond)and clayey(Lethbridge)textures after 70-d incubation under five treatments

Fig.2 Water-extractable organic C(WEOC),water-extractable N(WEN),and water-extractable C:N ratio in surface(0—15 cm)Mollisols with sandy clay loam(Raymond)(a)and clayey(Lethbridge)textures(b)after 70-d incubation under five treatments,with the results of analysis of variance shown in Table III.Vertical bars represent standard errors of the means(n=4).Bars with the same letter(s)are not significantly different at P <0.05.See Table II for the detailed descriptions of the abbreviations for treatments CK,B,M,BM,and B+M.
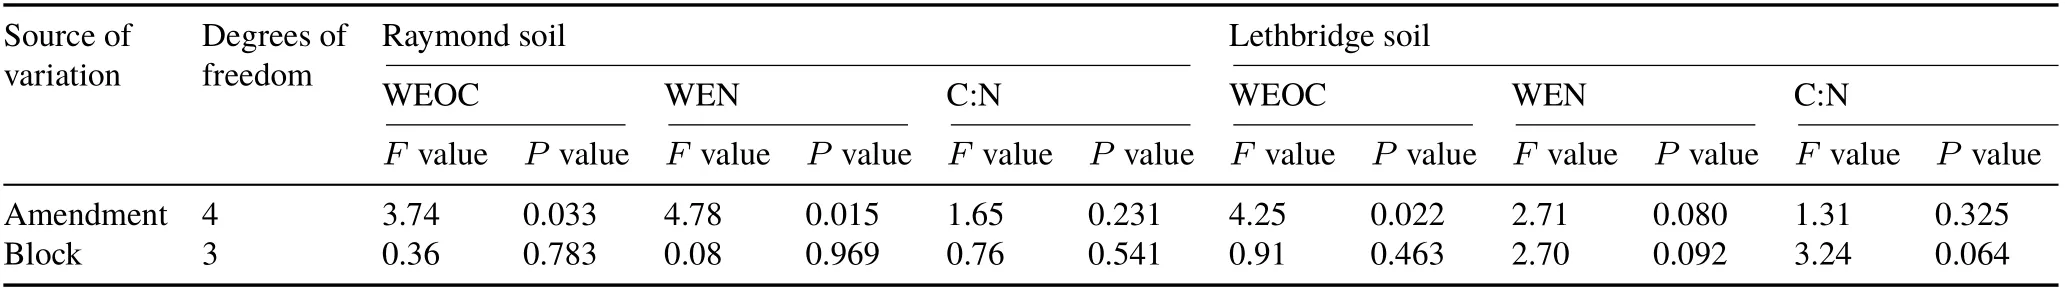
TABLE III Analysis of variance for water-extractable organic C(WEOC),water-extractable N(WEN),and water-extractable C:N ratio in surface(0—15 cm)Mollisols with sandy clay loam(Raymond)and clayey(Lethbridge)textures
The distribution of water-extractable C:N ratio was not affected(P >0.05)by soil amendment,and varied between 3.5 and 14.4(Fig.2a,b).The addition of manure and biocharmanure, which possessed considerably higher C:N ratios(22.0)than Raymond and Lethbridge soils(9.7—10.6),did not result in a definite change in water-extractable C:N ratio among treatments,implying OM at varying decomposition stages(Martinset al.,2011;Romeroet al.,2017)but with no clear pattern.This is consistent with previous findings by Solomonet al.(2000)and Mandalet al.(2007),who reported that water-extractable C:N ratio should not be considered a sensitive metric of soil quality in manure-amended fields,as the incorporated pool of labile C seldom alters the refractory portion of OM(Gerzabeket al.,1997).
Carbon dioxide emissions
Both Raymond and Lethbridge soils exhibited similar trends in CO2fluxes(Fig.3a, b). Initially, CO2fluxes increased with time,irrespective of the amendment,and then sharply decreased around 10 d.Then,CO2fluxes for CK and B remained almost stable until the end of the study,while two distinct CO2flux peaks were observed for M,B+M,and BM around 15—30 and 65 d(Fig.3a,b).Cumulative CO2emissions in Raymond and Lethbridge soils were affected(bothP <0.001)by soil treatment(Fig.4a,b,Table IV).In Raymond soil,mean cumulative CO2emissions ranged from 3 688 to 9 248 mg CO2-C kg−1soil and were increased,on average, by 2.2-fold with M, B+M, and BM applications relative to CK and B (Fig. 4a). In Lethbridge soil, mean cumulative CO2emissions ranged from 1 952 to 8 954 mg CO2-C kg−1soil,and were the highest under B+M,followed by M and BM,with all exhibiting greater(P <0.001)CO2emissions relative to CK and B(Fig.4b).Manure-amended soils(M,BM,and B+M)had higher(P <0.001)cumulative CO2emissions than those not receiving manure(CK and B).This can be attributed to manure-derived labile C constituents(i.e.,WEOC)exhibiting little resistance against biological degradation and decay(Chantignyet al.,2001;Chantigny,2003). Manure additions have been shown to foster soil microbial activity and concomitant CO2emissions(Collinset al.,2011).
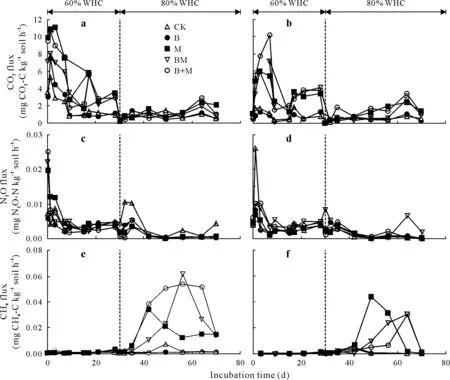
Fig.3 Dynamics of CO2,N2O,and CH4 fluxes in surface(0—15 cm)Mollisols with sandy clay loam(Raymond)(a,c,and e)and clayey(Lethbridge)textures(b,d,and f)under five treatments.Arrows depict aerobic(60%)and anaerobic(80%)incubation phases based on soil water-holding capacity(WHC).See Table II for the detailed descriptions of the abbreviations for treatments CK,B,M,BM,and B+M.
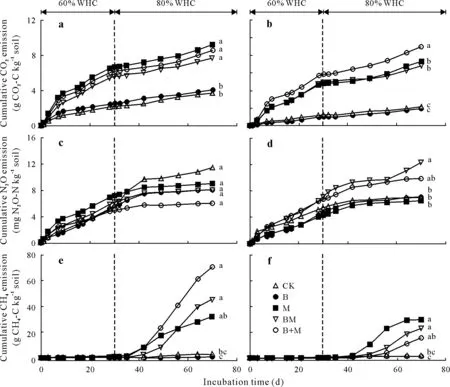
Fig.4 Cumulative CO2,N2O,and CH4 emissions in surface(0—15 cm)Mollisols with sandy clay loam(Raymond)(a,c,and e)and clayey(Lethbridge)textures(b,d,and f)under five treatments.Values with the same letter(s)are not significantly different at P <0.05 after 70-d incubation.Arrows depict aerobic (60%) and anaerobic (80%) incubation phases based on soil water-holding capacity (WHC). See Table II for the detailed descriptions of the abbreviations for treatments CK,B,M,BM,and B+M.
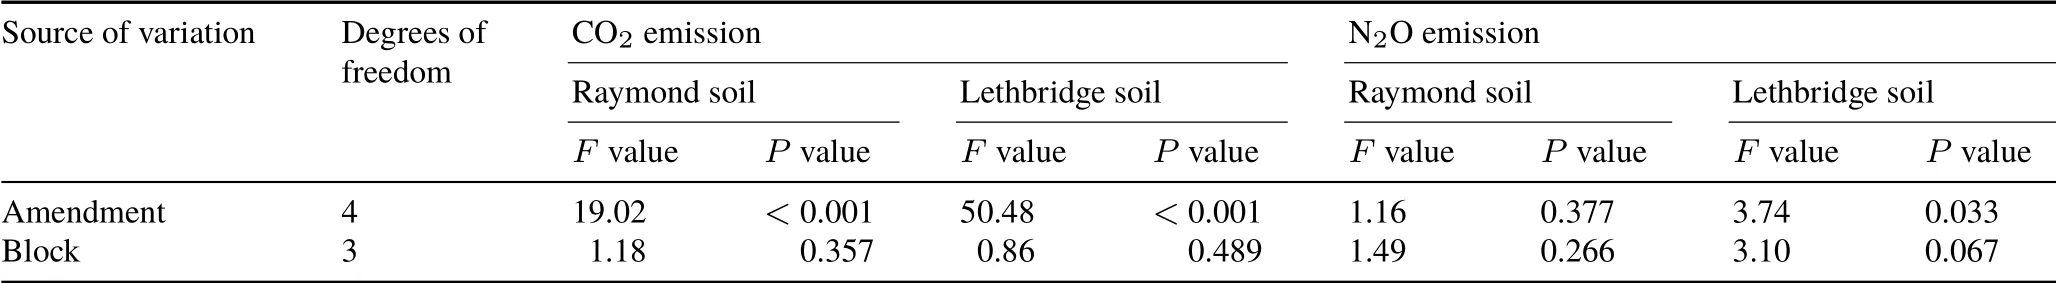
TABLE IV Analysis of variance for cumulative CO2 and N2O emissions from surface(0—15 cm)Mollisols with sandy clay loam(Raymond)and clayey(Lethbridge)textures
In the current study,cumulative CO2emissions were primarily explained by significant CO2fluxes detected during the first sampling events.Peaks in CO2fluxes are typically observed shortly after soil amendment with manure or manure slurries.In a soil column study,Troyet al.(2013)reported that 44%—54%of the applied C from pig manure(170 kg N ha−1)was mineralized within 28 d after application,with most fluxes occurring in the first day.The lack of response of cumulative CO2emissions upon B amendment(relative to CK) was expected since the applied pinewood biochar did not affect soil chemical properties or WEOC and WEN pools.Similar to our results,laboratory findings by Pokharelet al.(2018)revealed that addition of pine sawdust biochar(17 Mg ha−1)to an Orthic Black Chernozem(pH 6.3)in north-central Alberta had no significant effect on cumulative CO2emissions.The incorporation of B to M either through raw mixing(B+M)or dietary manipulation(BM)did not alter manure-derived cumulative CO2emissions,implying that biochar-manure was as microbially labile as manure.Although biochar has been shown to increase the recalcitrance and chemical stability of humic moieties, decomposition processes are frequently not inhibited by the addition of biochar to organic feedstock mixtures(Jindoet al.,2016).To date,however,relatively few studies have analyzed the impact of co-applications of biochar-manure either under laboratory(Troyet al.,2013;Ippolitoet al.,2016)or field conditions(Lentz and Ippolito,2012;Elzobairet al.,2016;Mechleret al.,2018).In a soil column study,Rogovskaet al.(2011)reported that cumulative CO2emissions can be affected by the interaction of biochar and manure,either by biochar-induced stability on manure-derived C or through manure-borne inhibitory effects on biochar mineralization.In contrast,findings by Lentzet al.(2014)and El-Naggaret al.(2015)suggested that CO2emissions were comparable following the application of manure or biochar-manure mixtures to Mollisols or Aridisols,in which microbial communities are largely insensitive to exogenous inputs of labile and recalcitrant C(Ippolitoet al.,2016).
Nitrous oxide emissions
Nitrous oxide flux rates(overall magnitude trends)were comparable between Raymond and Lethbridge soils,despite the two soils responding differently to the imposed treatments(Fig.3c,d).In Raymond soil,mean cumulative N2O emissions ranged from 6.0 to 11.4 mg N2O-N kg−1soil and were not affected(P=0.377)by biochar or biochar-manure amendment (Fig. 4c, Table IV). In contrast, cumulative N2O emissions in Lethbridge soil were increased (P=0.033),on average,by 1.8-fold with BM relative to CK,B,and M(Fig. 4d, Table IV).It is generally recognized that manure-amended soils can exacerbate N2O fluxes by favoring microbial growth,O2consumption,and denitrification through elevated WEOC and WEN concentrations(Coyne,2008;Thangarajanet al.,2013).Biochar addition may decrease cumulative N2O emissions by increasing soil aeration(Yanaiet al., 2007; Rogovskaet al., 2011), diminishing net N mineralization(Lentzet al.,2014),or sorbing NH+4and NO−3pools(Pokharelet al., 2018). However, Troyet al. (2013) reported that mixing biochar with pig manure yielded higher cumulative N2O fluxes than a manure-only treatment. Those authors attributed this increase to higher water-filled pore space and soil OM content following biochar addition.Similarly,Cloughet al.(2010)showed that incorporation of pinewood biochar(20 Mg ha−1)initially stimulated short-term N2O emissions from a silt loam pasture soil(pH 4.9)in the presence of ruminant urine,relative to the urine-only treatment.Unlike CO2fluxes,no clear pattern was observed for cumulative N2O emissions between manure-and non-manure-amended Raymond or Lethbridge soils.Unexpectedly,the addition of M did not increase N2O production relative to CK.In southern Alberta,Ellert and Janzen (2008) and Thomas and Hao (2017) reported that adding cattle manure to an Orthic Dark Brown Chernozem increased N2O emissions by about 50%—70%over irrigated or rainfed controls.The current study was a laboratory-based experiment and the results may differ from those obtained in the field, as plant N uptake can regulate the extent and magnitude of N2O fluxes.Compared to Raymond soil,higher cumulative N2O emissions from Lethbridge soil under BM and B+M may have resulted from biochar-induced porosity and structure in this fine-textured soil.Without biochar,N2O in Lethbridge soil under M may have been fully reduced to N2at 80%WHC(Coyne,2008),accounting for the low cumulative N2O emissions.
Methane emissions
Methane fluxes were low throughout the initial portion of the study, but quickly increased for M,BM,and B+M treatments around days 35 and 42 for Raymond and Lethbridge soils,respectively(Fig.3e,f).In Raymond soil,mean cumulative CH4fluxes ranged from 0.7 to 70.7 mg CH4-C kg−1soil and were increased,on average,by 34.6-fold with B+M and BM applications relative to CK and B(P=0.006,H=14.30)(Fig.4e).In Lethbridge soil,mean cumulative CH4fluxes(1.3—29.7 mg CH4-C kg−1soil)were lower than those observed within Raymond soil.Addition of M or BM increased cumulative CH4fluxes,on average,by 17.6-fold relative to CK and B (P= 0.008,H= 13.67) (Fig. 4f).Initially,CH4fluxes from Raymond or Lethbridge soil were nominal,consistent with previous reports that dryland soils have limited CH4emissions (Htunet al., 2017; Zhanget al., 2017). As expected, shifting Raymond or Lethbridge soil towards anoxicity(i.e.,60%to 80%of WHC)prompted methanogenesis(Thangarajanet al.,2013),even though a lag phase occurred before CH4fluxes exceeded background levels.Methanogens are extremely sensitive to O2and reactive O2forms(Topp and Pattey,1997)and several days may be required to trigger their metabolic activity once soil redox potentials decline below−150 mV(Topp and Pattey,1997;Xionget al.,2007).Several studies have reported reductions in cumulative CH4emissions upon biochar addition,mostly in rice(Oryza sativaL.)paddy systems(Fenget al.,2012).In our study,biochar addition did not affect cumulative CH4emissions from Raymond or Lethbridge soil compared to CK, indicating that B did not increase the uptake of CH4within these soils.Similarly,laboratory findings by Wuet al.(2013)revealed that the addition of wheat straw biochar(10 and 25 Mg ha−1)had no significant effects on cumulative CH4emissions from an Orthic Black Chernozem(pH 5.6)in south-eastern Alberta.In contrast,manure-amended soils(i.e.,M,B+M,and BM)had higher cumulative CH4emissions irrespective of the addition of biochar.These elevated fluxes were attributed to surplus manure-derived WEOC providing labile C substrates(i.e.,electron donors)for CH4production(Conrad,2007).
Phosphorus and N availability
Amending Raymond and Lethbridge with biochar,manure, or biochar-manure affected AP and AN pools, with responses varying between soils(Fig.5).After 70 d,AP in Raymond soil was increased(P=0.031)under BM(6.24 mg kg−1)followed by M(2.86 mg kg−1),B+M(2.32 mg kg−1),and B(0.46 mg kg−1)(Fig.5).Available P in Lethbridge soil was also affected(P=0.011)by biochar-manure with BM>M=B+M=B(Fig.5).Available N in Raymond and Lethbridge soils was characterized by a wide range of NO3-N+NH4-N concentrations(from−0.78 to 29.13 mg kg−1), with BM increasing AN relative to B (Fig. 5). In Raymond soil,AN was increased(P=0.047)under BM(29.13 mg kg−1)and B+M(19.41 mg kg−1)followed by M(15.04 mg kg−1)and B(−0.78 mg kg−1).In Lethbridge soil,AN was also affected(P=0.018)by biochar-manure with BM=M ≥B+M ≥B.
Available P was largely unaffected by the addition of biochar to Raymond and Lethbridge soils.The contribution of biochar to the pool of AP was likely nominal, as the material contained negligible quantities of water-extractable PO4-P (Table I). Alternatively, the relatively low biochar application rate in this study was probably insufficient to promote OM mineralization(Elzobairet al.,2016;Jinet al.,2016)and alkaline phosphatase activity(Gul and Whalen,2016). The absence of significant fluctuations in pH(i.e.,towards alkalinity)upon B addition(Table II)may have also precluded P desorption from Raymond and Lethbridge soil matrices(Jinet al.,2016;Manolikakiet al.,2016).However,the pool of AP was increased following the addition of BM in Raymond soil relative to B and B+M and in Lethbridge soil relative to B,M,and B+M.Elemental analysis of our cattle manure revealed that BM increased water-extractable PO4-P by 2.0-fold relative to M(Table I).The latter suggests that the pinewood biochar(recovered in BM)likely adsorbed some AP while passing through the bovine gut.Research by Josephet al.(2015)demonstrated that several nutrients,including P and N,can be adsorbed into the C lattice of biochar following digestion by cattle,owing to a myriad of fermentation and acid-base reactions fostering the occurrence of reactive C—O, C—OOH, and amino acid/N—C=O functional groups.Once in the soil,nutrient-rich biochar-manure mixtures may increase the availability of PO4-P and NH4-N + NO3-N through interactions with soil microorganisms following the oxidative aging of biochar(Josephet al.,2013,2015)and organic coating with mineral particles (Hagemannet al.,2017; Josephet al., 2018). Nevertheless, future research efforts are required to explain the complexity of nutrient retention and subsequent release from BM mixtures,both at the bulk-and molecular-level,as ruminal biotic agents may play an important role in biochar aging and environmental reactivity in soils(Miaet al.,2017).
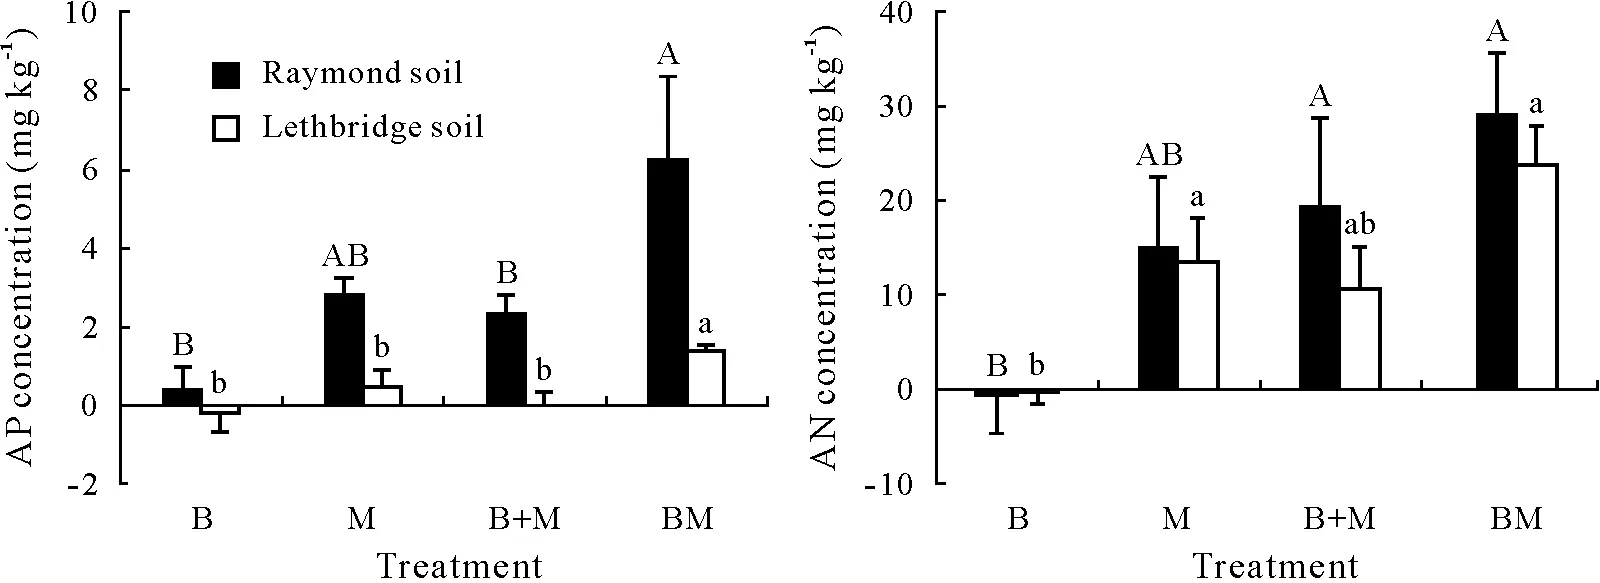
Fig.5 Available P(AP)and available N(AN)concentrations in surface(0—15 cm)Mollisols with sandy clay loam(Raymond)and clayey(Lethbridge)textures after 70-d incubation under different treatments,with the results of analysis of variance shown in Table V.Vertical bars represent standard errors of the means(n=4).Bars with the same letter(s)are not significantly different at P <0.05.See Table II for the detailed descriptions of the abbreviations for treatments B,M,BM,and B+M.
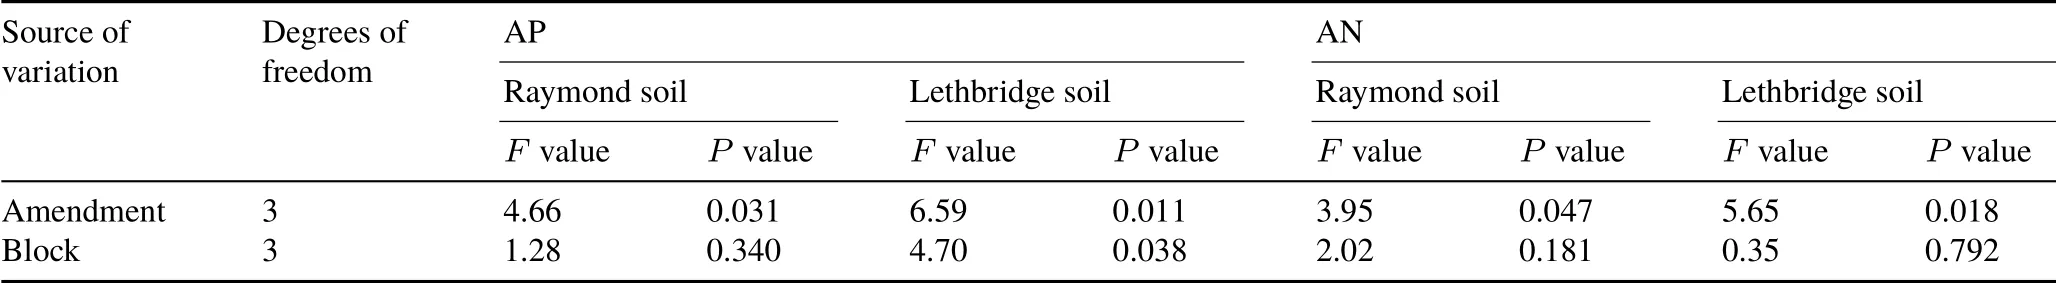
TABLE V Analysis of variance for available P(AP)and available N(AN)concentrations in surface(0—15 cm)Mollisols with sandy clay loam(Raymond)and clayey(Lethbridge)textures
Available N was decreased upon biochar addition relative to CK,implying that a portion of NO3-N+NH4-N was immobilized over the course of our experiment. This phenomenon was likely transient and small-sized,as cumulative N2O emissions from Raymond and Lethbridge soils were not affected by B treatment relative to CK.The addition of biochar to soil has been shown to temporarily induce the microbial uptake of NO3-N+NH4-N pools(Bruunet al.,2012),affecting both nitrification and ammonification pathways(Sarkhotet al.,2012).Similarly,it is plausible to argue that highly recalcitrant,polymerized biochar-derived OM may reduce nutrient availability by sequestering biologically labile pools into humic-like hydrophobic domains(Piccoloet al., 2004). In our study, despite the fact that biochar-manure was enriched by NO3-N+NH4-N relative to manure(2 969.82vs.1 985.89 mg kg−1)(Table I),no significant differences were observed among AN pools under M,B+M,and BM in Raymond and Lethbridge soils.The effect of BM was likely masked by the quick release of AN from the soils under M,as N-enriched biochar may have mineralized slowly within BM (Clarket al., 2019). Furthermore, AN pools may have benefited from unaccounted effects of BM on N-rich organic monomers(i.e.,amino acids)comprising WEN fractions(Clarket al.,2019).Although the long-term effect of BM on N mineralization cannot be ascertained from a short-term incubation study, biochar-manure may have the potential to supply NO3-N + NH4-N for cereal crop production.
CONCLUSIONS
Application of biochar only did not alter cumulative fluxes of CO2,N2O,and CH4relative to CK,implying that relatively low application rates(<3 Mg ha−1)of pyrogenic OM had little effect on nutrient cycling and C storage in surface soil layers.In contrast,M and BM increased CO2and CH4fluxes over CK and B,mainly through a large,enriched pool of WEOC and WEN fractions.Elemental analysis of manure and biochar-manure revealed distinct patterns of P and N availability within the mixtures, suggesting that passage of biochar through the ruminant digestive tract may have improved the agronomic value of manure. This was confirmed by greater amounts of AP released from Raymond and Lethbridge soils under BM.Based on the results of this study,adding biochar to cattle diets appears to be a promising management strategy for improving soil nutrient status of Mollisols.Nevertheless,the long-term implication of BM amendment should be fully considered,as excessive nutrient loading may lead to groundwater pollution.Although column studies are a good starting point for high-throughput analysis of complex interactions between manure-biochar and soil,future studies should incorporate long-term crop field trials where natural conditions prevail.
ACKNOWLEDGEMENTS
This work was funded by the University of Lethbridge(Canada)in partnership with the Agricultural Greenhouse Gases Program (AGGP) of Agriculture and Agri-Food Canada. We thank Ms. Jessica Stoeckli, Mr. Ryan Beck,and Mr.Colten Gurr(AAFC-LeRDC)for their assistance in soil sampling and laboratory analysis.The SEM analysis of biochar samples was performed by Mr.Grant Duke(AAFC-LeRDC). We would also like to recognize Cool Planet Energy Systems,Inc.(Greenwood Village,USA)for provision of the pinewood biochar.
杂志排行
Pedosphere的其它文章
- Notes to Authors
- Mitigating greenhouse gas emissions from croplands and pasturelands—climate-smart agriculture
- Effects of warming,wetting and nitrogen addition on substrate-induced respiration and temperature sensitivity of heterotrophic respiration in a temperate forest soil
- Long-term(42 years)effect of thinning on soil CO2 emission in a mixed broadleaved-Korean pine(Pinus koraiensis)forest in Northeast China
- Larger floods reduce soil CO2 efflux during the post-flooding phase in seasonally flooded forests of Western Amazonia
- Characteristics of greenhouse gas emissions from rice paddy fields in South Korea under climate change scenario RCP-8.5 using the DNDC model