Nitrification inhibitor nitrapyrin does not affect yield-scaled nitrous oxide emissions in a tropical grassland
2021-04-14AnaGabrielaREZCASTILLOCristinaCHINCHILLASOTOJorgeAlbertoELIZONDOSALAZARRonnyBARBOZADongGillKIMChristophLLERAlbertoSANZCOBENAAzamBORZOUEIKhadimDAWARandMohammadZAMAN
Ana Gabriela PÉREZ-CASTILLOCristina CHINCHILLA-SOTOJorge Alberto ELIZONDO-SALAZARRonny BARBOZADong-Gill KIMChristoph MÜLLERAlberto SANZ-COBENAAzam BORZOUEIKhadim DAWAR and Mohammad ZAMAN
1Environmental Pollution Research Center(CICA),University of Costa Rica,Montes de Oca 11501(Costa Rica)
2Alfredo Volio Mata Experimental Station,University of Costa Rica,Ochomogo 30304(Costa Rica)
3Wondo Genet College of Forestry and Natural Resources,Hawassa University,P.O.Box 128,Shashemene(Ethiopia)
4Institute of Plant Ecology,Justus Liebig University Giessen,Heinrich-BuffRing 26,Giessen 35392(Germany)
5School of Biology and Environmental Science,University College Dublin,Belfield,Dublin 4(Ireland)
6Research Center for the Management of Environmental and Agricultural Risks(CEIGRAM),Department of Chemistry and Food Technology(ETSIAAB),Universidad Politécnica de Madrid,Madrid 28040(Spain)
7Nuclear Agriculture Research School,Nuclear Science and Technology Research Institute(NSTRI),Karaj 31465-1498(Iran)
8Department of Soil and Environmental Sciences,The University of Agriculture,Peshawar 25000(Pakistan)
9Soil and Water Management&Crop Nutrition Section,Joint Food and Agriculture Organization(FAO)/International Atomic Energy Agency(IAEA)Division of Nuclear Techniques in Food and Agriculture,Department of Nuclear Sciences and Applications,IAEA,Vienna International Centre,P.O.Box 100,Vienna 1400(Austria)
ABSTRACT Urea is the most common nitrogen(N)fertilizer used in the tropics but it has the risk of high gaseous nitrogen(N)losses.Use of nitrification inhibitor has been suggested as a potential mitigation measure for gaseous N losses in N fertilizer-applied fields.In a field trial on a tropical Andosol pastureland in Costa Rica,gaseous emissions of ammonia(NH3)and nitrous oxide(N2O)and grass yield were quantified from plots treated with urea(U;41.7 kg N ha−1 application−1)and urea plus the nitrification inhibitor nitrapyrin(U+NI;41.7 kg N ha−1 application−1 and 350 g of nitrapyrin for each 100 kg of N applied)and control plots(without U and NI)over a six-month period(rainy season).Volatilization of NH3 (August to November)in U(7.4%±1.3%of N applied)and U+NI(8.1%±0.9%of N applied)were not significantly different(P >0.05).Emissions of N2O in U and U+NI from June to November were significantly different(P <0.05)only in October,when N2O emission in U+NI was higher than that in U.Yield and crude protein production of grass were significantly higher(P <0.05)in U and U+NI than in the control plots,but they were not significantly different between U and U+NI.There was no significant difference in yield-scaled N2O emission between U(0.31±0.10 g N kg−1 dry matter)and U+NI(0.47±0.10 g N kg−1 dry matter).The results suggest that nitrapyrin is not a viable mitigation option for gaseous N losses under typical N fertilizer application practices of pasturelands at the study site.
Key Words: ammonia volatilization,Andosol,Costa Rica,field trial,gaseous N loss,greenhouse gas emission,urea
INTRODUCTION
Productivity of intensive dairy farms is highly dependent on nitrogen(N)inputs from fertilizer application,of which urea is the most common synthetic N form used in agriculture worldwide(IFA,2016).Nitrogen use efficiency(NUE)of field-applied fertilizer is usually less than 50%(Cassmanet al.,2002;Zamanet al.,2013;Degenhardtet al.,2016)due to reactive N(Nr)losses to the environment,particular in gaseous forms such as ammonia(NH3)and nitrous oxide(N2O) (Gallowayet al., 2008; Maet al., 2010; Hénaultet al., 2012). High N lossesviaNH3volatilization from field-applied urea caused by both high humidity and high temperatures may decrease crop productivity,especially in the tropics(Martinset al.,2017).Ammonia volatilization is mediated by hydrolysis of urea to ammoniacal N and hydroxyl and carbonate ions.The concomitant rise in soil pH and high concentration of ammonium (NH+4) around the urea granule alter the base-acid equilibrium between NH+4and dissolved NH3near the soil surface, increasing the risk of NH3volatilization (Bouwmeesteret al., 1985;Zamanet al.,2008).Nitrogen loss as N2O has an important environmental impact due to its strong effect as a greenhouse gas(GHG)as well as an ozone depleting substance(IPCC,2001). Nitrous oxide emissions from soil are attributed to different mechanisms and are usually stimulated by N fertilizer applications(Zamanet al.,2012).Nitrous oxide can be produced during autotrophic nitrification(NH+4oxidation)viathe enzyme ammonia monooxygenase under low oxygen(O2)concentrations(Wrageet al.,2001;Zhuet al.,2013).Denitrification, a microbiological mediated reduction of nitrate(NO−3)to NO−2and then to N2O or dinitrogen(N2),operates under low O2concentrations or anoxic conditions(Saggaret al., 2013). Additionally, there are a few other known mechanisms promoting N2O emissions(Mülleret al.,2014).First,nitrifier denitrification,which is carried out by autotrophic NH3-oxidizing bacteria.This is the pathway whereby NH3is oxidized to NO−2,followed by the reduction of NO−2to NO,N2O,and N2(Wrageet al.,2001;Wrage-Mönniget al., 2018). Second, codenitrification, a hybrid reaction where one N atom in N2O originates from organic N and the other from NO−2is produced by denitrification(Hayatsuet al.,2008).Third,a reduction of NO−2associated with organic N oxidation by a heterotrophic process.This latter mechanism has been highlighted as the prevailing pathway for N2O production in soils with a high organic matter content such as old or permanent grasslands(Chenet al.,2014;Mülleret al.,2014;Zhanget al.,2015).
Many techniques have been tested to improve NUE,either through a reduction in N losses or more controlled release over time(Cameronet al.,2013;Bellet al.,2015;Guardiaet al.,2017a).Among these,nitrification inhibitors have been claimed to reduce N2O emissions(Wolt,2004; Liuet al.,2013).These products inhibit the activity of soil ammoniaoxidizing bacteria and retard the conversion of NH+4into NO−2,the first step of nitrification,thus keeping the applied fertilizer in the form of NH+4.However,higher availability of NH+4could potentially increase NH3losses(Zaman and Blennerhassett, 2010). Assessment of the impact of the use of nitrification inhibitors on N2O emissions and NH3volatilization has shown variable results.Zamanet al.(2009)found that dicyandiamide(DCD)reduced N2O emissions over urine alone by 52%,39%,and 16%in autumn,spring,and summer,respectively,but increased NH3emission by 56%, 9%, and 17%, respectively, on a permanent dairygrazed pasture site in New Zealand.In the UK,Misselbrooket al. (2014) reported that DCD applied with urea and ammonium nitrate in grassland was effective in reducing cumulative annual N2O emissions in only one of three experimental sites,and that NH3emissions were generally not significantly different. They attributed the results on N2O emissions to variability in measurements and dry soil conditions following fertilizer application.A meta-analysis found there was a mean increase of 6.7% in NH3losses from nitrification inhibitor treatment when urine and urea were applied in pasture and arable soils(Kimet al.,2012).However,the same study also reported no change in NH3loss when N was applied together with DCD,concluding that NH3losses are likely to increase after nitrification inhibitor application when soil properties such as soil pH is high and soil cation exchange capacity is low.
In temperate systems,DCD has been reported to reduce N2O emissions in animal urine patches (Cameronet al.,2013).Nitrapyrin reduced N2O emissions by up to 40%over the following 12 months when urea was applied three times at 120 kg ha−1to a grassland in the UK(McTaggartet al.,1997).Also,a meta-analysis of studies on grasslands revealed a mean reduction of 50%in N2O emissions after nitrification inhibitor application(Akiyamaet al.,2010).More recently,in Australia, the difference between N2O emissions from 3,4-dimethylpyrazole phosphate(DMPP)-treated and urea control plots was not significantly different after application of 46 kg N ha−1spread over multiple applications per year on dairy farms.One research trial was carried out under a multi-environment and commercial production conditions(Naueret al.,2018),and another in a randomized complete block design(Doughertyet al.,2016).
Use of nitrification inhibitors has resulted in different effects on pasture yield, ranging from no significant difference with DMPP in ryegrass (Naueret al., 2018) or ryegrass-kikuyu pasture systems(Doughertyet al.,2016),to a 15% biomass stimulation of a permanent grassland treated with a mix ofN-(n-butyl)thiophosphoric triamide(NBPT)and DCD(Zamanet al.,2008).On the other hand,a meta-analysis,that did not include tropical regions,showed that nitrification inhibitors can increase both crop yields and NUE (mean increases of 4.6% and 11.5%, respectively),while the effectiveness was dependent on environmental and management factors(Abaloset al.,2014).
One way to address the effectiveness of nitrification inhibitors is to consider yield-scaled N emissions(i.e.,the ratio between NH3and N2O emissions and agricultural productivity)(van Groenigenet al.,2010),which provides an integrated measure to estimate the effectiveness of nitrification inhibitors to optimize N resources(Sanz-Cobenaet al., 2014; Guardiaet al., 2017b). Moreover, yield-scaled emissions allow evaluation of the effectiveness of nitrification inhibitors under specific climatic,soil,and agronomic conditions(Fenget al.,2016).
This study is important to fill a gap in knowledge for tropical grazed grasslands. Until now, field experiments using nitrification inhibitors to mitigate agricultural N2O emission considering NH3emission have been focused on pasturelands from temperate and subtropical zones(Lamet al.,2017).Currently in Costa Rica,intensive pasture fertilization(every 28—30 d),particularly during the rainy season,is carried out on dairy farms.As Costa Rica’s Livestock Nationally Appropriate Mitigation Actions(NAMA)includes financial support for producers to increase stocking density,fertilizer consumption is expected to expand(MALCR,2015).However,the environmental risk of repeated N fertilizer applications(in particular,N2O emissions)on intensive grasslands in Costa Rica is largely unknown because there have been very few published studies (Veldkampet al.,1998, 1999; Montenegro and Abarca, 2002; Montenegro and Herrera,2013).In particular,information on the effect of nitrification inhibitors on NH3and N2O emissions in relation to pasture yield is not available.
The main objective of this study was to quantify the effect of nitrapyrin on yield-scaled N2O emissions and NH3fluxes after urea application on a tropical grassland volcanic soil in Costa Rica.
MATERIALS AND METHODS
Study site
The study was conducted during the rainy season of 2016(from June 3 to December 5)at a permanent pasture site(9◦54′42′′N,83◦57′18′′W;1 545 m above sea level)in the Alfredo Volio Mata Experiment Station (EEAVM)located in Ochomogo,17 km east of San José,Costa Rica.The site has been managed as a 90%star grass(Cynodon nlemfuensis)and 10%kikuyu grass(Kikuyuocloa clandestina)grassland for more than 20 years,with a stocking rate of 3.5 animal units per hectare.Paddocks have been typically grazed on 28-d rotations during the rainy season, and N fertilizer applied at a rate of 250 kg ha−1year−1during that period. Climate in this region is characterized by an average temperature of 19.3◦C(minimum 13◦C,maximum 23◦C)and an annual precipitation of 1 500 mm from May to November(Elizondo and Boschini,2001).Classified as Typic Haplustand,the soil is formed by recently-deposited volcanic ash and characterized by low acidity(pH 6.1)and high effective cation exchange capacity (11.8 cmol L−1).The soil texture was sandy clay loam(28%clay,12%silt,and 60%sand)with a mean bulk density of 0.86±0.30 Mg m−3.The soils at the experimental area exhibit a relatively high organic matter content(66 g kg−1).
Experimental design
The experimental area(including a 4-m buffer zone)was fenced offsix months prior to treatment application to avoid N deposition from grazing cows.The experiment was set up as two sets of plots, both under a random complete block design.The first set was with four repetitions per treatment(16 plots of 1 m×1 m separated by a 0.8-m buffer zone),where each plot was divided into two subplots,one for N2O and NH3measurements and the other for soil sampling.The second set of plots,with three repetitions per treatment(12 plots of 3 m×3 m separated by a 1-m buffer zone),was for analysis of grass yield and quality,and was established 2 m apart from the gas measurement plots.
The treatments included a control(CK)with no N fertilizer and nitrification inhibitor(i.e.,nitrapyrin),urea application(U),and urea application with nitrapyrin(U+NI).In all plots,grass was harvested with a motor mower(630 Max,BCS,Italy)to 10-cm high every 28—30 d,the mean rotation period used in dairy farms during the rainy season.According to usual practice,six applications of 41.7 kg N ha−1,as urea in granular form,were carried out throughout the rainy season of 2016, specifically on June 1, July 1,August 1,August 31,October 2,and October 30.This rate,equivalent to 250 kg N ha−1year−1, corresponded to the average recommended application rate for star grass under Costa Rican conditions(Rivera,2008).To ensure the urea dose applied in the locations of the NH3chambers,the urea was weighed out and the corresponding amount for the area was very carefully spread on the soil surface to guarantee uniform application. A dose of 882 g ha−1year−1of nitrapyrin, split into six applications, was applied in liquid form(2 mL of ethanol in 5 L of water)with a watering can,2 d prior to each fertilizer application(after mowing)(Zaman and Nguyen,2012),corresponding to 147 g ha−1per application(equivalent to 350 g of nitrapyrin for each 100 kg of N applied as urea).The nitrapyrin dose was equivalent to 87%of the maximum allowable dose (1 010 g nitrapyrin ha−1year−1)when appliedviathe commercial product N-Serve 24E (USEPA, 1996). Because the aim was to eventually apply this mitigation strategy to Costa Rican dairy farms,it was important not to exceed the regulated dose.
Environmental conditions and determination of water-filled pore space(WFPS)
Rainfall, air temperature, and wind speed were registered from an on-site automatic weather station, which was equipped with a rain gauge(TE525,Texas Electronics,USA), a temperature sensor (HMP60, Vaisala, Finland),and an anemometer (05103, RM Young Co., USA). Soil temperature at 10-cm depth was measured with a penetration stem dial thermometer(model 392050,Extech-FLIR,USA)3—4 times between 8:00—13:00 o’clock on each sampling day.
Throughout the study period,WFPS(%)of the plots for N2O and NH3measurements was calculated as follows:

where SWC is the soil water content(m3m−3),BD is the soil bulk density(Mg m−3),and PD is the soil particle density(Mg m−3),which takes the value of 2.65 Mg m−3.
Soil sampling and analysis
Soil composite samples were taken(0—10 cm depth)prior(four samples)and after treatment applications(six samples,two for each treatment).For soil bulk density determination,undisturbed core samples were taken by driving a metal corer into the soil. For soil mineral N determination, one soil sample(0—10 cm depth)was collected using a soil auger from each plot on days 1,3,5,10,and 28 after application of treatments.Soil samples were kept at 4◦C,and 5 g were extracted within 24 h of sampling with 50 mL of 2 mol L−1KCl for 1 h in an orbital shaker(200 r m−1), followed by filtration.Concentrations of NH+4and NO−3were measured by flow injection analysis(FIA)performed on a continuous flow analyzer(Lachat FIA-8000,Hach,USA)(Hofer,2003;Knepel, 2003). Holes in the plots, left behind after soil collection,were filled with soil from outside the plots.A soil sampling grid was established to avoid re-sampling.
Measurement of NH3 emissions
Volatilization of NH3was determined with semi staticopen chambers as proposed by Araújoet al. (2009). The chambers (260 mm in height and 100 mm in diameter)consisted of a transparent polyethylene terephthalate bottle(2-L soda bottle)with the bottom removed and installed on the top to prevent rainfall.One NH3chamber was installed in each measurement plot approximately 5 mm above the soil surface,and the chamber was relocated each sampling day to different positions using three preinstalled wire supports,as suggested by Jantaliaet al.(2012).Inside each chamber,a foam strip(2.5 cm×25 cm and 3-mm thick)presoaked in a solution with 1 mol L−1H2SO4and 4%(volume/volume)glycerol was kept moist during sampling periods:one end was submerged in 15 mL of the acid solution poured into a polypropylene jar suspended in a wire basket inside the chamber. The same jar was used to carry the foam strips from the laboratory to the experimental site.The foam strips were installed at the time of urea application and collected and replaced with new acid traps on days 1, 3, 5, 7, and 10 following fertilizer application (five samples for each N fertilizer application). Foam traps were changed with caution to avoid contamination from handling and placed immediately in the polypropylene jar,sealed,and kept in a cooler with ice until their return to the laboratory.The strips were transferred to Erlenmeyer flasks by rinsing the plastic pots with 50 mL of deionized water and extracted by shaking for 20 min at 220 r min−1on an orbital shaker.The solution was then transferred to 100 mL volumetric flasks and the flasks were filled to the 100 mL mark.A 0.5-mL aliquot of this solution was used for spectrophotometric analysis of NH+4as indophenol in an alkaline medium(Bolleteret al.,1961).Cumulative NH3volatilization(Eca,kg N ha−1)was calculated as:

wheremis the amount of NH3-N trapped by the chamber(g) andAis the area covered by the chamber (m2). The mean percentage of N lost as NH3(n=4)was calculated by dividing the cumulative volatization of NH3-N by the amount of applied N.
The methodology used for ammonia measurements,although it is not a micrometeorological technique,showed a 57%recovery of NH3emissions when it was calibrated by Araújoet al.(2009)using the15N isotope equilibrium technique.As suggested by these authors,a correction factor of 1.74 was applied for the correct estimation of cumulative flows and emissions.Like other methods(e.g.,wind tunnels(Sanz-Cobenaet al.,2011))often used for NH3quantification,the method used in this study is suitable for comparing emissions from contrasting treatments(Jantaliaet al.,2012).
Measurement of N2O emissions
Nitrous oxide fluxes were measured between 7:00—13:00 o’clock three times a week for the first two weeks after the first fertilizer application and then twice a week until the next fertilizer application(ca.28 d after).In October,when rainfall restricted the measurements,measuring was carried out on days 3,4,5,10,and 15 after fertilizer application(two blocks).The emissions of N2O were monitored using a static chamber with a cavity ring-down spectrometer and a GHG analyzer(CRDS-G2508,Picarro Inc.,USA)(de Klein and Harvey,2013).The static chamber(40 cm×40 cm×10 cm)was built from polycarbonate and insulated with an external cover of Styrofoam.An additional polycarbonate extension to the chamber was used when the grass was higher than the cover(towards the end of the cycle).The chamber was placed on a stainless-steel frame(anchor)inserted 12 cm into the soil to minimize lateral diffusion of gases.The frames were inserted 15 d before the beginning of the experiment and kept in place throughout the study period to avoid soil disturbance.A water seal was used to avoid gas leaks between the chamber and the frame.
The GHG analyzer was operated in close mode at default company settings that enabled simultaneous determination of N2O and CO2concentrations in real-time. A chamber deployment time of 15 min was used followed by a 5 min purging period between measurements. This deployment time was selected using the Jackknife procedure.In the implementation of the Jackknife procedure,subsets of changes of N2O concentrations(µmol mol−1h−1)in the chamber headspace were constructed from measured values at regular intervals of 5 min, throughout the sampling period of 30 min. This analysis was performed from eight repetitions distributed over four different days.The specific deployment time was selected from the shortest time with a correlation coefficient(timevs.concentration)higher than 0.90 and a concordance between the N2O concentration calculated for the closure time and the N2O concentration in the ambient air.
A nafion dryer(Perma Pure LLC.,Halma Holdings Co.,USA)was used to remove excess water from the air entering the CRDS-G2508 to prevent water to rise beyond optimal operating levels.Temperature and atmospheric pressure in the headspace were recorded for each measurement with a Kestrel 4 000 weather meter(Loftopia LLC.,USA).The change of N2O concentration in the headspace was calculated by fitting the obtained concentration data as dry mole fraction inµmol mol−1vs.enclosure time,using an exponential fit.The slope of this curve was evaluated by time derived att=0,that is assumed to represent the pre-deployment flux(Christiansenet al., 2015). The flux of N2O (F, µg m−2h−1)was calculated as follows:

where δC/δtis the change of N2O concentration with time(µmol N2O mol−1headspace air h−1),nis the moles of gas in the headspace calculated using the ideal gas law,andMis the N mass(28µg Nµmol−1N2O).The minimum detectable flux(MDF)was defined as the flux equivalent to the analytic precision of raw output(0.025µmol N2O mol−1)from the GHG analyzer(Picarro Inc.,2013)divided by the enclosure time (0.2 h without offset time) and calculated using Eq.3 under the field trial conditions(average chamber volume 0.017 m3, chamber area 0.016 m2, mean air temperature 22◦C, and atmospheric pressure 84 600 Pa). Finally, the quantification limit was set to three times the MDF.
Proper operation of the CRDS-G2508 was checked by comparing ambient air concentrations of N2O and CO2against those of samples.For this quality control procedure,three air samples were taken and injected at overpressure into 20-mL vials in the field at least 24 times during the experiment.Samples were analyzed on a gas chromatograph(GC)Agilent 7890A equipped with a headspace autosampler Agilent 7697A(Agilent Technologies,USA).The GC system was calibrated using Praxair-certified analytical grade standards of mixtures of N2O,CH4,and CO2,and N2as balance gas.The standard gas concentrations had an uncertainty of 5%.Concentrations were evaluated by a linear fit curve with four points from 0.24 to 3.1µmol mol−1for N2O and from 385 to 2 000µmol mol−1for CO2.
Throughout the experimental period,ambient air concentrations of N2O and CO2were measured every sampling day,and recorded in a control chart to ensure the equipment was functioning properly. In addition, between measurements,the CRDS-G2508 was allowed to return to baseline air concentration to ensure cleanliness.
The change in rate of CO2over time was used to ensure that there were no leaks from the chamber to the CRDSG2508,according to the following two accepted criteria:a regression coefficient(timevs.concentration)greater than 0.99,and a CO2flux greater than 86 mg CO2m−2h−1.The last value corresponded to the lower confidence limit at 95%of the CO2flux measured in the control plots(freshly cut grass and no synthetic or natural N fertilizer input for the previous six months)during the driest months of the year(February and March)when the lowest respiration rate was expected.Finally,flux data analysis for N2O was done under the following criteria:if the quadratic regression coefficient of concentration change rate of N2O was less than 0.9,and the fluxes were lower than 26.3µg m−2h−1(the double of detection limit),the values were replaced by the detection limit.If the fluxes were greater than 26.3µg m−2h−1but lower than the quantification limit,the reported values were kept.If the values were greater than the quantification limit and the quadratic regression coefficient of concentration change rate of N2O was higher than 0.90, they were kept without change.Otherwise,N2O fluxes were rejected.
Cumulative N2O emission(Ecn,kg N ha−1)was calculated by the trapezoidal method:
whereFiandFi+1are theith and(i+1)th measured values of N2O flux (µg m−2h−1), andtiandti+1are the time whenFiandFi+1are measured(h).
Yield estimation and nutritional quality of the grass
A 1.0 m2of harvested grass randomly selected within each plot was weighed to estimate the total green forage production per plot.Grass harvested from the entire plot was then mixed,and a representative sample was taken and dried at 60◦C for 72 h.Finally,samples were ground to<1.0 mm with a Wiley mill(Model#2,Arthur H.Thomas Co.,USA).Dry matter(DM)content was determined in an oven at 105◦C for 24 h.Total N was determined by the Kjeldahl method,and total N content was then multiplied by 6.25 to estimate crude protein(CP)content(AOAC International,2000).
Determination of yield-scaled NH3 and N2O emissions
Yield-scaled NH3or N2O emission (EyaorEyn, g N kg−1DM)was calculated as the ratio of cumulative NH3or N2O emission(EcaorEcn,kg N ha−1)to the total yield(TY,kg DM ha−1)in each treatment during the rainy season:
In the case of yield-scaled NH3emissions,as the method used was not a micrometeorological one and,as such,not sensitive to changes in, for example, weather conditions,results have to be used for comparative purposes to assess the net performance of treatments.
Statistical analysis
Statistical data analysis was carried out using InfoStat version 2008 (Di Rienzoet al., 2008). Data distribution normality was tested by the Shapiro-Wilkes test.An analysis of variance(ANOVA)was performed to check if there were significant differences between treatments.Means were separated by least significant differences(LSD)when treatment effect was significant (P <0.05). Changes in soil properties after the treatment application(compared to the base line)were evaluated by an unpairedt-test(P <0.05).The ANOVA of biomass yield,DM,and CP content were performed by PROC MIXED(SAS/STAT version 9.2).To test significances of these three variables,Tukey’s test was performed (P <0.05). The yield-scaled NH3and N2O emissions were compared by means of the 95%interval confidence calculated from their respective standard deviations obtained from the combined standard uncertainty.
RESULTS
Soil WFPS and mineral N
Total rainfall over the experimental period at EEAVM was 1 292 mm,with August being the driest(50 mm)and October the wettest (408 mm) month (Fig. 1a). Singular rainfall events of more than 45 mm in June,July,September,October,and November caused a variation of WFPS between 35%—55%in the top 10 cm of soil(Fig.1a).
Fig.1 Precipitation and soil water-filled pore space(WFPS)(a)and NH+4 (b)and NO−3 (c)contents in the three treatments,control(CK),urea application(U),and combined application of urea and nitrapyrin(a nitrification inhibitor)(U+NI),of an experiment conducted in 2016 on a permanent pasture in the Alfredo Volio Mata Experiment Station,Ochomogo,Costa Rica.Arrows indicate the times when urea was applied.Vertical bars indicate standard errors(n=4).
In June,no accumulation of NH+4was observed(Fig.1b),while peak NH+4concentrations in the U and U+NI treatments were observed within 1—3 d after fertilizer applications in August and October,and on day 5 in July and September.Soil NH+4content decreased throughout the experiment,along with a concurrent increase in soil NO−3content, in August and September. The conversion of NH+4to NO−3was not slowed down by nitrapyrin application; thus the U + NI plots did not exhibit higher accumulation of soil NH+4.In general,the maximum NO−3contents in the U and U+NI treatments were measured 3—5 d after each fertilizer application(Fig.1c).In October when WFPS reached around 55% due to intense rainfalls, soil NH+4content in the U and U+NI treatments was significantly higher(P <0.05)on day 1 after fertilization and decreased very quickly thereafter,while soil NO−3only slightly increased in the U+NI treatment.A comparison of NO−3content between the U and U+NI treatments showed significantly higher contents(P <0.05) in the U plots on days 9 and 1 after fertilizer application in June and July,respectively,and in the U+NI plots on day 5 in July.
Ammonia volatilization and N2O emission
Variation in daily temperature between June and November was small.The maximum air temperature was 28.9±0.6◦C and the minimum was 12.7±0.6◦C,with a mean of 19.1±0.3◦C.Additionally,the soil temperature at 10-cm depth measured during the sampling periods presented little variation.Maximum temperature registered for soil was 22.0±0.7◦C and the minimum was 19.1±0.6◦C, with a mean of 20.4±0.6◦C.Mean wind speed varied from 1.64(October)to 2.82 m s−1(August).Ammonia volatilization was stimulated by N fertilizer application (Fig. 2a), and its maximum emission coincided with the NH+4accumulation pattern (Fig. 1b). The highest NH3emission rates were observed between days 1 and 5 after each N fertilizer application,without any lag between the peaks of the U and U+NI treatments.In November,the pattern was different as high NH3volatilization in the U treatment was prolonged until day 8.Between August and November,the highest NH3cumulative emissions were reached in November when there was no rain during the first 4 d after fertilizer application(Table I).On the other hand,the presence of nitrapyrin(in the U+NI treatment)did not affect NH3accumulated losses during the first 10 to 12 d after urea application,which were significantly lower(P <0.01)only in CK(no N input).The U treatment lost between 4.3%±0.9%and 12.9%±3.5%of the 41.7 kg N ha−1applied each month as NH3,while the U+NI treatment losses were between 6.0%±2.0%and 12.1%±1.7%.
Totally,732 values of N2O fluxes were obtained from June to November, of which 83%remained after the data quality check.Of this group,28%were below the estimated detection limit (13.1 µg N m−2h−1), and only 4% were above 60 g N ha−1d−1(Fig.2b).The low fluxes(<13.1µg N m−2h−1)were mainly observed in the CK(48%)and after more than 10 d of urea application in the U and U+NI treatments(42%).
Fig.2 Volatilization of NH3 (a)and N2O emission(b)from the three treatments,control(CK),urea application(U),and combined application of urea and nitrapyrin(a nitrification inhibitor)(U+NI),of an experiment conducted in 2016 on a permanent pasture in the Alfredo Volio Mata Experiment Station,Ochomogo,Costa Rica.Arrows indicate the times when urea was applied.Vertical bars indicate standard errors(n=4).
Emissions of N2O increased quickly after N fertilizer application(Fig.2b).In June,July,and August,in the last case only for U treatment,the maximum emission rates were reached between days 1 and 3 before maximum soil NO−3contents occurred,while in September and November,the first peak occurred on day 5.Concurrently with increased WFPS(Fig.1a),smaller peaks of N2O emission were observed between days 7 and 12 after N fertilizer application in June, July, and August, and between days 9 and 16 in September and November.Fertilizer application at the beginning of October and the following frequent rain events resulted in extremely high emissions in U and U+NI,at 164 and 252 g N ha−1d−1,respectively,on day 4 after N fertilizer application.During the first 10 d following fertilizer application in October, N2O emissions accounted for 25%and 29%of total emissions of the rainy season for the U and U+NI treatments,respectively.
Cumulative N2O emissions from CK were significantly lower(P <0.05)than from U and U+NI(Table II),and significant differences(P <0.05)in N2O emissions between CK and U were observed in June, August, and October.Also, cumulative N2O emissions were not significantly different between U and U+NI except in October,when the cumulative emissions from the U+NI treatment were 69%higher than those from the U treatment.The high emissions observed in October for the U +NI treatment resulted in significantly higher (P <0.05) cumulative emissions for this treatment in comparison to the U treatment for the rainy season of 2016.
Yield-scaled emissions and grass nutritional quality
Average DM yield during rainy season and per fertilizer application,and CP production of grass were significantly different(P <0.05)between CK and fertilized plots but not significantly different between the U and U+NI treatments(Table III).The yield-scaled volatilization of NH3and emissions of N2O in fertilized treatments tended to be greater but not significantly different from CK(Table IV).
DISCUSSION
Effect of treatment application on soil mineral N
The sharp increase in soil NH+4content soon after urea application compared to the control(Fig.1b)suggested a fasturea hydrolysis.In June,the lack of NH+4accumulation and the increase in the soil NO−3content in U or U+NI treatment plots(Fig.1b,c)provides evidence of active NH+4oxidation to NO−3(autotrophic nitrification).In October,the lack of increment in soil NO−3content in the plots treated with urea was probably related to a fast reduction by denitrification,as a result of enhanced anaerobic soil volume caused by the intense rain(Fig.1a),and to the partial leaching of NO−3,which could be lower in the U+NI treatment and explain the small peak observed.
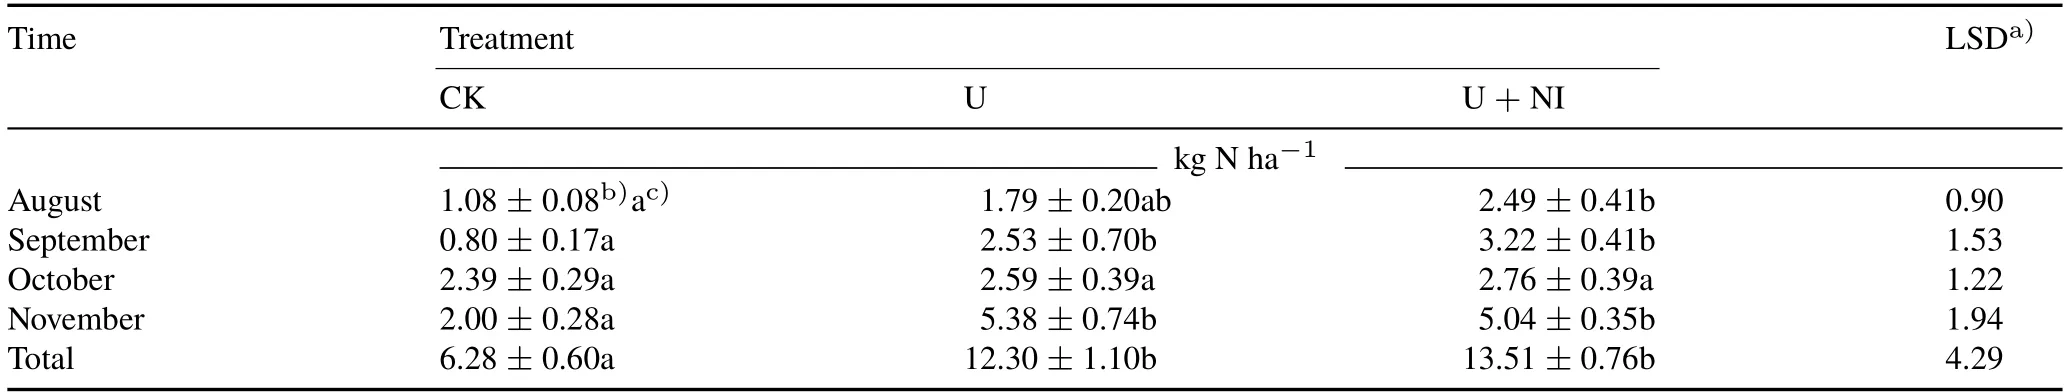
TABLE I Cumulative NH3 volatilization from the three treatments,control(CK),urea application(U),and combined application of urea and nitrapyrin(a nitrification inhibitor)(U+NI),of an experiment conducted in 2016 on a permanent pasture in the Alfredo Volio Mata Experiment Station,Ochomogo,Costa Rica
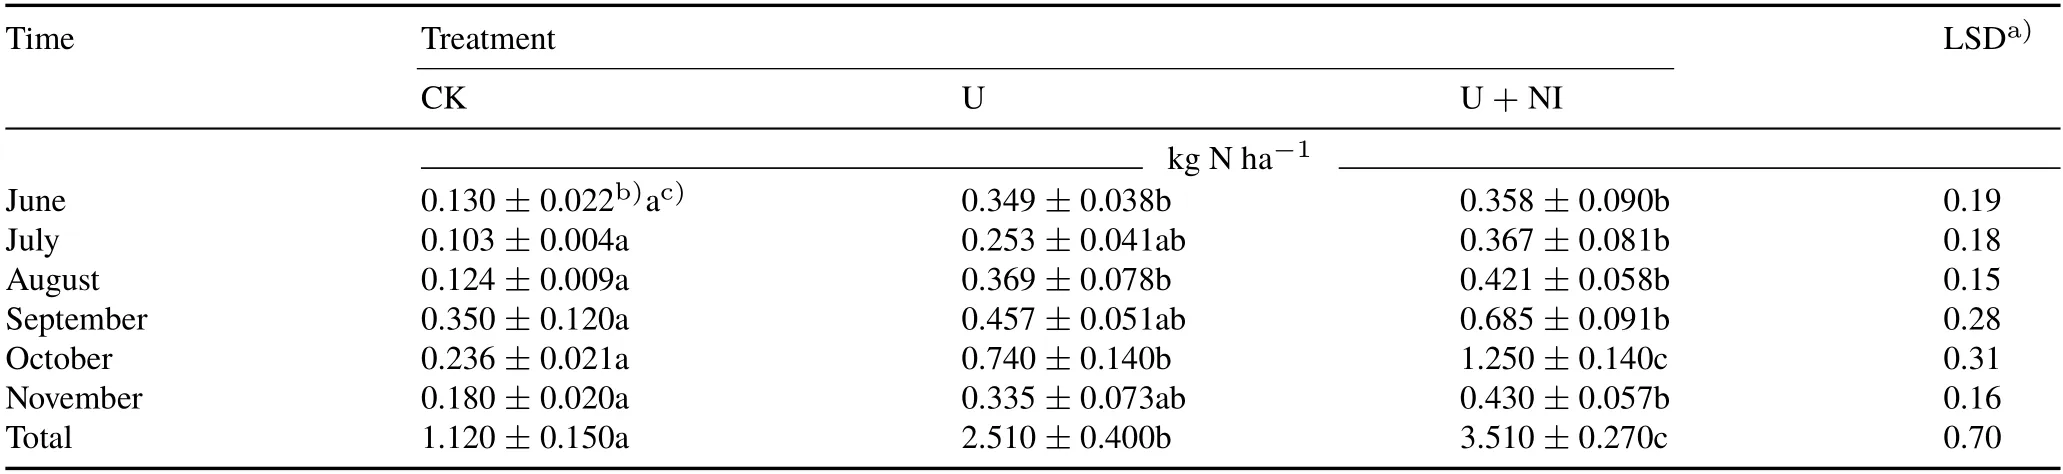
TABLE II Cumulative N2O emission from the three treatments,control(CK),urea application(U),and combined application of urea and nitrapyrin(a nitrification inhibitor)(U+NI),of an experiment conducted in 2016 on a permanent pasture in the Alfredo Volio Mata Experiment Station,Ochomogo,Costa Rica
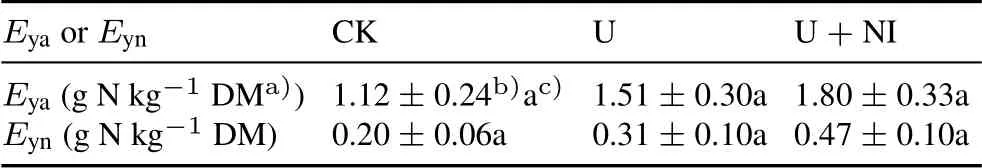
TABLE IV Yield-scaled emissions of NH3(Eya)and N2O(Eyn)in the three treatments,control(CK),urea application(U),and combined application of urea and nitrapyrin(a nitrification inhibitor)(U+NI),of an experiment conducted in 2016 on a permanent pasture in the Alfredo Volio Mata Experiment Station,Ochomogo,Costa Rica
The raise in surface soil NO−3content along with the concurrent decline of NH+4during the first days after fertilizer application(the U and U+NI treatments)in August and September points to fast nitrification after urea hydrolysis.The WFPS of 35%—55%(Fig.1a)and aerobic conditions during times when NH+4is available are conducive for fast nitrification(Bateman and Baggs,2005;Menéndezet al.,2012).Differences in the intensity of the rainfalls occurring just after fertilizer application,which has an effect on leaching and denitrification rates,can most likely explain the observed NO−3dynamics(Menéndezet al.,2009;Cameronet al.,2013).
Previous studies found that treatments with nitrapyrin and other nitrification inhibitors increased accumulation of soil NH+4(Abaloset al.,2014).However,our study found that a higher accumulation of soil NH+4did not occur in U+NI compared to U.The reasons for this might be that in this Andosol,characterized by high organic matter content,nitrapyrin did not effectively inhibit NH+4oxidation, the effectiveness of nitrapyrin decreased due to adsorption on organic matter,or the high activity of microbes stimulated the degradation of nitrapyrin(Fisket al.,2015).
Similar temporal variabilities of NO−3content in the topsoils of U and U+NI suggest that split application of N fertilizer minimized N losses and reduced the net effect of nitrapyrin under the conditions tested.On the other hand,the increase in NO−3was likely caused by heterotrophic nitrification(oxidation of organic N to NO−3),a process that is unaffected by the presence of nitrification inhibitors,and has been reported to be responsible for nitrification in soils with high organic matter content and a pH less than 6.5 during high rainfall events(Mülleret al.,2014;Wanget al.,2016).
Ammonia volatilization
The build-up of NH+4and high NH3losses within the first 48 h after fertilizer application,which declined to the baseline around day 10 (Fig. 2a), are likely attributed to stimulated urea hydrolysis because of rainfall and subsequent high soil moisture content after fertilizer application.Previous reports show that soil moisture drives rapid losses of NH+4and NH3in tropical soils(Martinset al.,2017).In contrast,observations from subtropical regions,under low soil moisture conditions, indicate that high NH3-N losses start 5 d after N fertilizer application and reach the highest peak at about days 12—16(Tianet al.,2015).
Highest NH3volatilization rates were observed in November,which was likely related to the rainfall pattern during the first 5 d after fertilizer application, with initially high soil moisture content followed by low rainfall(Fig.1a).This change from high soil moisture content to dry conditions has been associated with increased diffusion and hydrolysis of urea without transport of NH+4into the soil, thereby triggering higher NH3emissions(Bouwmeesteret al.,1985;Tianet al.,2015).In October,the lack of difference between the urea application treatments and the control(Table I)was probably caused by the opposite situation,when heavy rains covered the plots with a flim of water, moving the NH+4three centimeters beyond the soil surface,thus limiting NH3volatilization.
The ratio of NH3losses/applied N as urea showed a wide range of values,but they were in the range previously reported for granulated urea broadcast at similar rates of 6%—21% in the UK (Rydenet al., 1987) and 7.5%—15%in New Zealand(MAFNZ,2011).The variability of NH3losses can be attributed to environmental conditions such as rainfall pattern,soil moisture,and wind(Bouwmeesteret al.,1985;Zamanet al.,2009).High organic carbon(C)found in our soils seemed to buffer NH3loss(7.4%—8.1%of N applied over six months).Similar observation of 1.9%of applied N was documented by Tianet al.(2015)in a soil with 66 g kg−1organic C.This is in contrast to soils of low organic C(8.5 g kg−1)where up to 54%of the applied N was lost(Martinset al.,2017).
Contrary to previous reports for DCD (Zaman and Blennerhassett, 2010), no differences in cumulative NH3loss between the U and U+NI treatments were observed.This is likely attributed to the quick conversion of NH+4to NO−3shortly after N application (Bateman and Baggs,2005;Menéndezet al.,2012).Kimet al.(2012)conducted a meta-analysis of the effect of nitrification inhibitors on NH3emissions and found similar results in grassland soils with pH and cation exchange capacity comparable to those of our soils.
Nitrous oxide emission
The values of daily N2O emission observed in our study,95% below 60 g N ha−1d−1with a maximum of 252 g N ha−1d−1,are similar to those observed by Naueret al.(2018)in Australian grasslands with similar fertilizer managements. In the treatments with urea, the highest N2O emissions (Fig. 2b) were observed before the highest soil NO−3contents from June to August (Fig. 1c). The results suggest that N2O is not only associated with soil NO−3content, but also with other soil N pools such as NO−2from various transformations,which is a much more direct precursor of N2O in soils(Mülleret al.,2014).
Several possible hypotheses could explain the observed lack of effect of nitrapyrin on N2O emissions in June,July,August, and November (Table II). First, NO−3was likely producedviaprocesses that are not inhibited by nitrification inhibitors,such as heterotrophic nitrification,which has been identified as a predominant pathway for N2O emissions in organic grassland soils around the world(Mülleret al.,2014;Wanget al., 2016). Second, fertilizer was fractionated at a dose (250 kg N ha−1) that closely matches grass consumption(226±11 and 216±55 kg N ha−1in U and U+ NI, respectively), which is in line with the observation that mitigation action of nitrification inhibitors is greater in those cropping systems that demand higher N inputs(Thapaet al., 2016). Third, the nitrapyrin dose of 882 g ha−1,split in six applications of 3.50 g nitrapyrin kg−1N applied,might be not enough to inhibit nitrification under the experimental conditions. In Costa Rica’s grasslands,N is not normally injected, and therefore, contrary to the manufacturer recommendations,nitrapyrin was applied as an aqueous suspension, and its high volatility might have reduced its effectiveness(Trenkel,2010).Others have shown that a decrease in the effectiveness of nitrification inhibitors is linked to high soil organic C and low pH(Zamanet al.,2009)conditions present at our experimental site.Hendrickson and Keeney(1979)showed that 0.83 g nitrapyrin kg−1N applied effectively inhibited nitrification under conditions of restricted volatility,but more than 1.66 g nitrapyrin kg−1N applied were needed to control nitrification if volatility was favored.The same study indicated that although 1.66 g nitrapyrin kg−1N applied inhibited nitrification in soil with 10 g kg−1organic matter,the effect was not maintained if soil organic matter was 50 g kg−1.Additionally,significant reductions in N2O emissions have been reported at higher doses,for example at 62.5 g nitrapyrin kg−1N applied in temperate pastures with 55 g kg−1organic matter(McTaggartet al., 1997), and 10.8 g nitrapyrin kg−1N applied(equivalent to 560 g ha−1year−1)in subsurface application for no-tillage maize with 8.5 g kg−1soil organic C(Martinset al.,2017).
Naueret al.(2018)and Doughertyet al.(2016)reported no significant differences in N2O flux between the treatments of urea application and treatments with combined application of urea and DMPP in permanent pasture used for dairy production under similar urea rate of 42—46 kg N ha−1application−1and DMPP dose of 0.16% urea(weight/weight).Naueret al.(2018)argued that high soil moisture (30%—40%, volume/volume) might have affected the effectiveness of the nitrification inhibitors and denitrification process.
The higher N2O emissions in both the U and U+NI treatments in October as compared to other periods might be a combined result of N fertilizer application,frequent heavy rain events,and WFPS around 55%,since these are important driving factors for N2O production(Bellet al.,2015).High emissions between days 1 and 3 after urea application in October could be due to autotrophic nitrification and organic N oxidation(Bateman and Baggs,2005;Mülleret al.,2014).Furthermore,N2O could also be produced by heterotrophic denitrification in anaerobic microsites that coexist in the soil profile,especially after rainfall events(Seyet al.,2008;Martinset al.,2017).Interestingly,in October,N2O emission in the U + NI treatment was significantly higher than in U(Table II),and this suggested that nitrapyrin application played a certain role in increasing N2O emissions,which is the opposite to our general understanding about the effect of nitrapyrin on N2O emissions.This finding might be attributed to enhanced heterotrophic nitrification or denitrification due to energy provided by ethanol or 30% of impurities present in the nitrapyrin used(Crawford and Chalk,1992).This effect is likely to be increased by heavy rains during the three days prior to fertilizer application and following application(Dobbie and Smith,2003;Ruseret al.,2006).Also,lower leaching of NO−3in U+NI between days 1 and 3 after fertilizer application in a period of heavy rains could contribute to higher emissions.
Effect of N fertilizer application strategies on yield and nutritional quality of grass and yield-scaled emissions
As expected, the grass yield in CK was significantly lower than in U or U+NI(Table III),which indicates that the soil was N limited.Dry matter yields were smaller than those obtained by Villalobos and Arce(2013),who,when fertilizing at 250 kg N ha−1year−1and performing cuts at 28 d of regrowth,reported yields of 2.2—6.0 t DM ha−1cycle−1in the region of Monteverde,Puntarenas-Costa Rica,which is characterized by an average annual precipitation of 3 223 mm.Johnsonet al.(2001)also evaluated star grass and found average values of biomass production similar to the present study(Table III),1.4 t DM ha−1cycle−1at a same N dose as in our study.It is necessary to consider that there are geographical areas where the productive potential of the pasture can be limited by the climate(Cooket al.,2005).
Crude protein content(Table III)was 3%—5%lower than that reported by Sergio(2007)of 203 g kg−1for star grass in San Carlos,and higher than that reported by Villaloboset al. (2013) of 142 g kg−1in Monteverde. It should be noted that samples in the present test were taken from the whole plant(leaves and stems),unlike samples intended for nutritional analysis in the test carried out by Sergio(2007),where samples were taken from the pasture canopy whose main structural component is leaves.
Yield-scaled NH3and N2O emissions showed that nitrapyrin,under the prevailing experimental conditions,is not a viable mitigation option for gaseous N release(Table IV).Our results suggest that if the split N applications reduced N losses,this could conceal the nitrapyrin effect and any yield differences between the U and U+NI treatments(Thapaet al.,2016)because there was no N surplus on which nitrapyrin could act. No significant yield-scaled N2O emissions between fertilizer application treatments were observed in this study,which is in line with the results of Naueret al.(2018)and Doughertyet al.(2016),who used the inhibitor DMPP with a similar nutrient management regime on pasturelands.It has been suggested that nitrification inhibitors are unlikely to help to increase yields beyond conventional N fertilizers when N is applied at the recommended rate.Therefore,for nitrification inhibitors to show its potential to significantly increase yields,trials should be done using a suboptimal N rate(Rowlingset al.,2016;Roseet al.,2018).
Limitations of the study and suggestions for future studies
The observation that there was no significant difference in N2O emissions between the U and U+NI treatments suggests that an evaluation of the functional role of heterotrophic nitrification is critically needed to understand pathways that may explain the N dynamics in agro-ecosystems,as pointed out by previous researchers(Mülleret al.,2014;Zhanget al.,2015).The use of15N-enriched fertilizer and the monitoring of15N2O could aid to identify the sources of N2O and to link them with the underlying N-mineralization and immobilization processes present in volcanic soil grasslands(Bateman and Baggs,2005;Zhanget al.,2015).
The results of this study cannot be extrapolated to the tropical pastures of the region since this study only covered a single site,a soil type,an application method of nitrapyrin and fertilizer,and a single rainy season.In particular,it remains to be evaluated whether the results would be different if ethanol was excluded from the dispersion process of nitrapyrin into water, or if the inhibitor was applied together with the fertilizer.
To explore conditions where the use of nitrification inhibitors can be an economically and environmentally viable mitigation option in Costa Rica and in the Central American region, further field trials should be carried out to clarify at least two issues.First,as suggested by other field studies(Rowlingset al.,2016;Naueret al.,2018),yield-scaled NH3and N2O emissions need to be monitored after applying suboptimal doses of fertilizer. Second, it is necessary to evaluate the effect of nitrification inhibitors at higher ratios of inhibitor:urea so as to adjust the dosage to the conditions of permanent pastures, where organic matter content and soil moisture are high and fertilizers are not incorporated into the soil.
CONCLUSIONS
Results from this study on a tropical grassland with high organic C content and under a high rainfall intensity showed that the nitrification inhibitor nitrapyrin is not effective and,therefore,its application should not be recommended as a mitigation strategy for N2O emissions under these conditions.It is necessary to carry out additional field trials at various sites with different fertilizer application rates and doses of nitrapyrin and other nitrification inhibitors to explore mitigation options that are effective in tropical pasturelands.
ACKNOWLEDGEMENTS
We thank José Manuel Monge,Mayela Monge Muñoz,María José Moya,and José Rolando Montiel from the Environmental Pollution Research Center(CICA),University of Costa Rica for their help in fieldwork. This work was funded by the International Atomic Energy Agency(IAEA),Vienna, Austria, through a Coordinated Research Project(No. CRP D1.50.16) of the Soil and Water Management and Crop Nutrition Section, Joint FAO/IAEA Division of Nuclear Techniques in Food and Agriculture and through the Technical Cooperation Project(No.COS5031),and by the University of Costa Rica(No.VI-802-B7-505).
杂志排行
Pedosphere的其它文章
- Notes to Authors
- Mitigating greenhouse gas emissions from croplands and pasturelands—climate-smart agriculture
- Effects of warming,wetting and nitrogen addition on substrate-induced respiration and temperature sensitivity of heterotrophic respiration in a temperate forest soil
- Long-term(42 years)effect of thinning on soil CO2 emission in a mixed broadleaved-Korean pine(Pinus koraiensis)forest in Northeast China
- Larger floods reduce soil CO2 efflux during the post-flooding phase in seasonally flooded forests of Western Amazonia
- Characteristics of greenhouse gas emissions from rice paddy fields in South Korea under climate change scenario RCP-8.5 using the DNDC model