Seabird and marine mammal at-sea distribution in the western Bering Sea and along the eastern Kamtchatka Peninsula
2021-04-09ClaudeJOIRIS
Claude R. JOIRIS
• Article •
Seabird and marine mammal at-sea distribution in the western Bering Sea and along the eastern Kamtchatka Peninsula
Claude R. JOIRIS
Laboratory for Polar Ecology (PolE), 26130 Saint-Restitut, France;Conservation Biology Unit, Royal Institute for Natural Sciences, 1000 Brussels, Belgium
Seabird and marine mammal at-sea distribution in the western Bering Sea and along the eastern Kamtchatka (Kamtsjatka) Peninsula was determined during 114 transect counts, lasting 30 min each, in September 2018. A total of 58000 seabirds were tallied,a mean value of 510 per count. The most abundant species was short-tailed shearwater: 43250 individuals representing 74% of the total. Fulmar and kittiwake represented 13% and 8% of the total. Important geographical differences were noted, concerning both the number of seabird species and their abundance. The following species were tallied mainly in the northern zone (North of 60°N): fulmar (light morphs), short-tailed shearwater, Vega (herring) gull and horned puffin. In the southern zone, including Commander (Komandorski) Islands, observed species included fulmar (dark morphs), pelagic cormorant, glaucous-winged gull, red-legged kittiwake and black guillemot. The vast majority of the 100 cetaceans and 40 pinnipeds were tallied in the southern area, mainly porpoises, killer whale and humpback whale, and Largha (spotted) seal.
seabirds, marine mammals, at-sea distribution, Bering Sea, Kamtchatka
1 Introduction
In the framework of our long-term study on the at-sea distribution of top predators—seabirds and marine mammals—in poorly studied areas, especially polar ones, I had the opportunity to participate in an expedition in the western Bering Sea and off East Kamtchatka. The area is known for its high bio-production, thanks to important advections favouring the whole food chain, from phyto- and zooplankton to the top predators (Springer et al., 1996; Artyukhin and Burkanov, 1999; Piatt and Springer, 2003; Mokievsky et al., 2016; Lee et al., 2020). Less is known however about the western Bering Sea and the area East of the Kamtchatka Peninsula, especially about at-sea distribution. This study forms a complement to the previous one along the Bering Strait and the adjacent Chukchi Sea (Joiris, 2020a).
2 Materials and methods
I participated in an expedition on board a small Russian tourists’ ship (110 m long, 50 passengers) from Anadyr to Petropavlovsk, between 3 and 14 September 2018 (Figure 1). Our counting method consists of 30 min transect counts from the bridge (11 m above sea level), light and visibility allowing, without width limitation; see recent description and discussion in Joiris (2020b). Animals are detected with the naked eye and confirmed with binoculars (10 × 40) when necessary. Data are presented as numbers per count, without any correction,for their diving pattern nor calculation as density.
Two geographical zones were recognised. The first one, North of 60°N (N), consists of shallow waters on the continental shelf. The southern one also includes deeper water (Kamtchatka, including Commander (Komandorski) Islands) (Figure 1).

Figure 1 Data collected during the Bering Sea and Kamtchatka expedition, in September 2018; count numbers, zones North and South: see text.
3 Results
During the whole expedition, 58000 seabirds were tallied during 114 transect counts lasting 30 min each,a mean value of 500 individuals per count, belonging to 30 species (Table 1, Figure 2). The most numerous species were 43000 short-tailed shearwaters“overwintering” in the area, representing 74% of the total; 7800 fulmarsrepresented 13% and 4400 black-legged kittiwakesrepresented 8%.
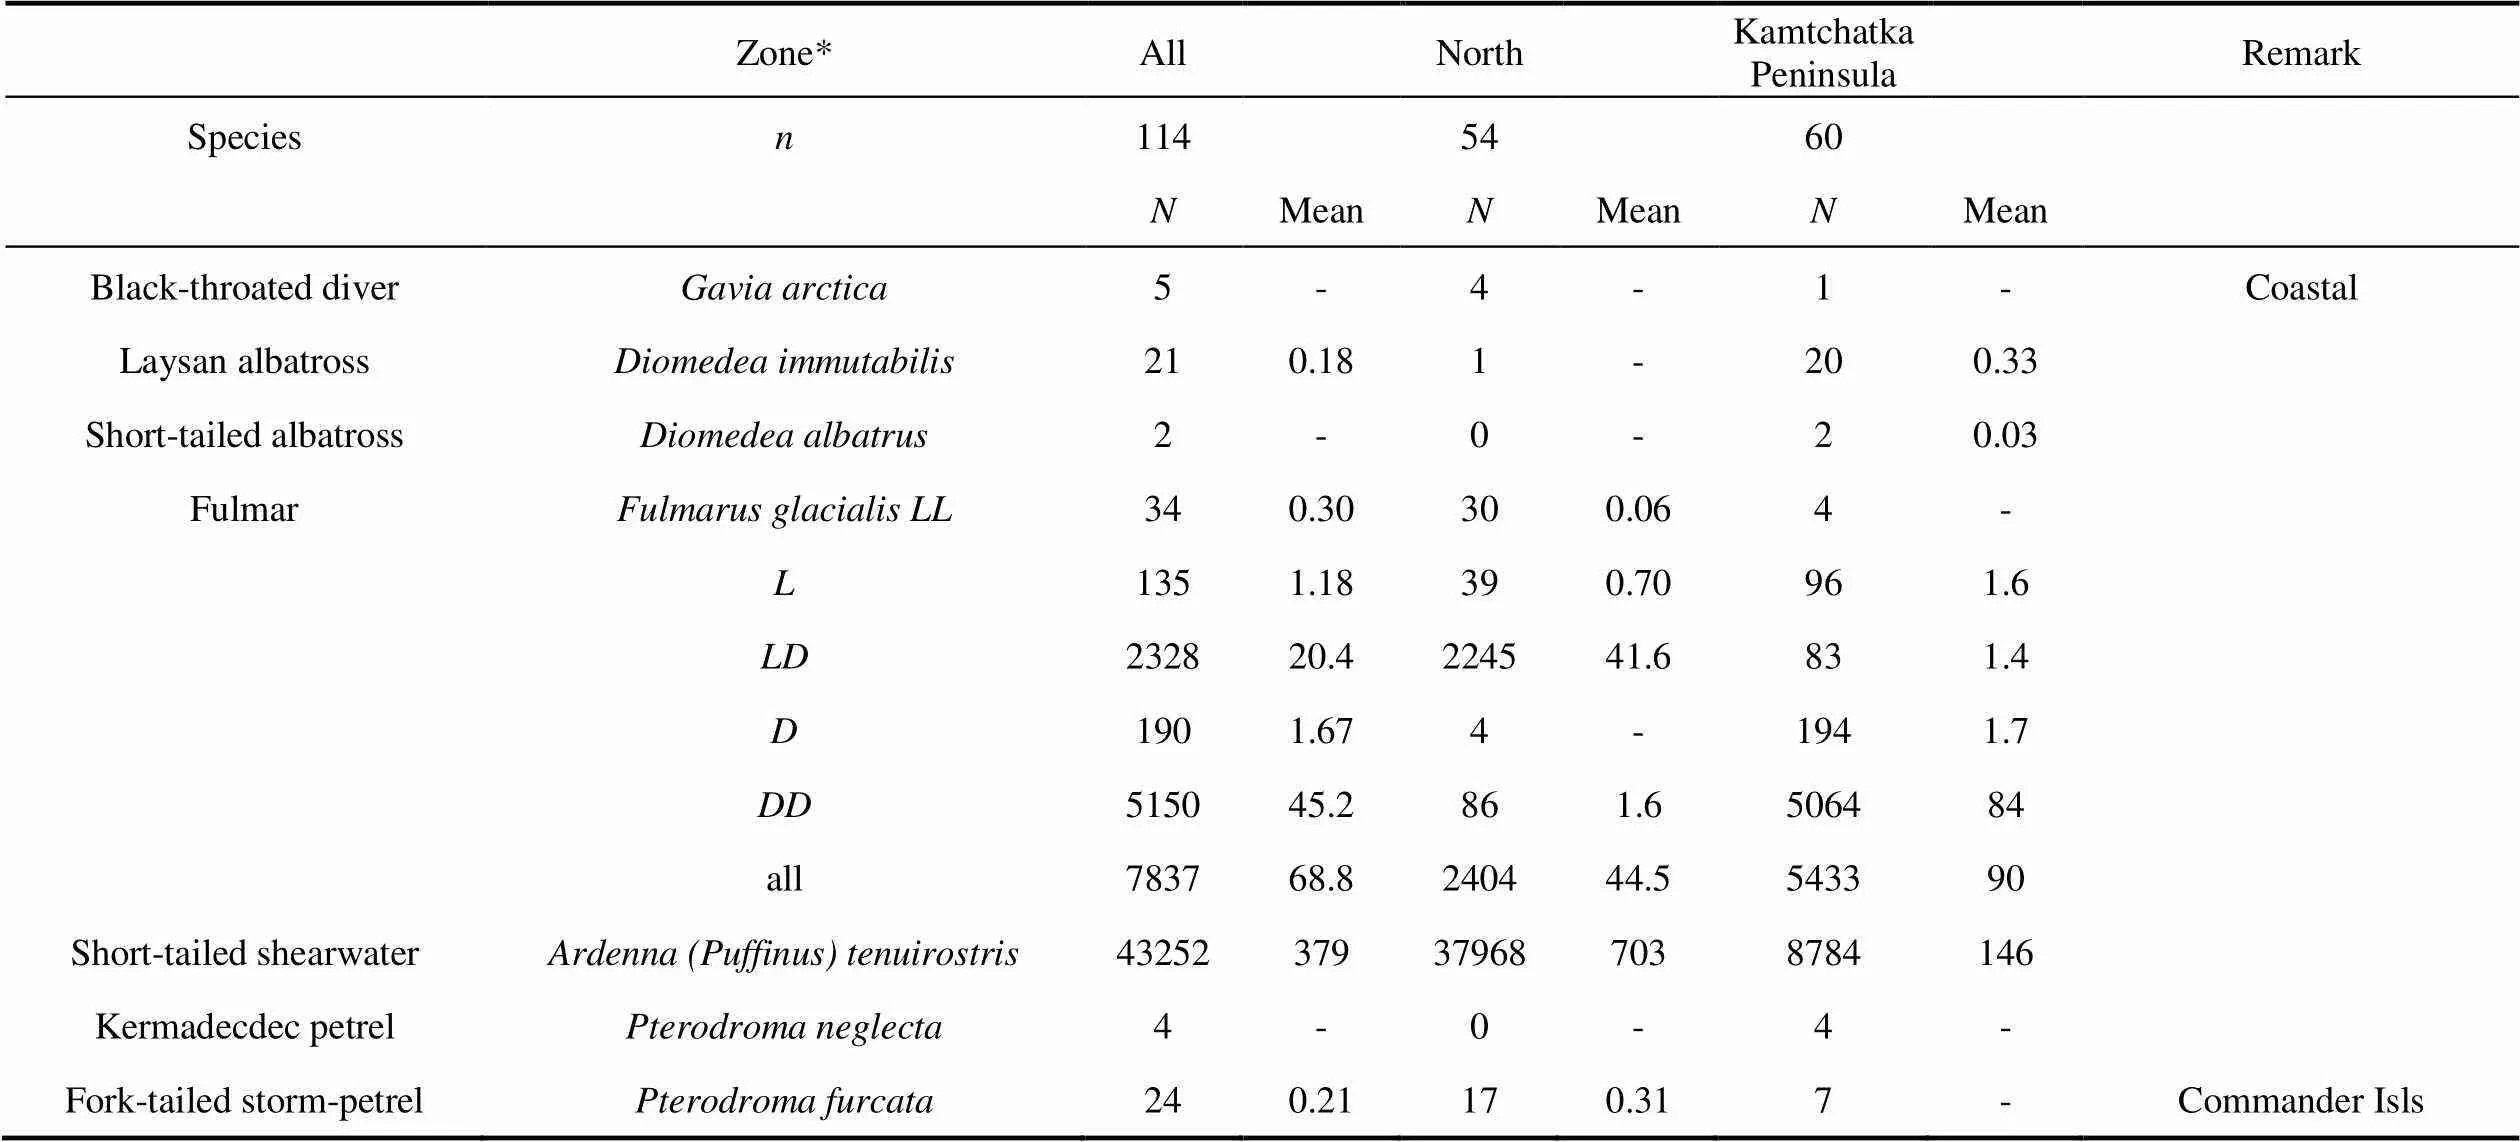
Table 1 Seabirds and marine mammals tallied in the West Bering Sea and Kamtchatka Peninsula, in September 2018
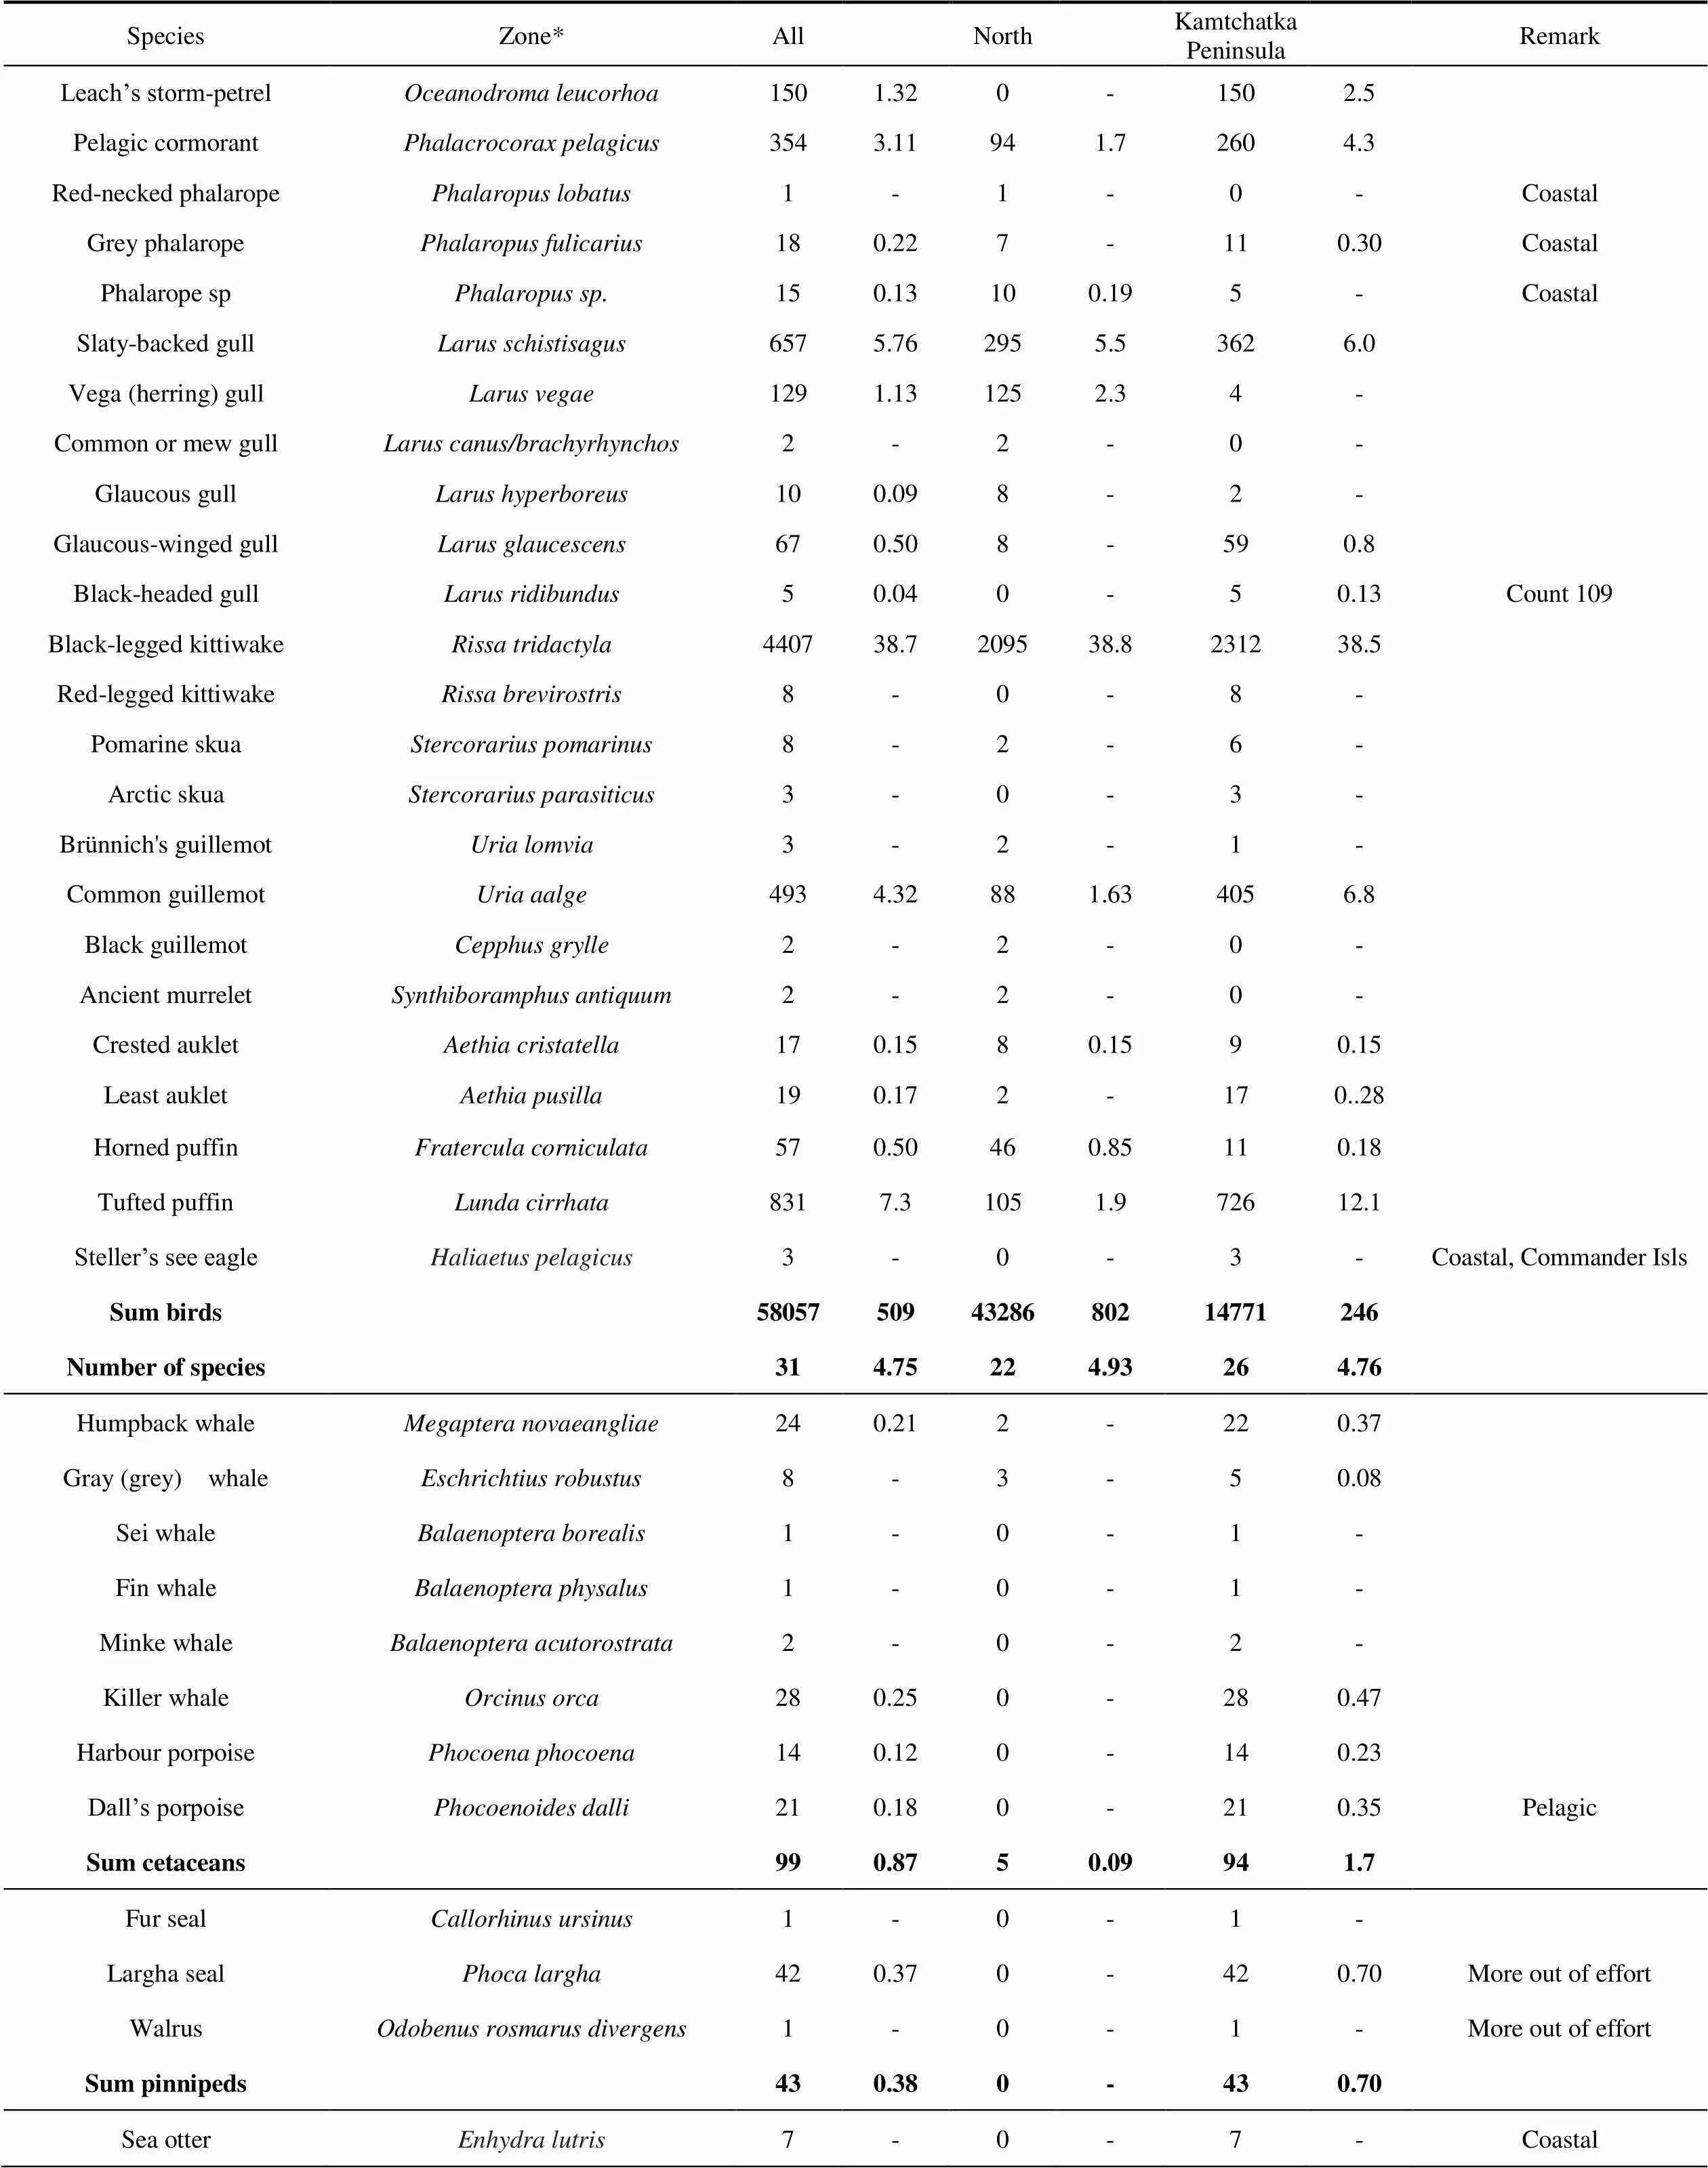
Continued
Notes: (1) n = number of counts; N = total number of individuals; mean per count; see Figure 1. (2) *, North of 60°N; Kamtchatka, South of 60°N.
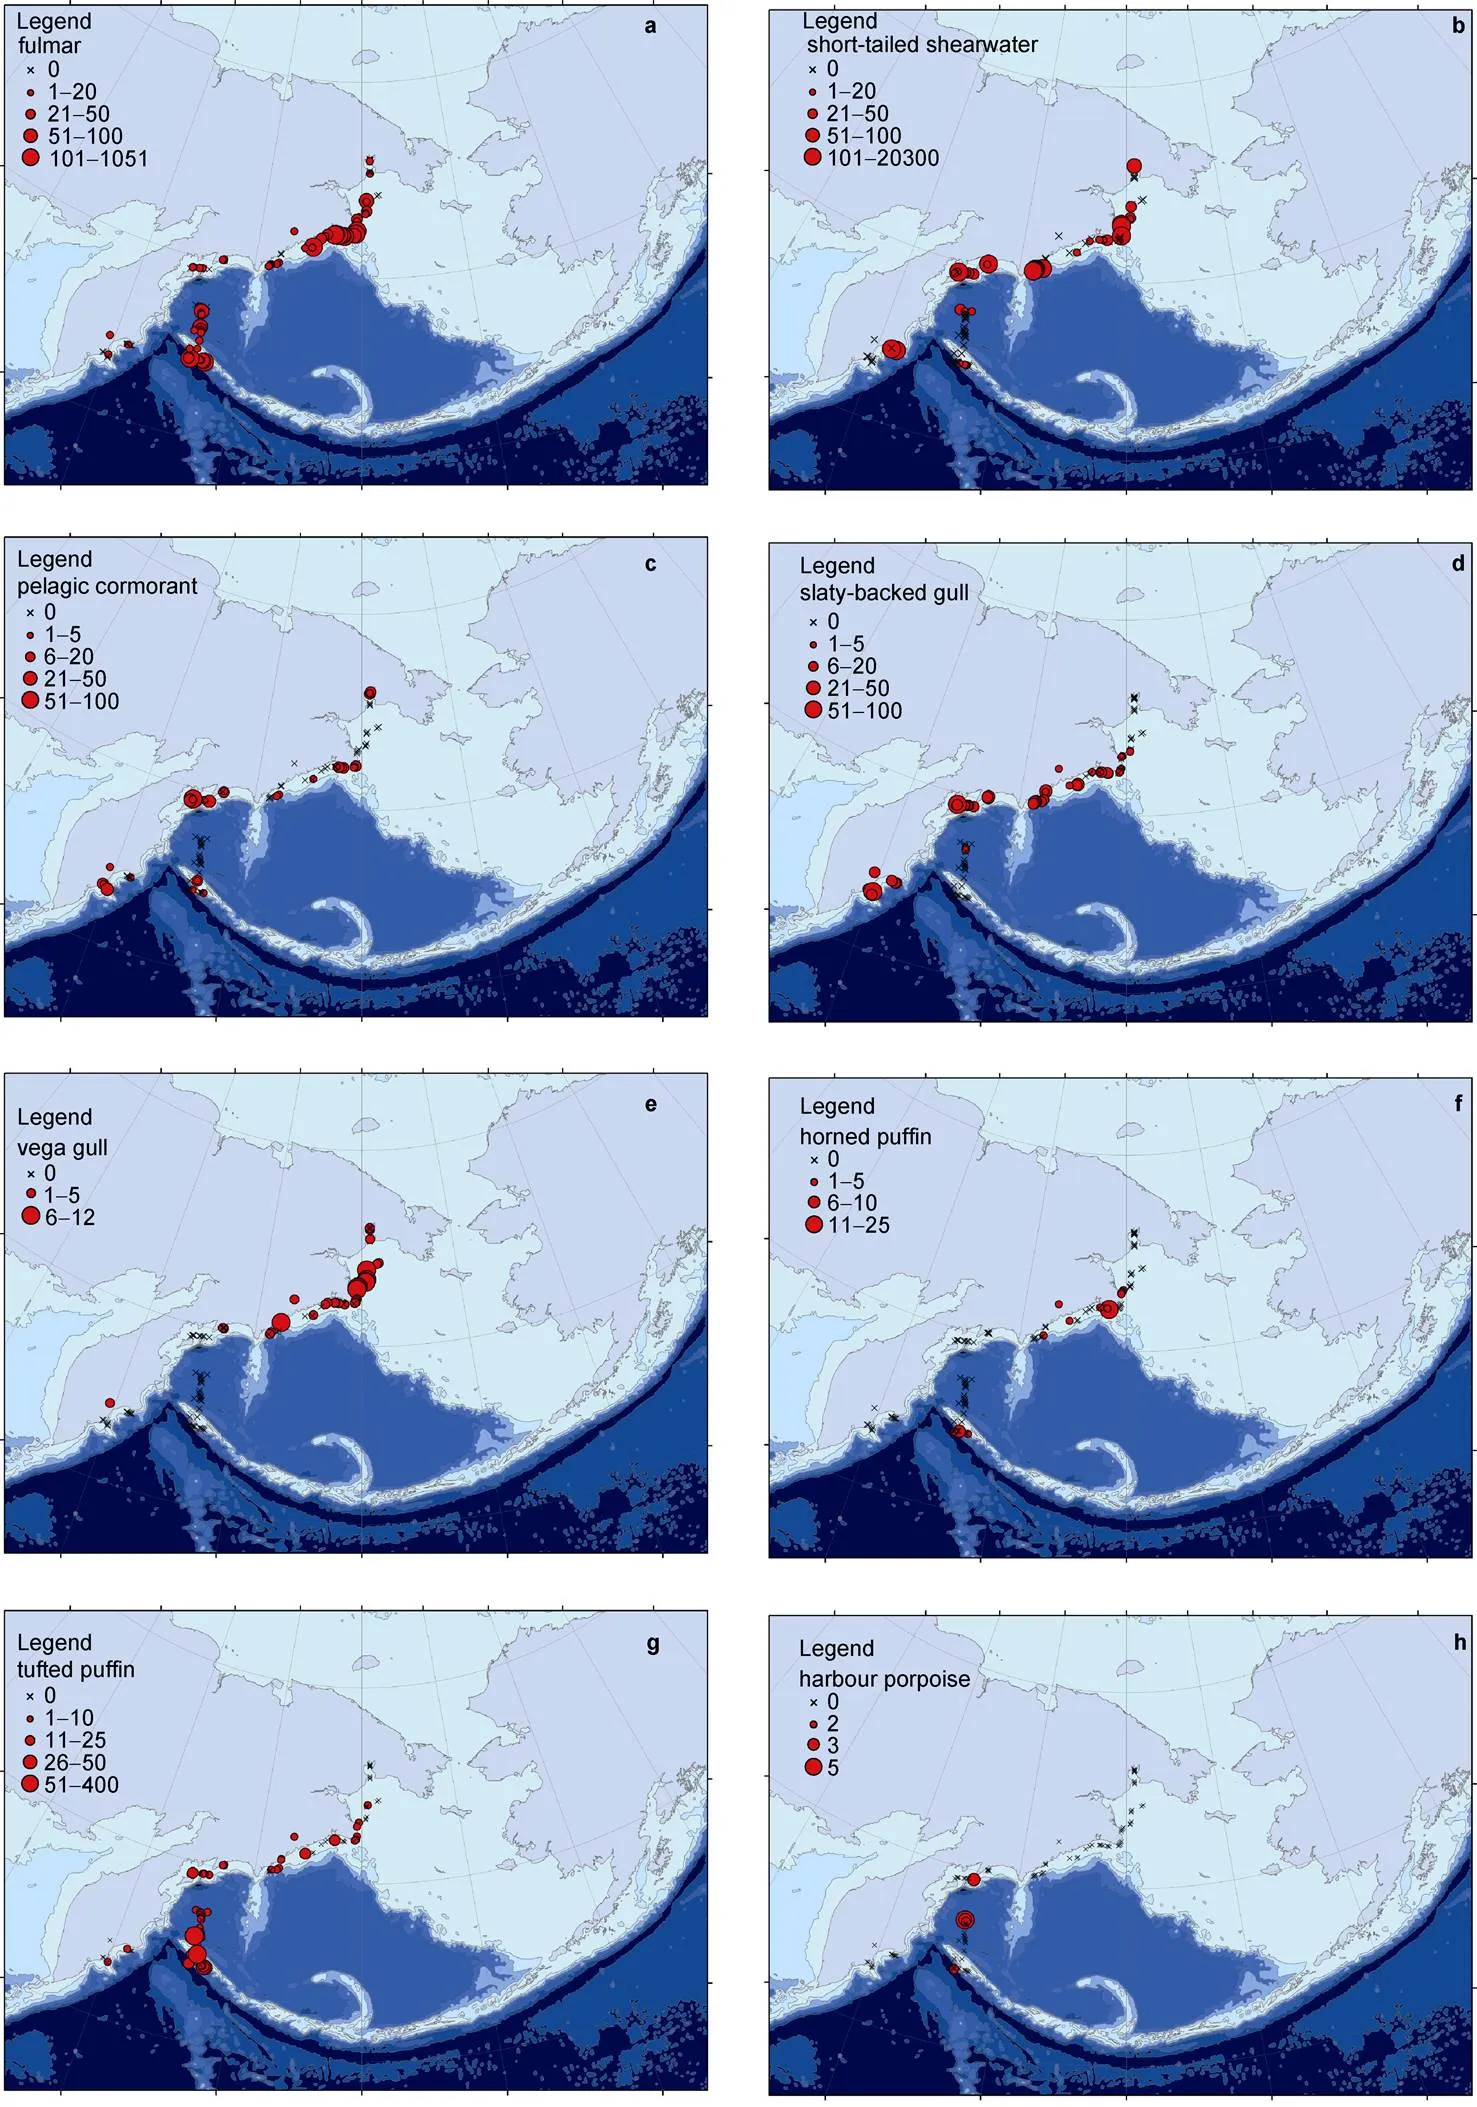
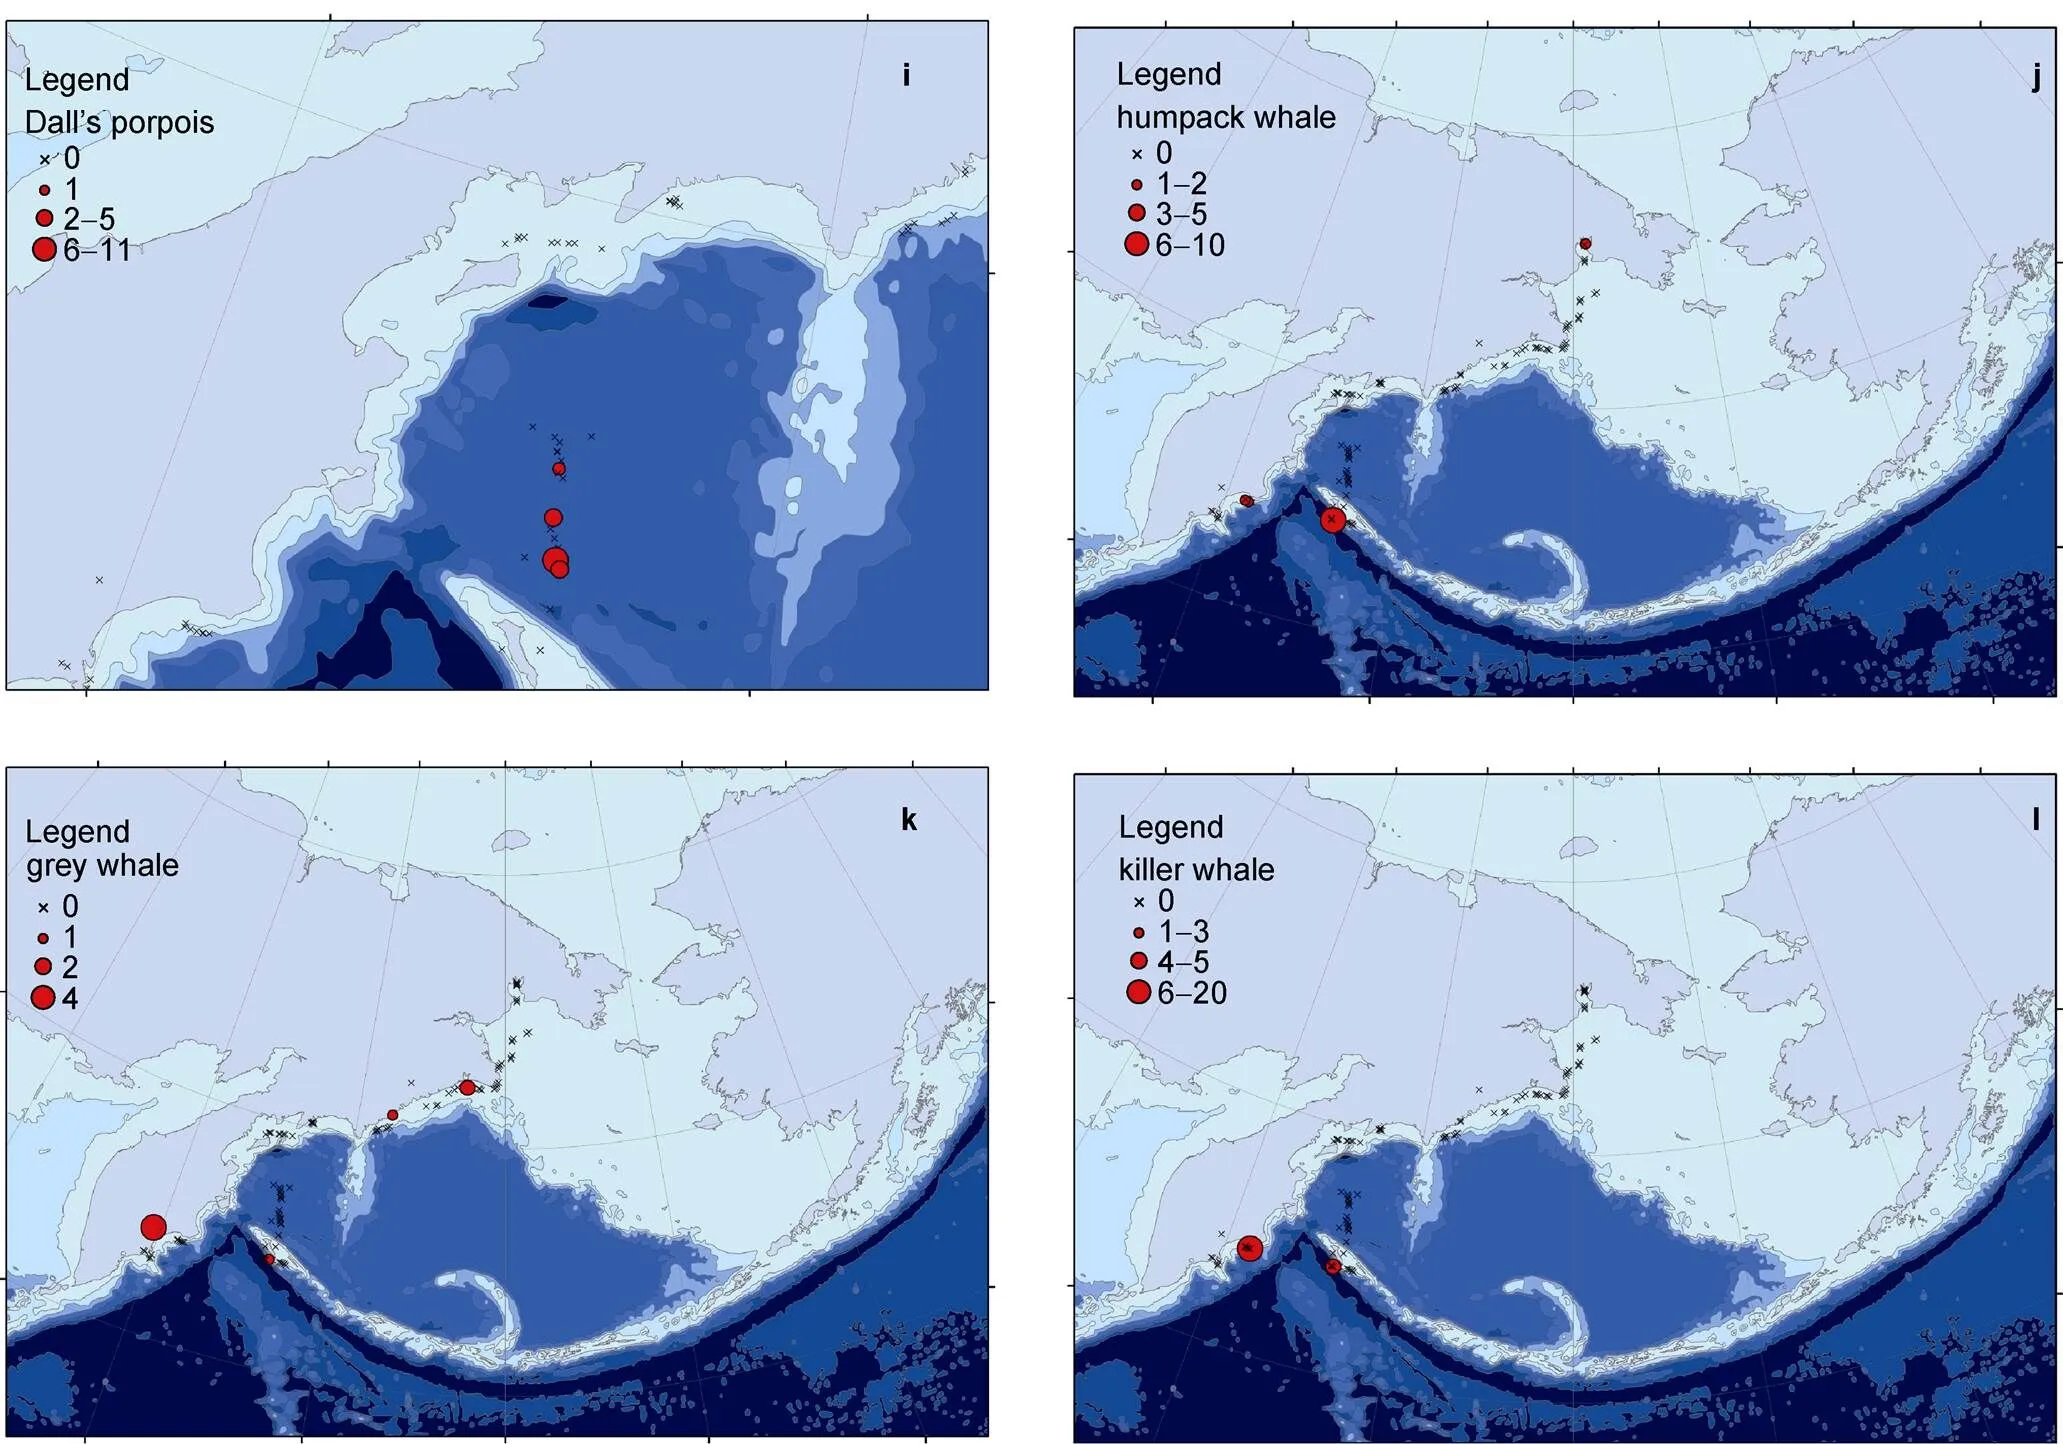
Figure 2 Data collected during the Bering Sea and Kamtchatka expedition, in September 2018, selected species; numbers per 30 min transect count. a, Fulmar; b, Short-tailed shearwater; c, Pelagic cormorant; d, Slaty-backed gull; e, Vega gull; f, Horned puffin; g, Tufted puffin ; h, Harbour porpoise; i, Dall’s porpoise; j, Humpback whale ; k, Grey whale; l, Killer whale.
Important geographical differences were noted. Total seabird abundance was very different: 43300 individuals in the North (mean of 800 per count) and 14770 in the South (245 per count). The number of species was 22 and 26 for a total of 31; mean number of species per count was similar: 4.9 and 4.8 respectively. The same three main species represented 88%, 6% and 5% respectively in the North, 59%, 37% and 0.2% respectively in the South. A similar difference was noted among the colour morphs of fulmar, light ones being the most abundant in zone North (LL and LD: 30 and 42 per count) and dark ones in zone South (DD: 84 per count). Among the most abundant species, black-legged kittiwake and slaty-backed gullbasically did not show significant differences between North and South. Many other species did. Were mainly present in the northern zone: Vega (herring) gulland horned puffin. In the southern zone: Laysan albatross, pelagic cormorant, glaucous gulland glaucous-winged gullred-legged kittiwakeand black guillemot. A selection of species distribution is shown in Figure 2, based both on the species abundance and the existence of clear geographical differences.
Other coastal “marine” species were one and two gadwallsat counts 51 and 52, three and one female eiders, (counts 51 and 55), one male common scooter(count 26), seven (six females, one male) harlequins(count 107), and one male smew(count 111).
The vast majority of cetaceans and pinnipeds were tallied in the southern area. The main cetacean species were humpback whalekiller whaleand porpoisesand. The Largha (spotted) sealdistribution was as expected in autumn very coastal, far from sea ice (Iverson et al, 1979; Lowry et al., 2000) Around 25 belugasand 50 Largha seals were encountered in the harbour of Anadyr, out of effort. The photo of a humpback fluke on 12 September allowed photo-identification of an individual already tallied in Jalico (Mexico) on 3 March 2017 (Happywhale).
I did not encounter any North Pacific right whaleknown to be present in the area in extremely low numbers, with a world population evaluated around 100–200 individuals (Ovysyanikova et al., 2015), or 1000 for the western population, mainly south of Kamtchatka and Okhotsk Sea (Hakamada and Matsuoka, 2016) after very heavy whaling. During many trips following the same route, S. Blanc and A. Brenière spotted one exemplar only in June 2013, an opportunistic observation (Figure 3).
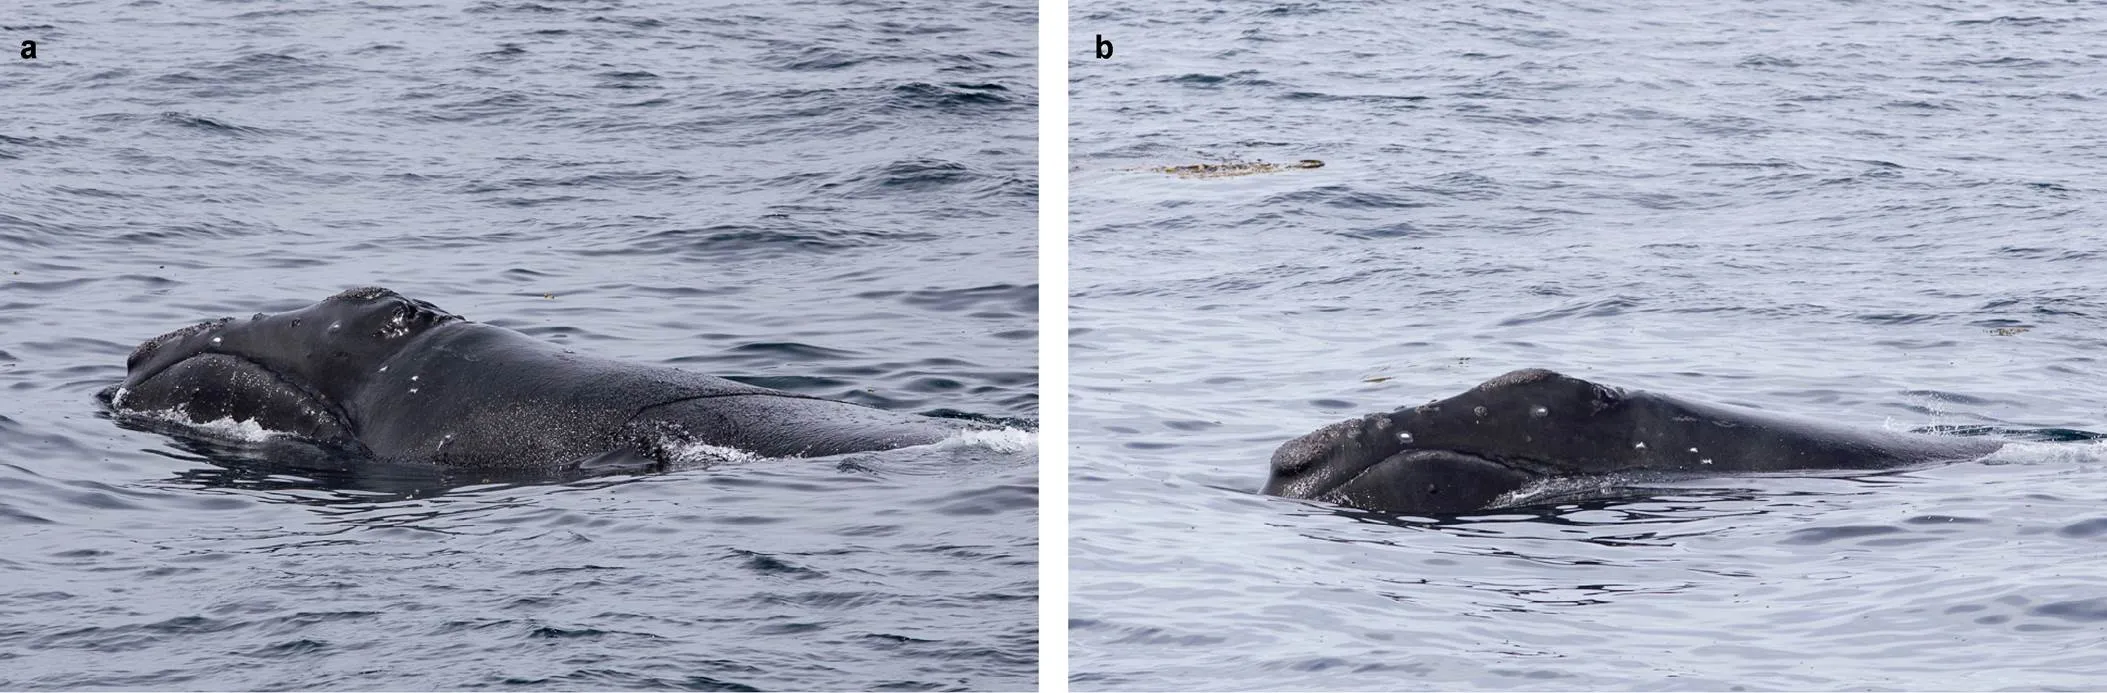
Figure 3 North Pacific right whale, on 19 June 2013. Photos: S. Blanc, Heritage Expeditions, New Zealand.
4 Discussion and conclusion
This article concerns a complement and a confirmation of data collected in Bering Strait and the North-East Passage, a poorly studied area. Data of the northern zone coincide with the ones in the adjacent Bering Strait and Chukchi Sea both in species composition and abundance of the most numerous species, especially short-tailed shearwater (Joiris, 2020a).
As expected (see “Introduction”), top predators abundance was very high, especially for seabirds in the northern area, and for cetaceans and seals in the southern area. These data are among the highest ones registered by this team in Arctic seas, namely 800 seabird individuals per count in zone North and 250 in zone South. They can be compared with the Chukchi Sea and Bering Strait (180 per count), followed by the Norwegian Sea (65 per count, actually much more in the coastal Norwegian Current, the Barents Sea (55 per count) or the East Siberian, Laptev and Kara seas (25 to 40 per count). In contrast, lowest values were tallied in the deep Arctic Basin (0.3 per count) and in the Wandel Sea North of Greenland (2.1 per count) (Joiris et al., 1996, 2016; Joiris, 2019, 2020a; Joiris and D’Hert, 2020).
The importance of hotspots is stressed once more: shearwaters were present by thousands at some counts, up to 20000 in count 44 (Figures 2 and 4), 10000 in count 465000 in counts 22 and 102, 3500 in count 107, all actively feeding. They also were abundant in Bering Strait and Chukchi Sea, to a lower extension (Joiris, 2020a). The hotspot of count 22 concerned other species as well, attracted by the old carcass of a dead whale: 560 kittiwakes, 200 LD fulmars (Figure 5). Such hotspots correspond to many previous observations, mainly in polar seas (Springer et al., 1996; Joiris and Falck, 2010; Santora et al., 2010; Joiris et al., 2014, 2015; Joiris, 2017a, 2017b, 2018a, 2018b; Joiris and Humphries, 2018) and confirm the difficulty of expressing data as mean values since their distribution is far from normal. Considering that the distribution of predators basically reflects prey abundance, such hotspots must correspond to high biological production. These are generally bound to hydrographic features such as upwelling fronts, mainly at the slope of the continental shelf, leading to high primary production and as a consequence high predators’ abundance. The importance of such fronts was described already in the south-eastern Bering Sea “Green Belt” (Iverson et al., 1979; Lowry et al., 2000). In this post-breeding period, dispersion and movements/migration, probably limit the importance of breeding colonies influencing the distribution of seabirds.
The importance of followers remains difficult to evaluate, especially in areas were other ships are very rare—in this study, we did not meet any ship before the last day. In areas with many ships, on the contrary, they disperse and thus do not appear as such. Long-distance followers are mainly found among tubenoses—albatrosses and fulmars—and kittiwakes. For example: Laysan albatrosses were tallied nine times from count 66 to 75 with a peak between counts 68 and 71: two individuals in four successive counts and five times one individual. They can thus be considered as followers and the total of 21 tallied individuals might actually concern two individuals only: the over-estimation might be up to one order of magnitude.
Acknowledgements D. D’Hert (PolE) kindly prepared the distribution maps; two anonymous reviewers and J. M. Valette helped improve the manuscript.

Figure 4 Short-tailed shearwater; parts of the hotspot of 20000 individuals actively feeding, count 44, on 8 September 2018. Photos: CJ.
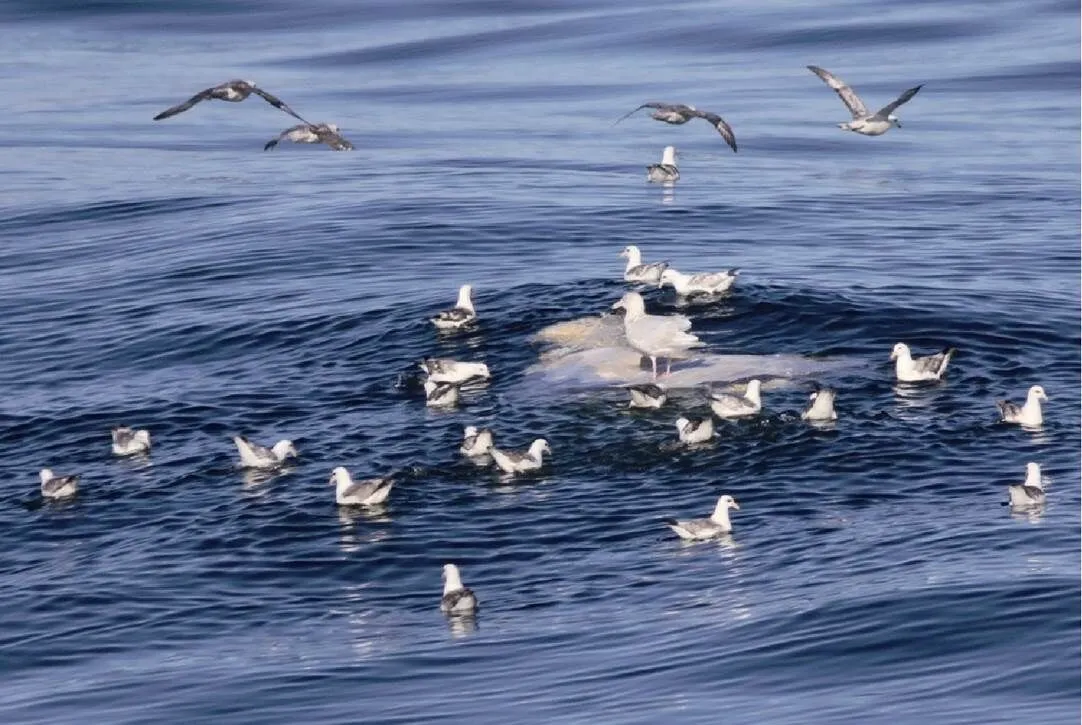
Figure 5 Fulmars and glaucous-winged gulls on the old carcass of a whale, count 22, on 5 September 2018. Photo: CJ.
Artyukhin Yu B, Burkanov N V.1999. Seabirds and mammals of the Russian Far East, 214 (in Russian).
Hakamada T, Matsuoka K. 2016. The number of blue, fin, humpback, North Pacific right whales in the western North Pacific in the JARPN II offshore survey area. Paper presented at the SC/F16/JR13 to the IWC SC JARPNII Review Workshop, Tokyo.
Iverson R L, Coachman L K, Cooney R T, et al. 1979. Ecological significance of fronts in the south-eastern Bering Sea//Livingston R J. Ecological processes in coastal and marine systems. Boston, MA: Springer US, 437-466, doi: 10.1007/978-1-4615-9146-7_19.
Joiris C R. 2017a. Hotspots in the distribution of the top predators— seabirds, cetaceans and pinnipeds—in polar marine ecosystems//van de Putte A. XIIth SCAR Biology Symposium. Leuven, Belgium, 10–14 July 2017. Scientific Committee on Antarctic Research (SCAR), Cambridge, United Kingdom, 129.
Joiris C R. 2017b. Seabird hotspots on icebergs in the Amundsen Sea, Antarctica. Polar Biol, 41(1): 111-114, doi: 10.1007/s00300-017- 2174-4.
Joiris C R. 2018a. Seabird and marine mammal “hotspots” in polar seas. Düsseldorf: Lambert Academic Publishing, 48.
Joiris C R. 2018b. Hotspots of kittiwakeson icebergs off southwest Greenland in autumn. Polar Biol, 41(11): 2375-2378, doi: 10.1007/s00300-018-2356-8.
Joiris C R. 2019. Very low biodiversity of top predators—seabirds and marine mammals—in the high Arctic Ocean. Adv Polar Sci, 30(4): 375-381, doi: 10.13679/j.advps.2019.0022.
Joiris C R. 2020a. Bird and mammal at-sea distribution along the North-East Passage off Siberia. J Mar Sci Res Oceanogr, 3(3): 64-71, doi: 10.33140/jmsro.03.03.03.
Joiris C R. 2020b. Low abundance and biodiversity of top predators— seabirds and marine mammals—in high Arctic seas. J Mar Sci Res Oceanogr, 3(3): 89-99, doi: 10.33140/jmsro.03.03.06.
Joiris C R, Boos K, D’Hert D, Nachtsheim D A. 2016. Low density of top predators (seabirds and marine mammals) in the high Arctic pack ice. Scientifica (Marine Biology), 2016: 1982534, doi: 10.1155/2016/ 1982534.
Joiris C R, D’Hert D. 2020. Seabird and marine mammal at-sea distribution in the Norwegian, Greenland and Wandel seas, 2018. J Mar Sci Res Oceanogr, 3(4): 129-134, doi: 10.33140/jmsro.03.04.03.
Joiris C R, Falck E. 2010. Summer at-sea distribution of little auksand harp sealsin the Fram Strait and the Greenland Sea: impact of small-scale hydrological events. Polar Biol, 34(4): 541-548, doi: 10.1007/s00300-010- 0910-0.
Joiris C R, Humphries G R W. 2018. Hotspots of seabirds and marine mammals between New Zealand and the Ross Gyre: importance of hydrographic features. Adv Polar Sci, 29(4): 254-261, doi: 10.13679/j. advps.2018.4.00254.
Joiris C R, Falck E, D’Hert D, et al. 2014. An important late summer aggregation of fin whales Balaenoptera physalus, little auksand Brünnich’s guillemotsin the eastern Greenland Sea and Fram Strait: influence of hydrographic structures. Polar Biol, 37(11): 1645-1657, doi: 10.1007/s00300- 014-1551-5.
Joiris C R, Humphries G R W, D’HertD, et al. 2015. Major hotspots detected along the Scotia Ridge in autumn for southern right whales, Antarctic fur sealsand Antarctic prions. Adv Polar Sci, 26(4): 282-291, doi: 10.13679/j.advps.2015.4.00282.
Joiris C R, Tahon J, Holsbeek L, et al. 1996. Seabirds and marine mammals in the eastern Barents Sea: late summer at-sea distribution and calculated food intake. Polar Biol, 16(4): 245-256, doi: 10.1007/s003000050051.
Lee O, Fuglestad J L, Thorsteinson L. 2020. Ecosystems in the Bering Strait Region//Young O, Berkman P, Vylegzhanin A. Governing Arctic seas: regional lessons from the Bering Strait and Barents sea. Informed decision making for sustainability. Cham: Springer, 25-46, doi: 10.1007/978-3-030-25674-6_2.
Lowry L F, Burkanov V N, Frost K J, et al. 2000. Habitat use and habitat selection by spotted seals (in the Bering Sea. Can J Zool, 78(11): 1959-1971, doi: 10.1139/cjz-78-11-1959.
Mokievsky V O, Zetlin A B, Sergienko L A, et al. 2016. Marine mammals of the Russian Arctic and Far East seas. Moscow: Arctic Sci Center, 271.
Ovsyanikova E, Fedutin I, Belonovich O A, et al. 2015. Opportunistic sightings of the endangered North Pacific right whales () in Russian waters in 2003–2014. Mar Mammal Sci, 31(4): 1559-1567, doi: 10.1111/mms.12243.
Piatt J F, Springer A M. 2003. Advection, pelagic food webs and the biogeography of seabirds in Beringia. Mar Ornithol, 31(2): 141-154.
Santora J A, Reiss C S, Loeb V J, et al. 2010. Spatial association between hotspots of baleen whales and demographic patterns of Antarctic krillsuggests size-dependent predation. Mar Ecol Prog Ser, 405: 255-269, doi: 10.3354/meps 08513.
Springer A M, McRoy C P, Flint M V. 1996. The Bering Sea Green Belt: shelf-edge processes and ecosystem production. Fish Oceanogr, 5(3-4): 205-223, doi: 10.1111/j.1365-2419.1996.tb00118.x.
23 Novermber 2020;
8 March 2021;
30 March 2021
, E-mail:crjoiris@gmail.com
10.13679/j.advps.2020.0035
: Joiris C R. Seabird and marine mammal at-sea distribution in the western Bering Sea and along the eastern Kamtchatka Peninsula. Adv Polar Sci, 2021, 32(1): 42-49,
10.13679/j.advps.2020.0035
杂志排行
Advances in Polar Science的其它文章
- Information for authors
- Editorial Note
- Assessment on India’s involvement and capacity-building in Arctic Science
- Complete genome analysis of bacteriochlorophyll a-containing Roseicitreum antarcticum ZS2-28T reveals its adaptation to Antarctic intertidal environment
- Leveraging the UAV to support Chinese Antarctic expeditions: a new perspective
- Biomarker records of D5-6 columns in the eastern Antarctic Peninsula waters: responses of planktonic communities and bio-pump structures to sea ice global warming in the past centenary