Biomarker records of D5-6 columns in the eastern Antarctic Peninsula waters: responses of planktonic communities and bio-pump structures to sea ice global warming in the past centenary
2021-04-09YANGDanZHANGHaishengHANZhengbingHANXibinZHANGYichengCHENWenshengLIUQianPANJianmingFANGaojingLEFengfengLUBingHUANGJing
YANG Dan, ZHANG Haisheng, HAN Zhengbing, HAN Xibin, ZHANG Yicheng, CHEN Wensheng, LIU Qian, PAN Jianming, FAN Gaojing, LEFengfeng, LU Bing & HUANG Jing
•Article •
Biomarker records of D5-6 columns in the eastern Antarctic Peninsula waters: responses of planktonic communities and bio-pump structures to sea ice global warming in the past centenary
YANG Dan, ZHANG Haisheng, HAN Zhengbing, HAN Xibin, ZHANG Yicheng, CHEN Wensheng, LIU Qian, PAN Jianming, FAN Gaojing, LEFengfeng, LU Bing& HUANG Jing
Key Laboratory of Marine Ecosystem and Biogeochemistry, Second Institute of Oceanography, Ministry of Natural Resources, Hangzhou 310012, China;Key Laboratory of Submarine Geosciences, Second Institute of Oceanography, Ministry of Natural Resources, Hangzhou 310012, China;Zhuhai Central Station of Marine Environmental Monitoring, State Oceanic Administration, Zhuhai 519015, China;Polar Research Institute of China, Shanghai 200136, China
Molecular biomarkers (e.g., isoprenoid glycerol dialkyl glycerol tetraethers (iGDGTs) and proxies, such as di-unsaturated to tri-unsaturated highly branched isoprenoids (D/T) ratio, total organic carbon, δC and ice-rafted debris (IRD)) were used to reconstruct the dominant phytoplankton (diatoms, dinoflagellates and coccolithophores), phytoplankton and zooplankton productivity, biological pump structure, and archaea assemblage (Euryarchaeota and Crenarchaeota) from a marine sediment core (D5-6) dated withPb (1922–2012). We characterized the environmental response to sea ice variations/global warming off the eastern Antarctic Peninsula.The results showed that (1) the biomarkers brassicasterol (average = 519.79 ng·g), dinosterol (average = 129.68 ng·g) and Calkenones (average = 40.53 ng·g) reconstructed phytoplankton (average = 690.00 ng·g) and zooplankton (cholesterol average = 669.25 ng·g) productivity. The relative contribution to productivity by different phytoplankton groups was diatoms > dinoflagellates >coccolithophores.This is consistent with field surveys showing that diatoms dominate the phytoplankton in waters adjacent to the Antarctic Peninsula. (2) The relative abundances of different highly branched isoprenoids reflected the contributions of sea ice algae and open water phytoplankton (D/T = 1.2–30.15).Phytoplankton productivity and sea ice showed a good linear relationship with a negative correlation, indicating that more open water during periods of warming and reduced sea ice cover led to an enhanced biological pump. (3) Over the past 100 years, phytoplankton productivity and zooplankton biomass increased.This trend was particularly evident in the last 50 years, corresponding to increased global warming, and showed a negative correlation with IRD and D/T.This suggests that with decreasing sea ice coverage in a warming climate, diatom biomass greatly increased. Coccolithophore/diatom values and the ratio of Calkenones to total phytoplankton productivity decreased, indicating the proportion of coccolithophores in the phytoplankton community decreased. The reduction in coccolithophores changes the phytoplankton assemblage and affects the overall efficiency of the biological pump and carbon storage. (4) The results also showed that the abundance of iGDGTs and archaea phyla (Euryarchaeota and Crenarchaeota) showed consistent changes over the past 100 years in response to global warming.Since 1972, trends in archaea, phytoplankton and zooplankton showed variations but a consistent decline.Whether their response to the changing climate off the Antarctic Peninsula involves interactions and influence among different marine biological groups remains an open question.As a result of global warming and reductions in Antarctic sea ice, the relative effectiveness of the Antarctic biological pump can significantly affect global ocean carbon storage.
global warming, phytoplankton productivity, zooplankton productivity, archaea, iGDGTs, sea ice proxy, D/T, eastern Antarctic Peninsula
1 Introduction
Polar seas are an important sink in the global carbon cycle. With global warming, the structure and efficiency of the biological pump (BP) in polar seas have an important impact on the global carbon cycle. The marine BP is divided into an organic carbon pump and carbonate pump (Riebesell et al., 2000). While non-calcareous phytoplankton, such as diatoms and dinoflagellates, and larger algae sequester carbon in the ocean surface through photosynthesis and then through export production that transports organic material to the deep ocean (organic carbon pump), calcifying phytoplankton, such as coccolithophores and foraminifera, directly absorb the bicarbonate in seawater to form calcium carbonate; they transport carbon to the deep sea and release COto the surface of the ocean (carbonate pump) (Holligan et al., 1993). The relative strength of these two pumps largely determines the influence of the sea–air exchange of CO, which is regulated by the BP and affected by phytoplankton community structure (Riebesell et al., 2001; Rost and Riebesell, 2004). These two pumps ultimately determine the proportion of organic and inorganic carbon transported to marine sediments (Werne et al., 2000). Different phytoplankton community compositions can directly affect the carbon cycle and energy flow in the Southern Ocean.
The fundamental mechanism by which carbon is transported from surface water to the deep ocean through the BP is biological sequestration. Sequestration of carbon from the atmosphere into marine sediment occurs in a series of biological processes with about 3.7 × 10billion tons of organic carbon stored in marine sediments. Within the BP, phytoplankton primary production determines the intensity of COfixation by photosynthesis (Chen, 2004). The Antarctic Peninsula region is warming significantly faster than the global average. Satellite data have shown that sea ice around the Antarctic Peninsula froze later and thawed earlier, and that seasonal variations in sea ice extent have increased (Vaughan et al., 2003; Turner et al., 2005). The melting of sea ice affects phytoplankton biomass and can alter phytoplankton assemblage dominance from diatoms to cryptophytes (Moline et al., 2004; Montes-Hugo et al., 2008), as well as reduce production of Antarctic krill () (Schloss et al., 2012). The sensitivity of the Antarctic Peninsula marine ecosystem and its response to rapid changes in sea ice and global warming, as well as its impact on the BP, have been the focus of many studies (Smith et al., 2011; Ducklow et al., 2015).
In the Southern Ocean, phytoplankton community and BP research have mainly focused on structure and efficiency as key problems, but accurate information regarding changes to these requires long sequences of continuous data to identify spatial and temporal patterns. However, there is a shortage of related historical material from the Antarctic, especially information on zooplankton and phytoplankton productivity, sea ice algae, microorganisms (e.g., archaea) and synchronous observations of sea ice changes.
It is currently an important part of global change research to actively acquire and verify new environmental proxy indicators. There are some sedimentary proxies for climate change that have well-defined sources including many molecular biomarkers, such as ones for diatoms (brassicasterol), dinoflagellates (dinosterol), coccolithophores (Calkenones), zooplankton productivity (cholesterol), ice algae (di-unsaturated highly branched isoprenoids, HBI II), open water phytoplankton (tri-unsaturated highly branched isoprenoids, HBI III), a sea ice index (HBI II/HBI III) and archaea (glycerol dialkyl glycerol tetraethers, GDGTs), specifically the moieties GDGT-0 for Euryarchaeota and crenarchaeol for Crenarchaeota. By using biomarker contents and compound ratios in marine sediment cores and analyzing the relationship between them and climate control factors, information about the evolution of marine communities, the surrounding environment and historical climate change can be retrieved. These techniques have been successfully applied in polar regions (Calvo et al., 2004; Hernandez et al., 2008; Denis et al., 2010; Massé et al., 2011; Collins et al., 2013; Etoureau et al., 2013).
In this study, a marine sediment core (D5-6), recovered from the eastern Antarctic Peninsula and dated usingPb, was studied using primarily biomarker contents and ratios. These data were combined with synchronous records of ice-rafted debris (IRD), total organic carbon (TOC) and δC to characterize the response of zooplankton (Antarctic krill) and phytoplankton to sea ice change and global warming in the eastern Antarctic Peninsula. The results were used to describe Antarctic climate–sea ice–ocean– biological community interactions and changes more clearly. Thus, this study investigated the response of a regional ecosystem (Antarctic Peninsula) to global warming over the past ~100 years.It is scientifically significant to reveal the interactions between the polar ecosystem and climate change and also to provide data for subsequent research.
2 Materials and methods
2.1 Sample collection
The Antarctic Peninsula is an important marginal region of Antarctica and the seas surrounding it (e.g., Weddell Sea) are a key area for primary production in the Southern Ocean; thus, it is an ideal area to study the BP and its changing trends in the Southern Ocean. Station D5-6 is located at 44°40.709′W, 62°47.878′S (Figure 1) between the Scotia and Weddell seas and across the South Orkney platform off the eastern Antarctic Peninsula; the water depth is 385 m. The surface current is mainly in the northwest direction, and the current velocity flowing west is about 0.21 m·s. Material was collected during the 28th Chinese National Antarctic Research Expedition in 2011/2012, and a sediment core was recovered with a box sampler (column length = 17 cm). The sediments were mostly grayish silty clay. The core was sampled at one centimeter intervals in the laboratory for the determination ofPb, grain size parameters, IRD content and biomarker composition.
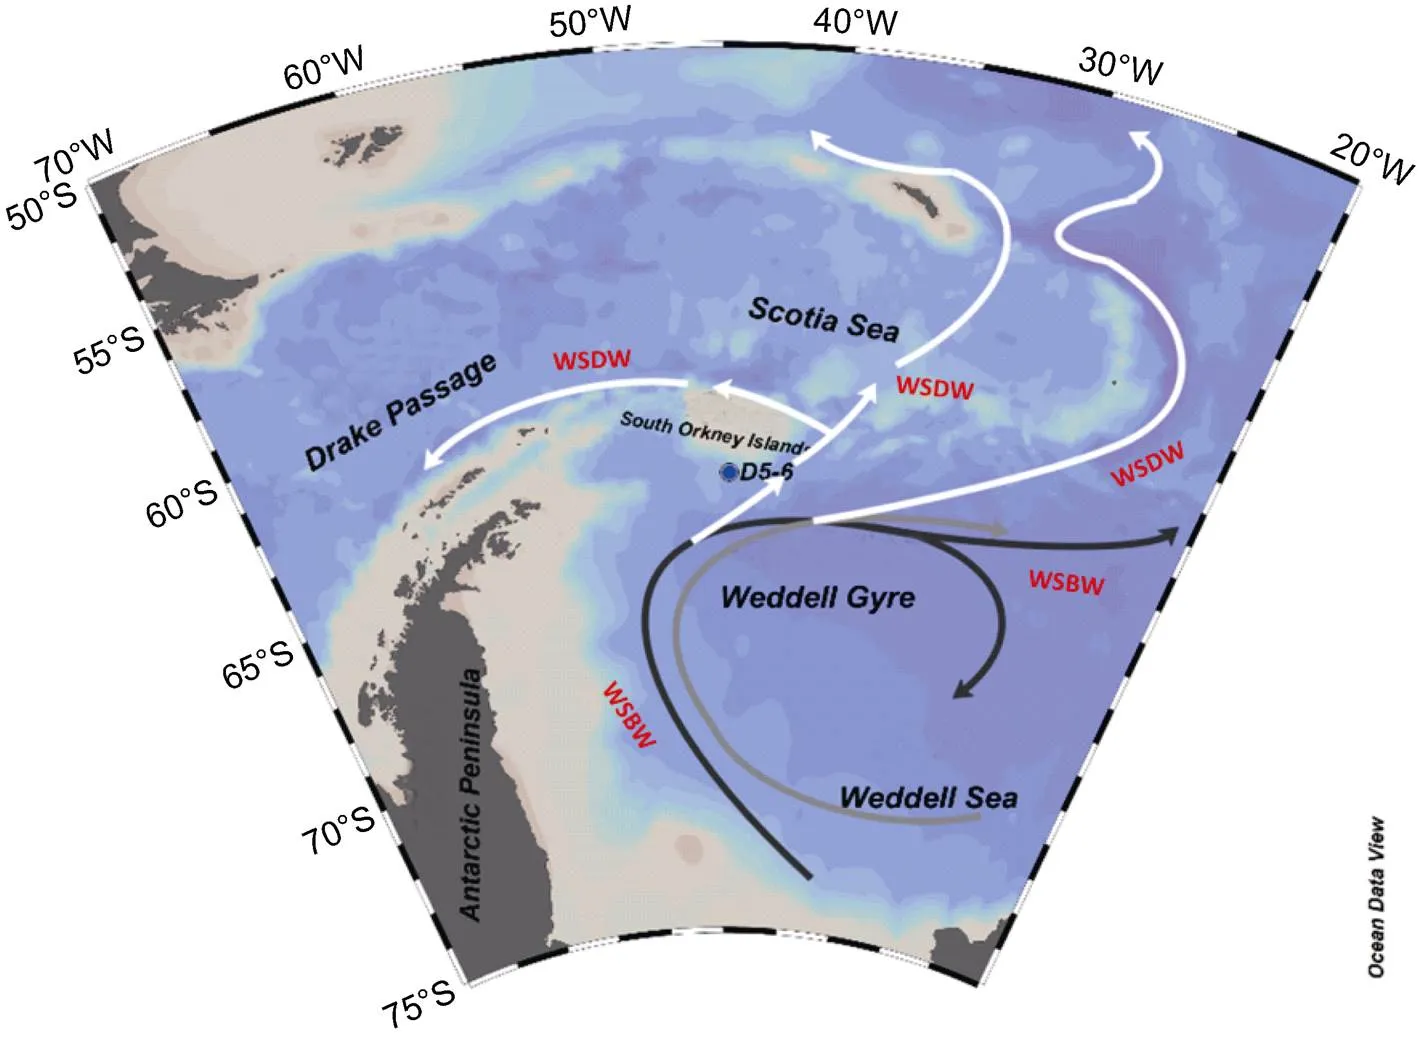
Figure 1 Map showing the general circulation and sampling station D5-6 off the eastern Antarctic Peninsula (modified from Hernández-Molina et al., 2006).WSBW: Weddell Sea Bottom Water, WSDW: Weddell Sea Deep Water.
2.2 Sample analyses
2.2.1Pb dating
Sediment samples (10 g) were freeze-dried and ground, then passed through a 100-mesh sieve and packed into a plastic container with the same specifications as the standard source. The samples were sealed with wax for 1 month to putRa andPb into a permanent decay equilibrium. A high-purity germanium detector (GWL- 120-15N), digital spectrometer and multi-channel analysis system (EG&G ORTEC) were used to determine thePb content. The peak area at 46.5 keV was used to calculate the totalPb specific activity. The backgroundPb specific activity was calculated based on the peak area at 295.6 keV (Pb, daughter ofRa). The difference of 295.6 keV (Pb, daughter ofRa) is the excess specific activity ofPb (Pb).
For the energy resolution (FWHM) ofCo at 1.33 MeV ≤ 2.4 keV, and the FWHM ofCo at 122 keV ≤ 1.4 keV, thePb andRa standard samples were provided by the China Atomic Energy Research Institute (Han et al., 2015).
2.2.2 Biomarker extraction and purification
For sterol and GDGT analysis, sediment samples (10 g) were freeze-dried, ground and then loaded into an accelerated solvent extractor (ASE 350) (Chen et al., 2019). The samples were fully mixed and 24 alkanes with deuterium, 19 alcohols and C-GDGT standards were added. A solvent mixture of dichloromethane:methanol (9:1, v:v) was used for extraction, and the extracted solution was collected, representing the total extractable organic matter. After being concentrated, a methanol solution with 6% KOH was added for alkaline hydrolysis. After ultrasonication, the methanol solution was left standing at a constant temperature overnight.-Hexane was used for multiple ultrasonic extraction steps; after ultrasonication, the extraction fluid was combined and reduced under a stream of nitrogen to a smaller volume. The extract was separated by silica gel column chromatography, and the non-polar components were obtained by leaching with-hexane. The polar fraction was separated with dichloromethane:methane (1:1) leaching. The polar fraction, containing sterols and GDGTs, was divided into two extracts: one was derivatized with N,O-bis (trimethylsilyl) trifluoroacetamide for sterol analysis and the other was used in GDGT analysis.
To analyze the HBIs, freeze-dried sediment was placed into a neutral borosilicate glass bottle to which an internal standard was added (Belt et al., 2012). The branched hydrocarbons 7-hexylnonadecane and 9-octylheptadec- 8-ene were used to quantify a specific CHBI, IP. A mixture of dichloromethane:methanol (2:1, v:v) was added into the sediment with a glass straw before ultrasonic extraction (34 kHz, 15 min) and centrifugation (2500 rpm); the extraction and centrifugation steps were repeated four times. The total organic matter extract was collected and an activated copper plate was added to remove sulfur. The extract was dried under a stream of nitrogen (25 ℃), and then redissolved with-hexane before silica gel column (60–200 mm) chromatography. The extract was washed through with-hexane to collect the non-polar components, including HBIs, and the resulting extract was dried under nitrogen (25 ℃) to a constant volume.
2.2.3 Instrumental analysis
To analyze sterols, an Agilent 6890N gas chromatograph (HP-1 methy-1 siloxane column with dimensions of 50 m × 0.32 mm × 0.17 μm) coupled to a flame ionization detector (FID) was used. The injection temperature was 310 ℃ and the FID detector temperature was 320 ℃. Non-shunt injection was used. The carrier gas (N) velocity was kept at 1.2 mL·min. The heating procedure was an initial temperature of 80 ℃, which was held for 1 min, with increases to 200 ℃ at 25 ℃·min, to 250 ℃ at 3 ℃·minand to 300 ℃ at 1.8 ℃·min, at which point the temperature was held for 8 min; finally, the temperature was increased to 310 ℃ at 5 ℃·min(held for 5 min).
An ultra-high performance liquid chromatograph (Acquity UPLC, Waters Corp, USA) coupled to a mass spectrometer (Xevo TQ MS/MS, Waters Corp.) was used for GDGT analysis. A Waters HSS Cyano column (2.1 × 150 mm, 1.8 m) was used for the liquid chromatography with an injection volume of 2 L. The mass spectrometer used an atmospheric pressure chemical ionization source at a temperature of 150 ℃. The probe temperature was 550 ℃, the gas flow in the cone hole was 100 L·h, the desolvent gas flow was 1000 L·hand the impact gas flow was 0.15 mL·min. To improve instrument sensitivity and reproducibility, selected ion monitoring mode was adopted for scanning. The m/z of scanned ion nuclei were: 1302 (V), 1300 (VI), 1298 (VII), 1296 (VIII), 1292 (crenarchaeol, IV), 1050 (III), 1048 (IIIb), 1046 (IIIc), 1036 (II), 1034 (IIb), 1032 (IIc), 1022 (I), 1020 (Ib) and 1018 (Ic). The residence time of a single ion scan was 237 ms. Finally, an integral quantification of the peak area was carried out (Schouten et al., 2007).
HBI samples were analyzed using a gas chromatograph (7890A, Agilent, USA) and mass spectrometer (5975C, Agilent, USA) combined system equipped with a HP-5MS column (30 m × 0.25 mm × 0.25 μm). The gas chromatography conditions were an inlet temperature of 300 ℃ and non-shunt injection. The heating procedure spanned 40–300 ℃ at 10 ℃·minwith a hold of 10 min at 300 ℃. The mass spectrometry scanning range was 50–500 mass range with an ion bombardment source of 70 eV; both total ion current scanning and selected ion monitoring were used. The ratio of scanning ion to plasma nucleus (m/z) was 348.3 (HBI II) and 346.3 (HBI III).
All targeted biomarkers in the sediment samples were determined according to their characteristic ion peaks, retention times and relevant literature. Quantification of each target compound was determined by the ratio of the target peak to the peak area of the internal standard.
2.2.4 Organic carbon and isotope determination
A portion of each sediment sample was taken and 4 mol·Lof HCl was added to excess for 24 h. The samples were washed with deionized water to neutralize the acid and then placed in an oven (60 ℃) to dry. After constant weighing, samples were ground into powder through 60 mesh. To remove carbonate, subsamples (~10 mg) were accurately weighed and placed into 4 × 6 tin cups. The sedimentary TOC and δCwere determined online by an elemental analyzer (Flash EA 1112 HT, Thermo Scientific) coupled to a stable isotope mass spectrometer (Delta V Advantages, Thermo Scientific). The velocity of the carrier gas (He) was 90 mL·min, the reaction tube temperature was 960 ℃, and the chromatographic column temperature was 50 ℃. To control data quality, duplicate samples were inserted into the test samples; the TOC STD of these duplicates was less than 0.25‰ and organic carbon isotope (δC) STD < 0.2. The δCvalue is reported in delta notation compared to Pee Dee Belemnite international standard as a reference material.
The sample experiments and tests were carried out at the Second Institute of Oceanography, Ministry of Natural Resources, China.
2.2.5 IRD analysis
Debris contained within ice is carried by icebergs to the ocean, forming IRD deposits. So far, there is no uniform standard to determine the IRD content (Cooke et al., 1982; Smith et al., 1983; Labeyrie et al., 1986; Phillips et al., 2001). Our chosen method was to use an 1/10000 electronic balance to weigh 5–15 g of dry sample, sieve and retain the >250 µm particle fraction, then dry and weigh the material, and calculate the mass percentage of >250 µm particles (Han et al., 2015) (Figure 2).

Figure 2 Example features of ice-rafted debris from specific depths. a, 13–14 cm and b, 16–17 cm, in the D5-6 sediment core.
3 Results and discussion
3.1 Establishing the age model
The determination ofPb in the sediment core and the sedimentation rate were calculated using the steady initial radioactivity model (CIC model). From the vertical profile ofPbin the core, sedimentaryPbdeclines exponentially with depth (Figure 3), indicating that the deposition and flux ofPbinto the sediments in this area were stable, and the accumulatedPbdid not migrate basically after deposition. The decay curve ofPband the column depth were fitted to calculate the sedimentation rate (= 0.19 cm·a); the correlation coefficient was= 0.96 (= 17) and the fitting degree was good. The sediment core has a total length of 17 cm, and a continuous marine sediment sequence was obtained with the resolution varying on a 5-year scale for 90 years (1922–2012).
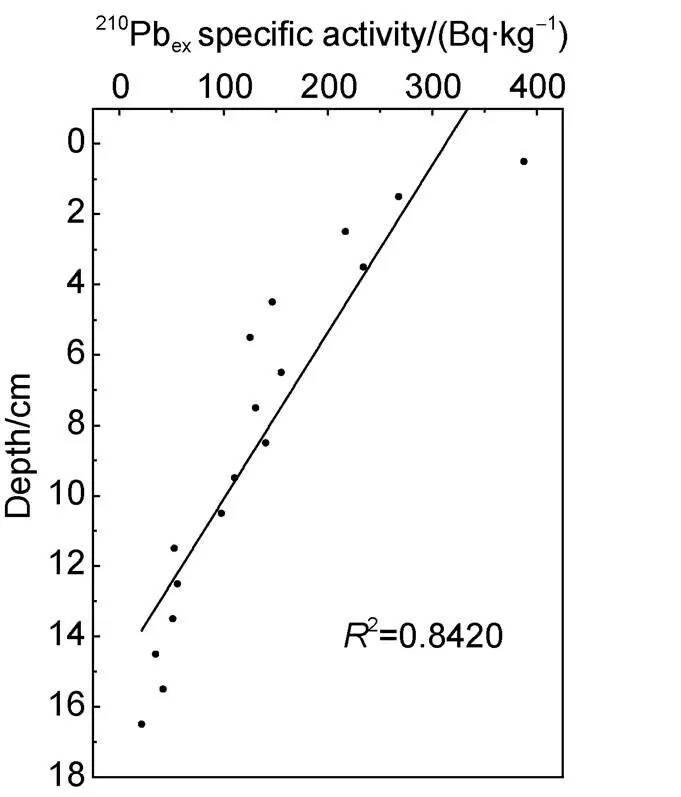
Figure 3 ThePbprofile in the D5-6 sediment core.
3.2 Biomarker evidence for total phytoplankton and zooplankton productivity
Phytoplankton communities are sensitive to climate change because their rapid succession reflects rapid changes in climate. It is important that their biomass determines the primary productivity of the upper ocean. Diatoms and dinoflagellates are the dominant phytoplankton groups in the Southern Ocean. Field measurements in waters adjacent to the Antarctic Peninsula showed that the phytoplankton is dominated by diatoms (Zhu et al., 1993; Rodriguez et al., 2002; Luan et al., 2012; Murphy et al., 2012). Usually, the biomarkers studied here, namely brassicasterol, dinosterol and Calkenones, are cell membrane components of some diatoms, dinoflagellates and coccolithophores, respectively (Werne et al., 2000; Zhao et al., 2006). The relative changes of their sedimentary concentrations can indicate biomass or community structure changes in phytoplankton, while the total content of these three biomarkers can represent the total phytoplankton productivity (SUM) (Schubert et al., 1998; Seki et al., 2004). The linear relationship between the productivity of diatoms and dinoflagellates in the sediment core was 0.72 << 0.96 and significant (< 0.01,= 18), indicating that the biomass correlation of these dominant groups was significant. Phytoplankton abundance, composition and cell size distribution directly affect the flux of organic carbon in the upper Southern Ocean water masses.
According to our new ~100-year sedimentary record (Table 1), the reconstructed SUMs were 358.61– 1179.40 ng·g(brassicasterol = 269.67–944.32 ng·g, dinosterol = 62.35–199.14 ng·gand Calkenones = 26.52–51.26 ng·g). The average SUM was 690.00 ng·g, with specific average concentrations of 519.79 ng·gfor brassicasterol, 129.68 ng·gfor dinosterol and 40.53 ng·gfor Calkenones. Thus, diatoms, dinoflagellates and coccolithophores dominate phytoplankton productivity with relative contributions of diatoms > dinoflagellates > coccolithophores. Overall, biomarkers and the SUM showed an increasing trend from the bottom of the core to a relatively high value at 8.5 cm. All parameters, except Calkenones, showed an increasing trend, indicating that primary phytoplankton productivity and zooplankton biomass increased overall. However, Calkenone concentrations, the Calkenones/SUM and Calkenones/brassicaste (coccolithophores/diatoms) all decreased, indicating that the productivity of calcareous phytoplankton and its abundance in the phytoplankton assemblage decreased. This change in phytoplankton community structure affects the BP.
The cholesterol trend, was used here to reconstruct temporal changes in zooplankton biomass, the average cholesterol content in the sediment core was 669.25 ng·g. It was similar to those for diatoms, dinoflagellates and the SUM overall, and showed a good correlation with diatoms (= 0.891,< 0.01,= 17; Figure 4). Antarctic krill are perennial marine macro-zooplankton (Nicol et al., 1999), and are a key species in the Southern Ocean ecosystem. The sea around the South Orkney Islands is one of the main habitats for Antarctic krill, and, in particular, is an important wintering site for juveniles (Reiss et al., 2008). Therefore, to a certain extent, sedimentary cholesterol content can track variability in Antarctic krill abundance. Generally, the trends in zooplankton biomass were relatively consistent with those for phytoplankton biomass. The increase and decline in diatoms directly affects zooplankton biomass because diatoms are an important food source for zooplankton, which, in turn, affects the quantity of phytoplankton through feeding. Notably, the sharp increase in cholesterol from 2.5 cm indicates a significant increase in Antarctic krill abundance that changes the pattern of phytoplankton. If this divergence with phytoplankton continues, it could have a serious impact on the marine food web and further affect the efficiency of the BP.
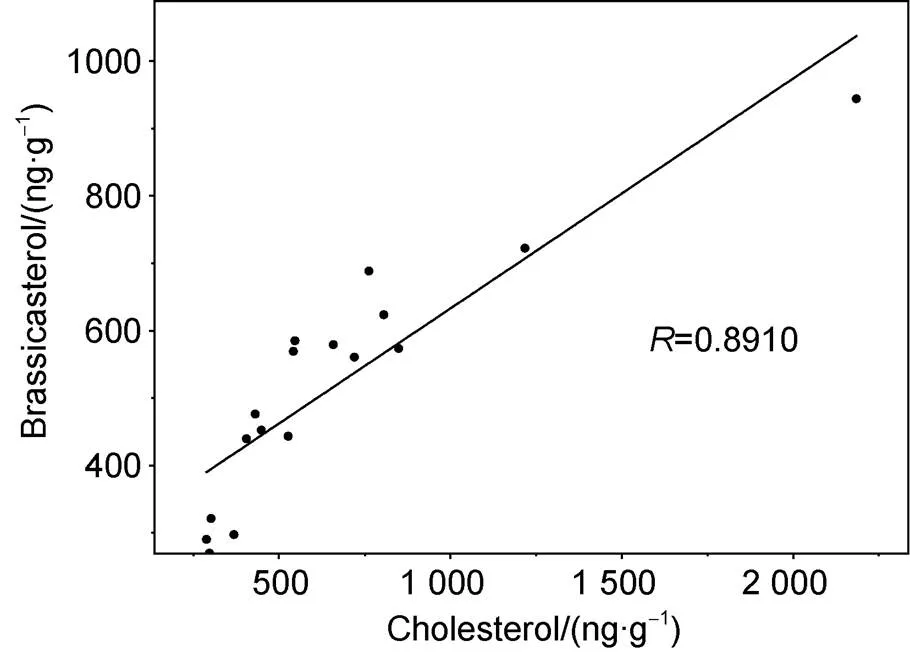
Figure 4 Correlation between brassicasterol and cholesterol contents in the D5-6 sediment core.
The SUM and cholesterol were also well correlated with TOC ((= 0.8546,< 0.05,= 18, and= 0.6319,< 0.05,= 18, respectively; Figure 5). This indicates that TOC is mainly derived from marine organic carbon and reflects the important contribution of plankton communities to sediments and the size of this carbon pool corresponds to climate change.
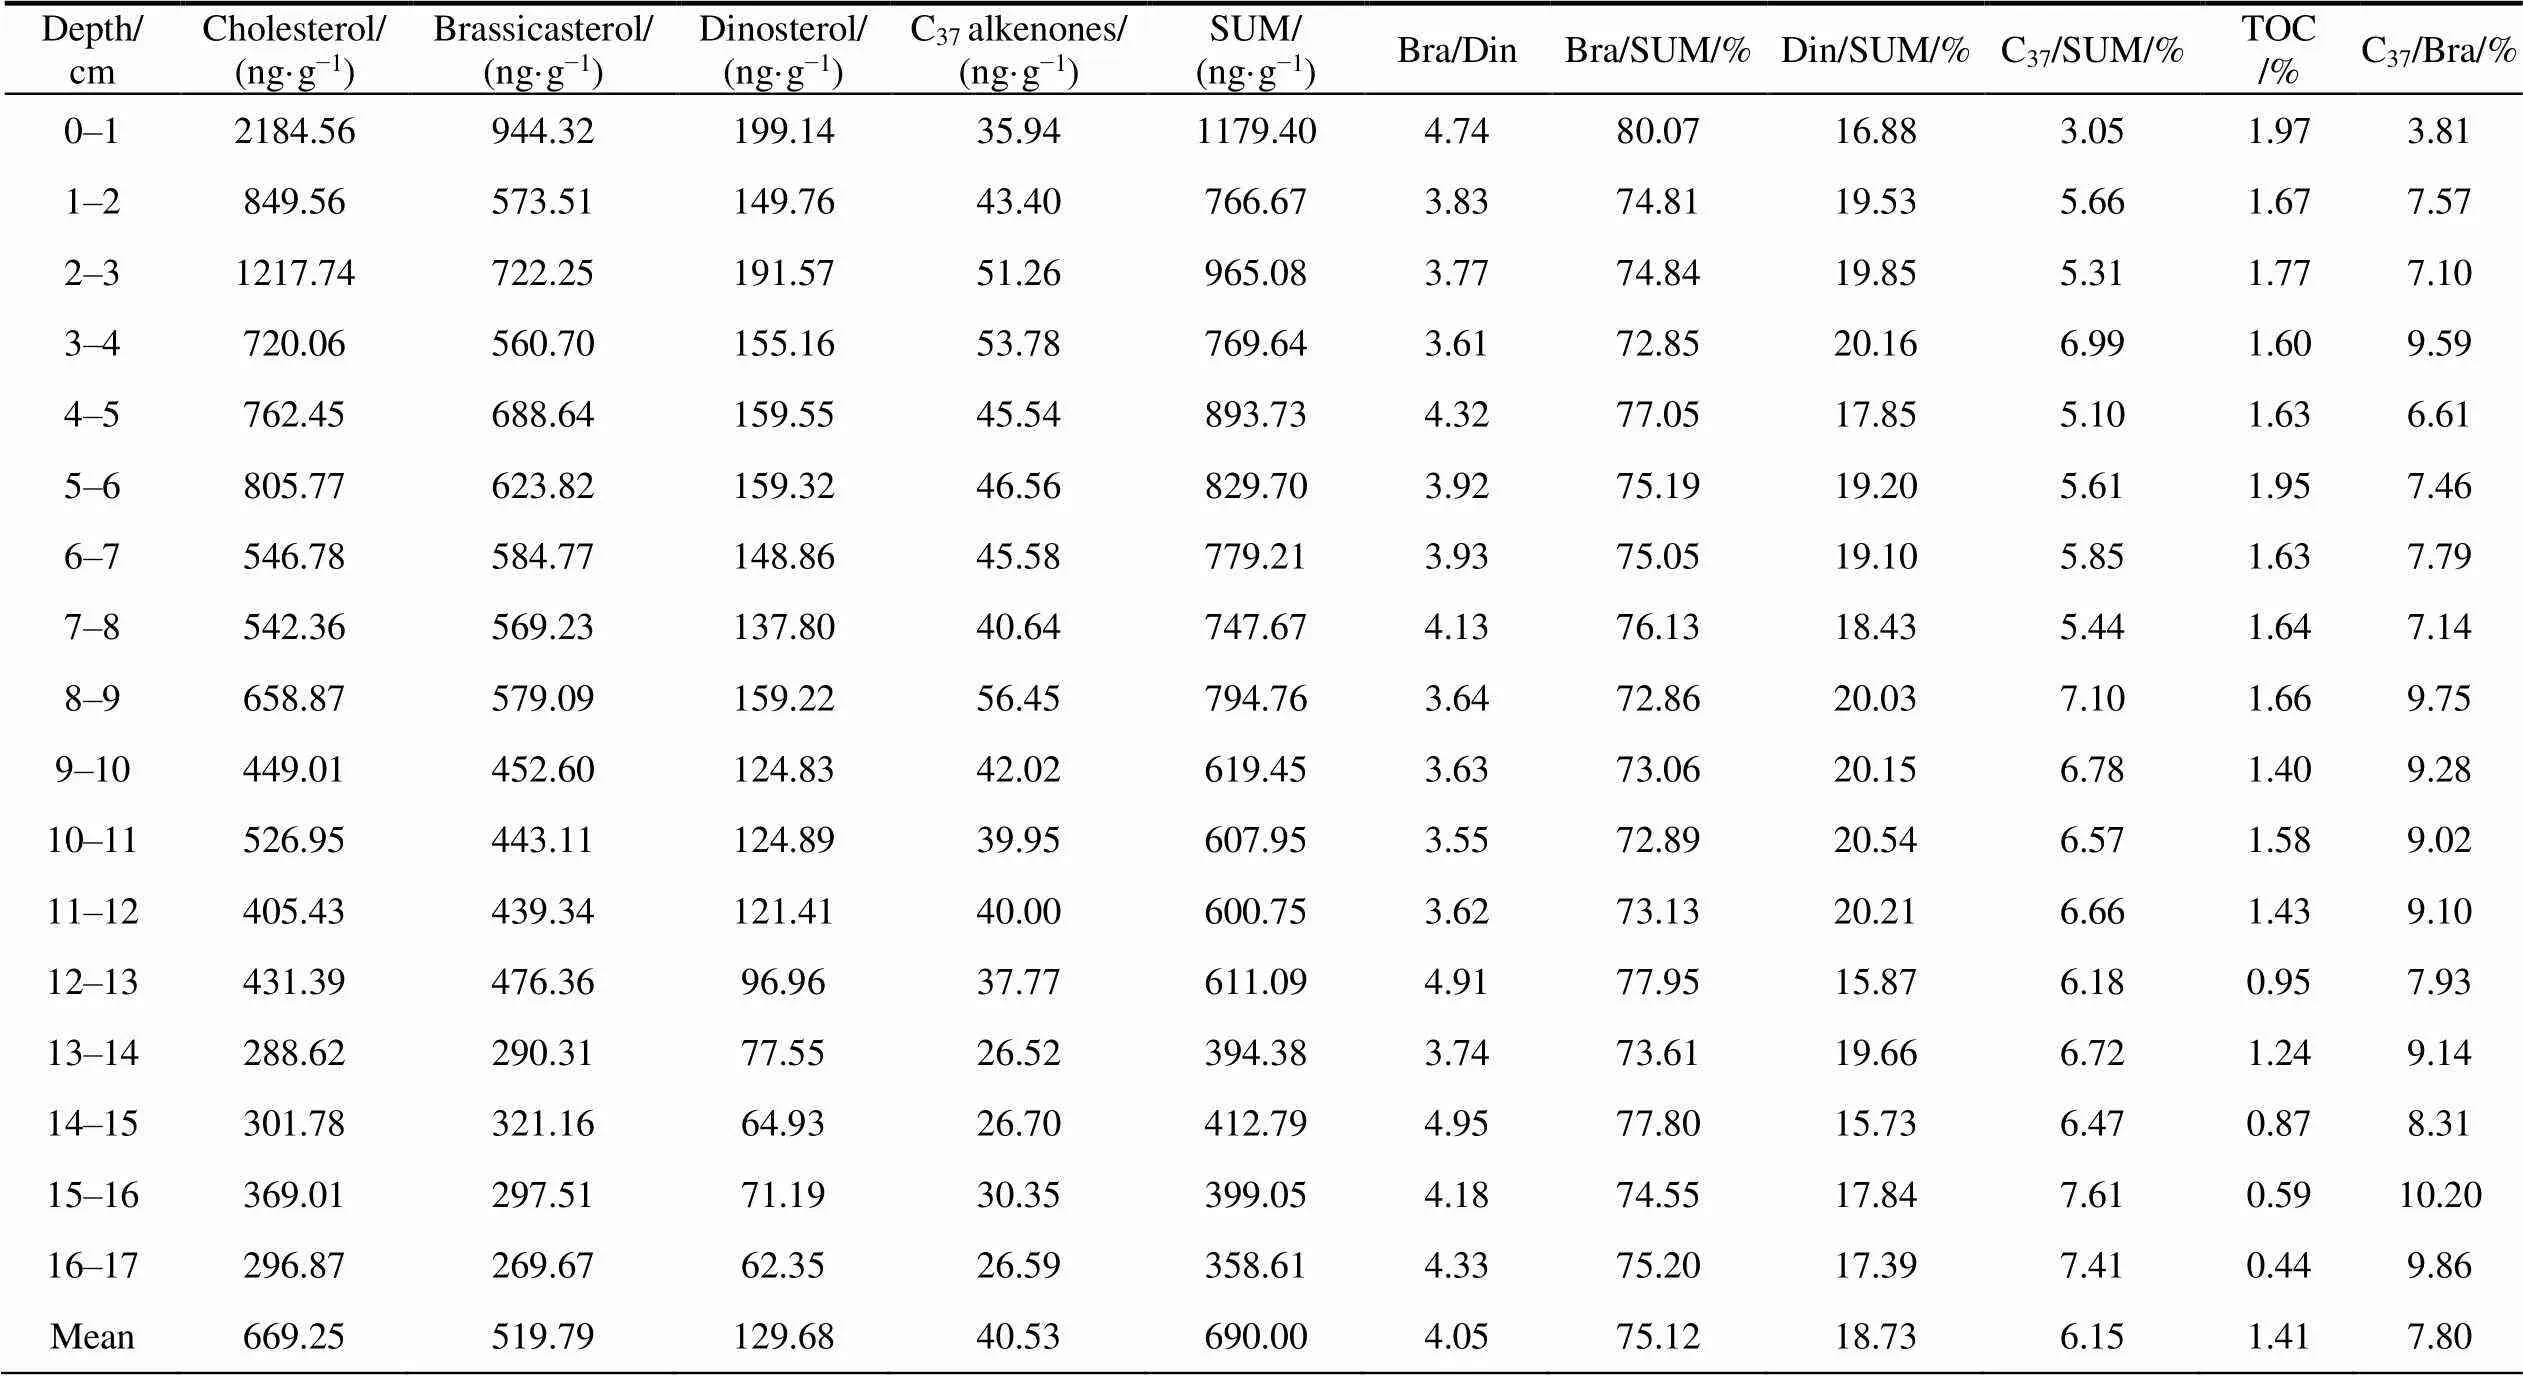
Table 1 Distribution characteristics of molecular biomarker contents and total organic carbon (TOC) in the D5-6 sediment core
*Abbreviations: SUM: total phytoplankton productivity; Bra/Din: brassicasterol/dinosterol; Bra/SUM: brassicasterol/SUM; Din/SUM: dinosterol/SUM; C/SUM: Calkenones/SUM; C/Bra: Calkenones/brassicasterol.
3.3 GDGTs indicate changes in archaea/bacteria population
Microbes form part of the base of the ecological food web and they are sensitive to changes in their environment; thus,the composition of GDGTs can be a good indicator of climate change. Microbial GDGTs can be divided into isoprenoid (iGDGTs) and branched GDGTs (Weijers et al., 2006; Schouten et al., 2008) that are generally produced by archaea and bacteria, respectively.
The total GDGT content in the sediment core averaged 261.51 ng·gand ranged from 168.74 to 375.65 ng·g. The bacterial-derived branched GDGTs ranged from 18.07 to 45.80 ng·g(Table 2). The iGDGTs content averaged 230.01 ng·g, ranged from 150.67 to 338.88 ng·g, and were mainly composed of the moieties iGDGT-0, iGDGT-1, iGDGT-2, iGDGT-3, iGDGT-4 (crenarchaeol) and the crenarchaeol isomer (crenarchaeol'). iGDGT-0 and crenarchaeol are mainly derived from marine Euryarchaeota and Crenarchaeota, respectively. The content of iGDGT-0 was 79.27–190.52 ng·gand that of crenarchaeol was 44.45–135.00 ng·g.The GDGT-0/crenarchaeol ratio, used to evaluate the presence of two archaea phyla (Euryarchaeota and Crenarchaeota) (Blaga et al., 2009), was between 0.78 and 2.42. The abundance of iGDGT-0 in our record indicates that these archaea must have evolved a unique adaptation to survive in the extreme environmental conditions of the Antarctic region. Stable cell membrane fluidity is the key to the survival of Antarctic microorganisms at low temperatures. The optimal fluidity of the cell membrane is increased by adding unsaturated fatty acids and branched-chain fatty acids, which play an important role in determining an organism’s adaptability to low temperatures, and the membrane lipids.
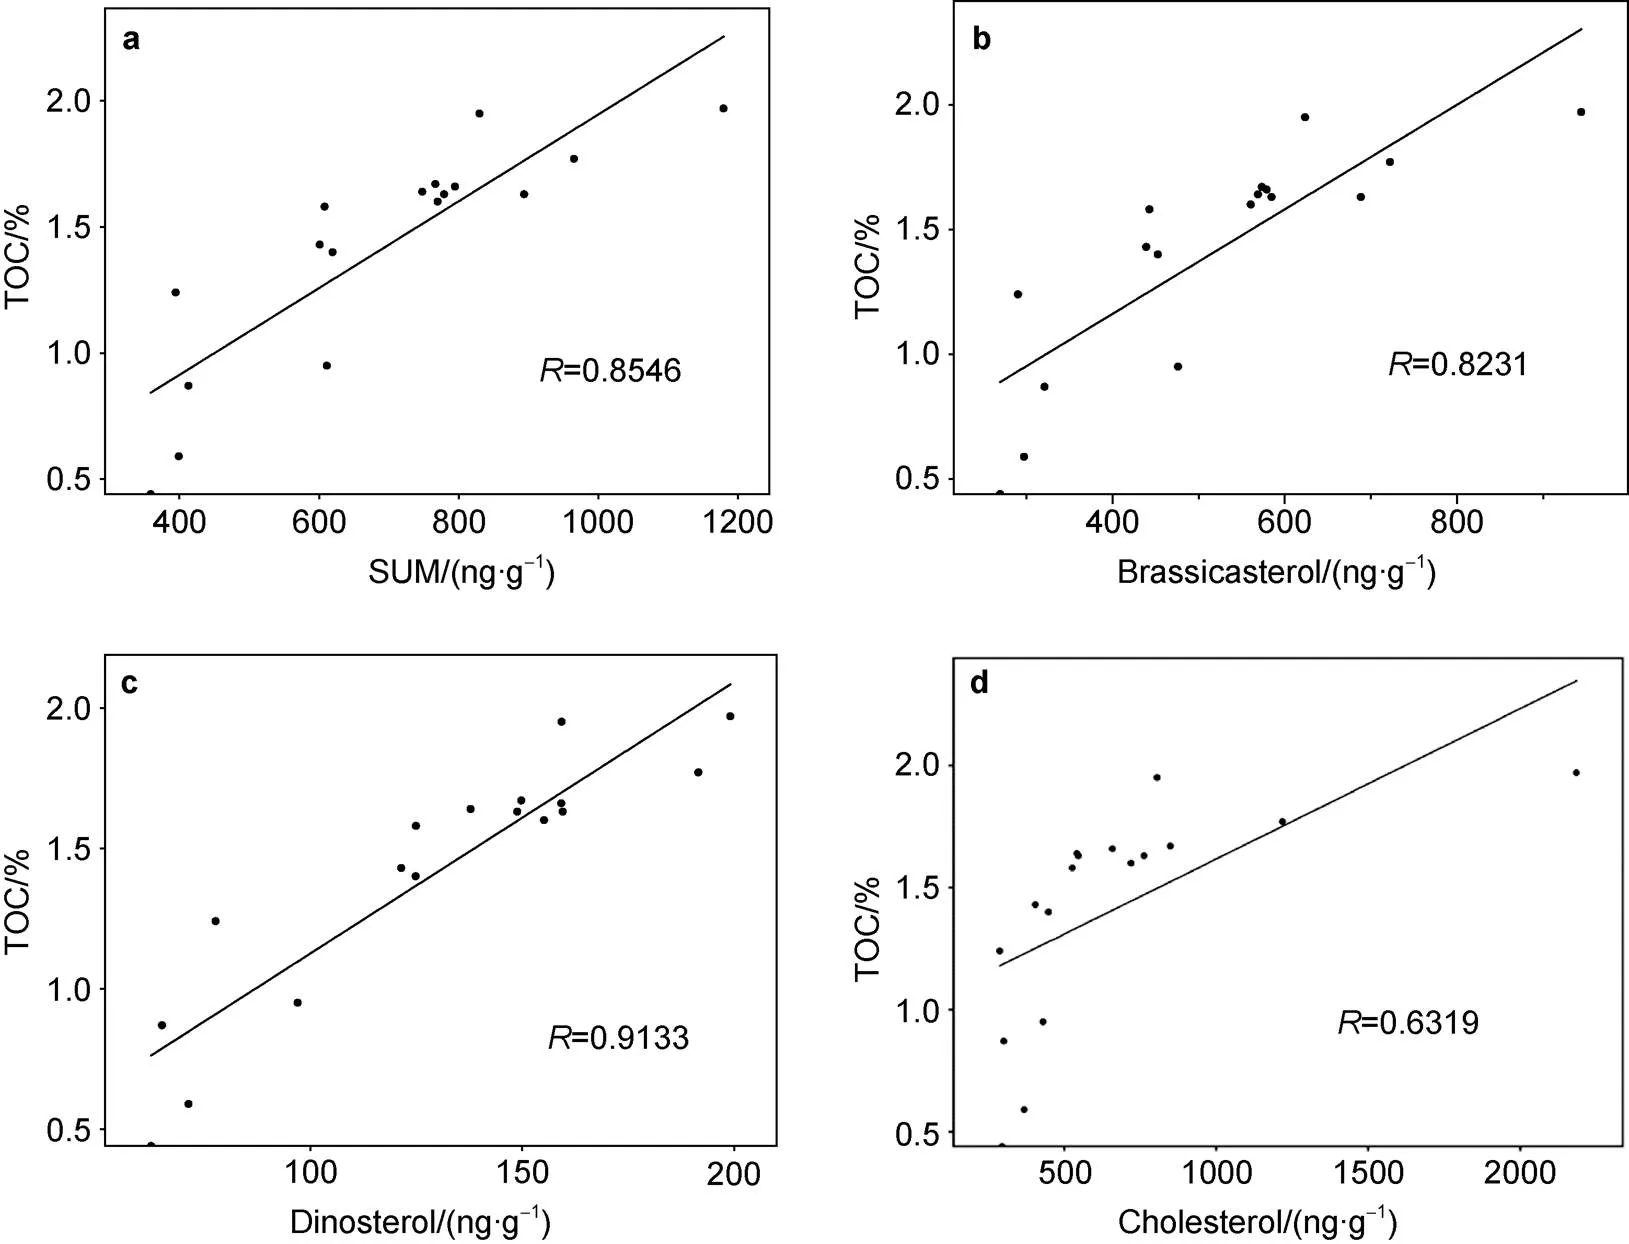
Figure 5 Correlation of total organic carbon (TOC) with molecular biomarkers: a, Total phytoplankton productivity (SUM); b, Brassicasterol; c, Dinosterol; d, Cholesterol, in the D5-6 sediment core.
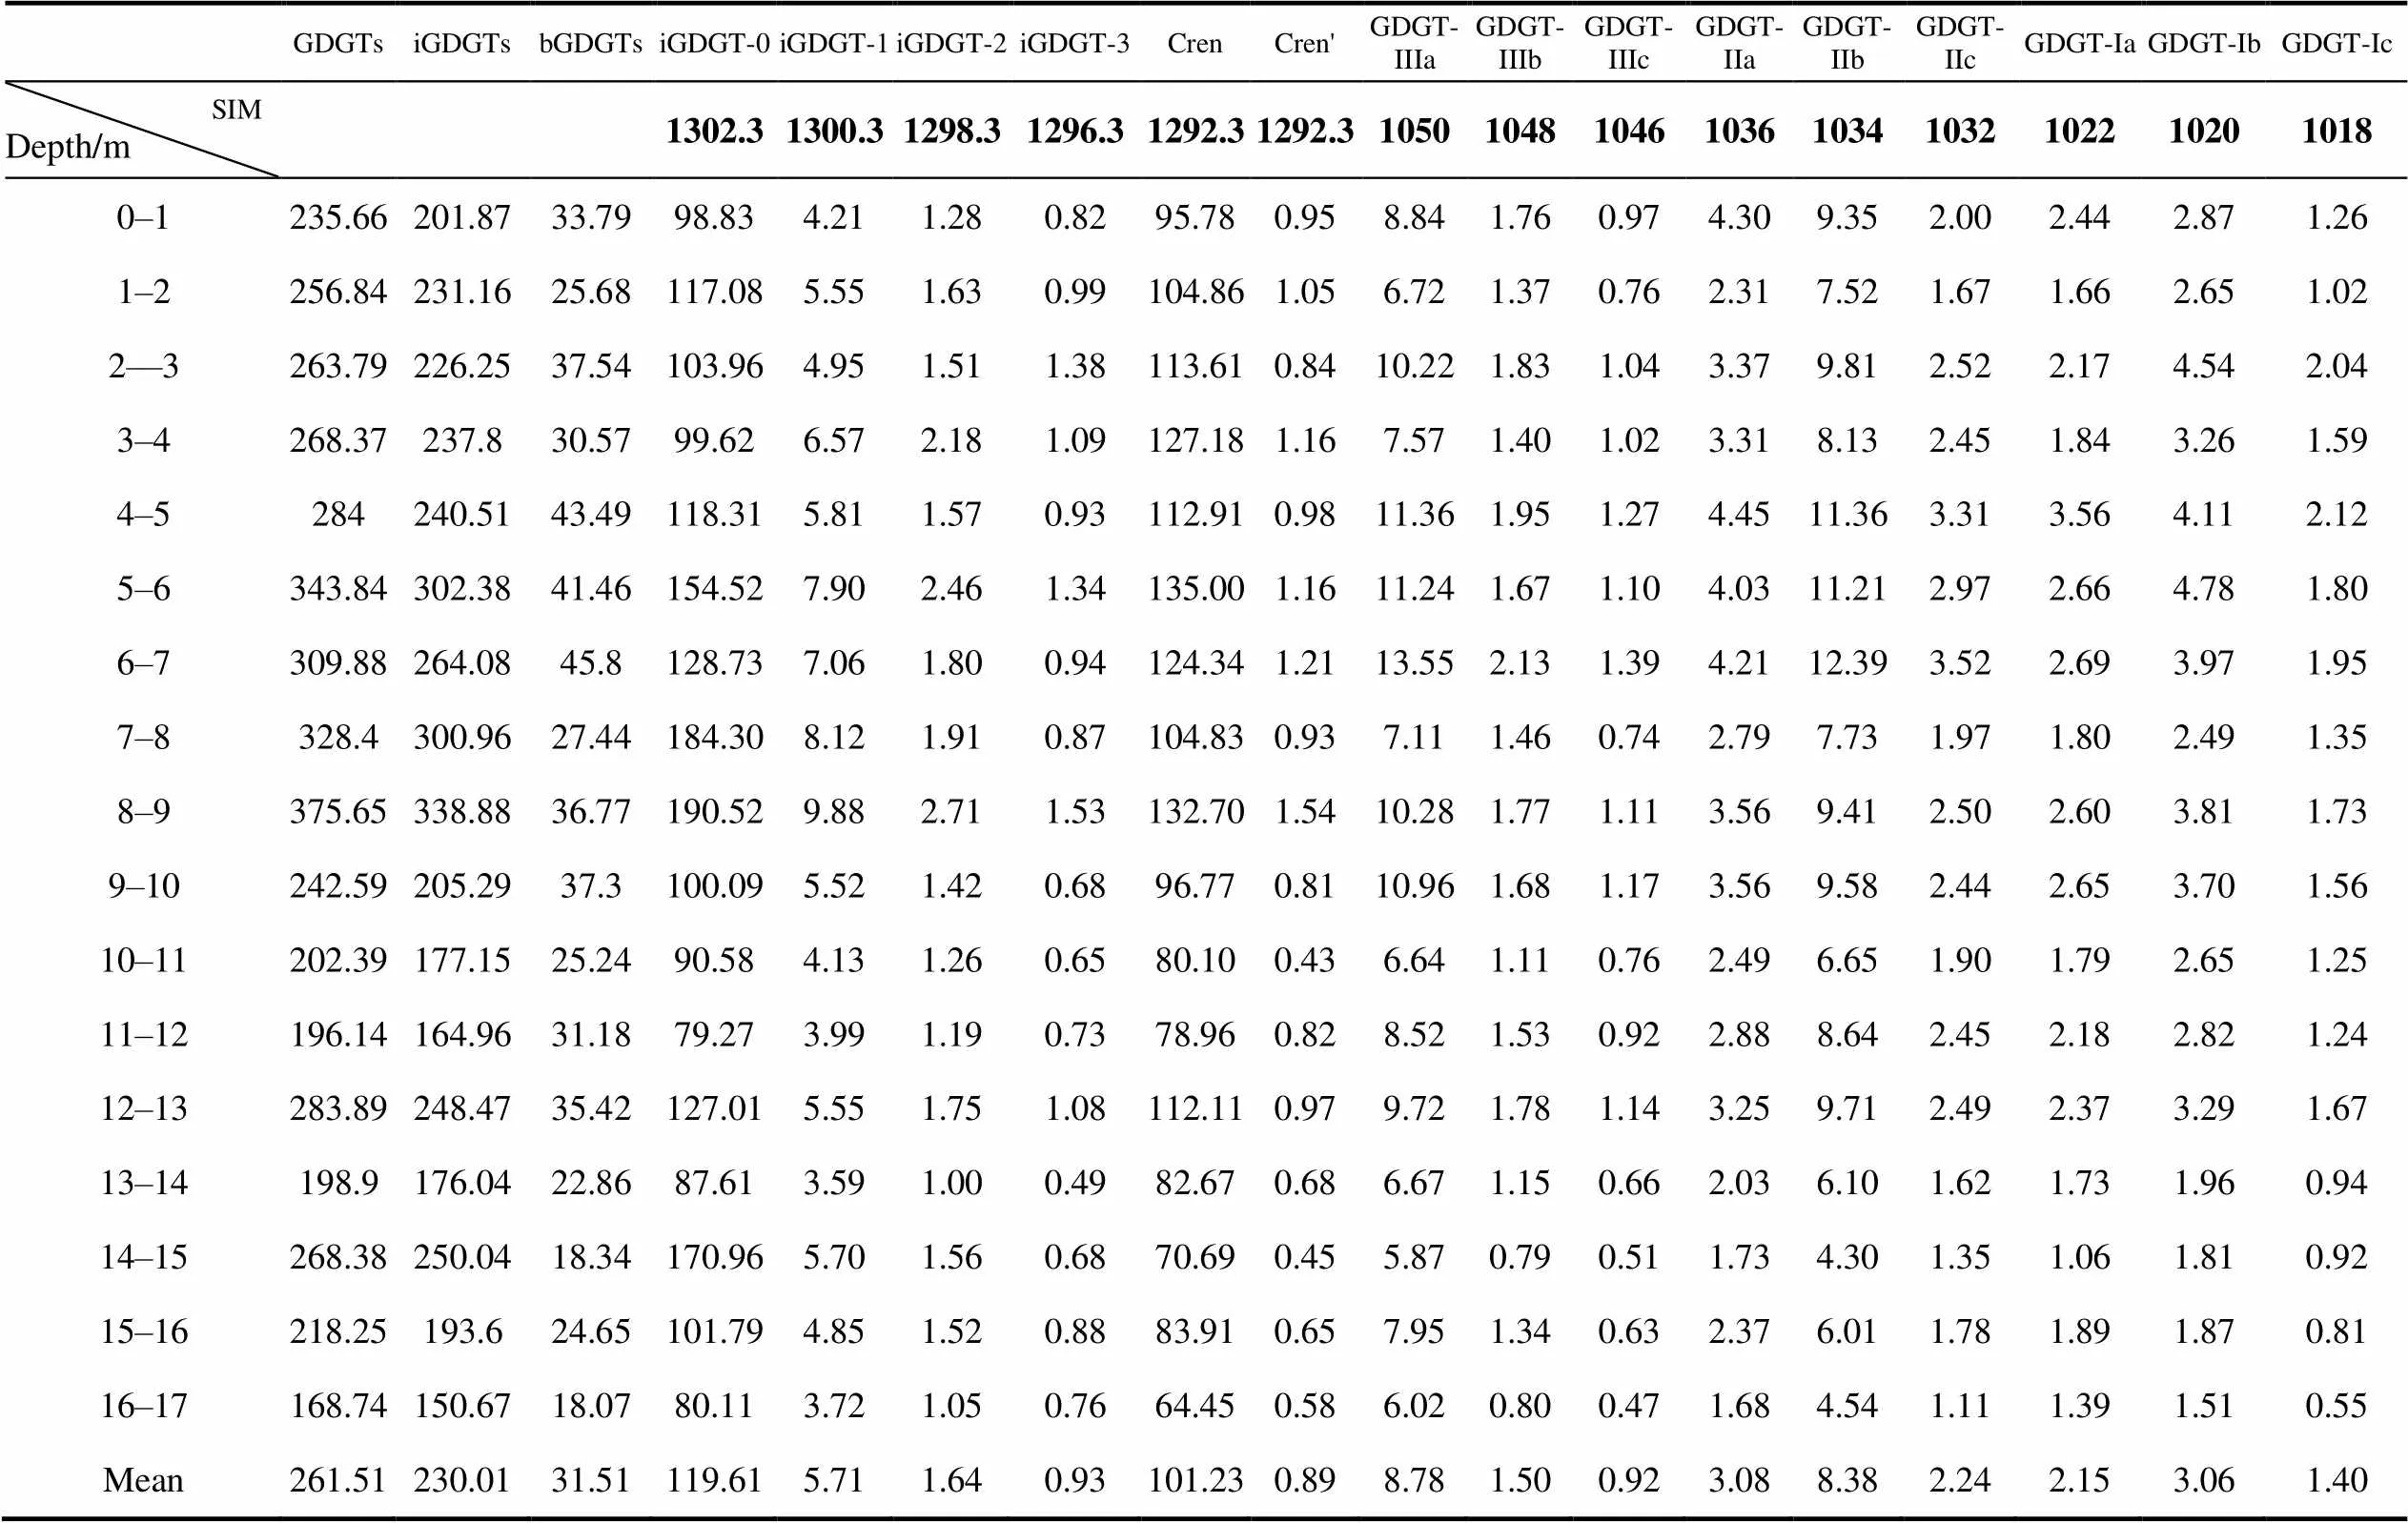
Table 2 Variations in GDGT contents (ng·g−1), including different moieties, and related indexes in the D5-6 sediment core
The dominant iGDGT trend in our sedimentary record off the eastern Antarctic Peninsula was crenarchaeol < iGDGT-0, which is different from warmer areas where crenarchaeol > iGDGT-0. Total GDGT contents, total iGDGTs, branched GDGTs, iGDGT-0, iGDGT-1 and crenarchaeol in thesediment core showed similar changes (Figure 5) and, in particular, the trends from 8–17 cm were similar. In that interval, there was a gradually increasing trend. Subsequently, the number of archaea decreased gradually from high amounts. An index to represent change in dominant archaeal phylum (iGDGT-0/crenarchaeol) fluctuated between 0.78 and 2.42, and the ratio generally showed a slightly decreasing trend from the bottom of the core to the top, indicating that the proportion of Crenarchaeota increased. There is a correlation between iGDGTs and TOC, which may reflect the fact that archaea rely on the organic matter produced by primary production as their energy source (Figure 6).
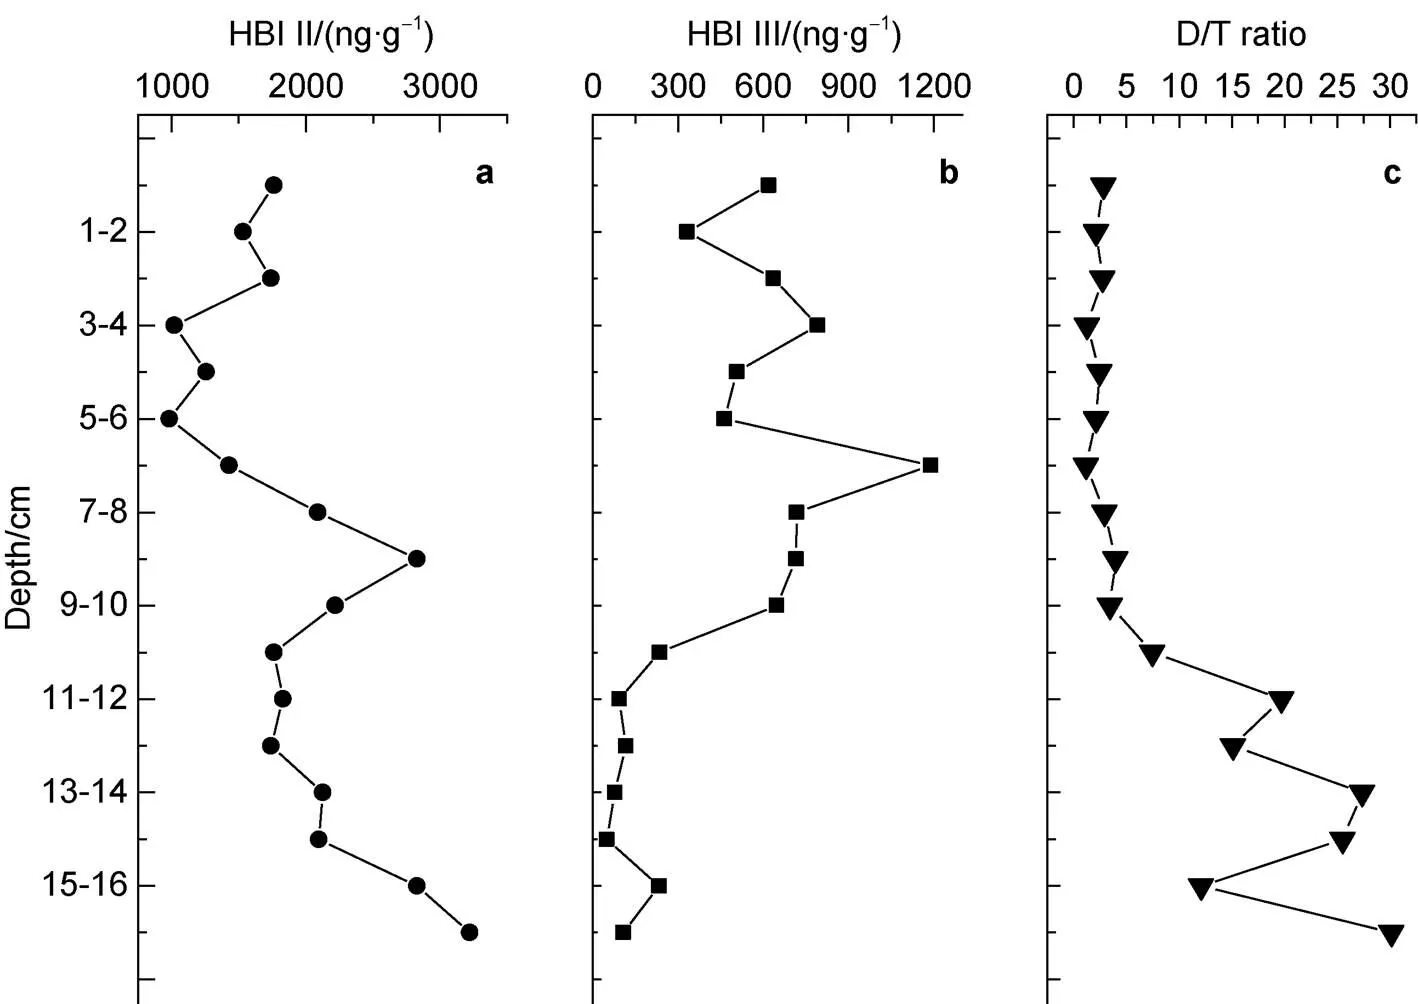
Figure6 Depth variations in highly branched isoprenoids (HBIs) and a sea ice proxy (D/T) in the D5-6 sediment core. a, HBI II; b, HBI III; c, D/T.
3.4 Effects of sea ice freeze-thaw on phytoplankton (HBI II and D/T)
Rapid changes in sea ice have a unique significance in carbon cycle studies (Gates et al., 1996). A specific HBI synthesized by a sea ice-dwelling diatom and retained in marine sediments (IP) (Rowland et al., 2001; Damsté et al., 2004) was developed as a new proxy for seasonal Arctic sea ice conditions (Armand et al., 2010; Belt et al., 2010). Sea ice diatoms capable of producing IPare not particularly abundant in the Southern Ocean, but other C-HBIs isomers have been found in sediments, suspensions and phytoplankton. Studies have investigated these isomers and the resulting indicators of sea ice algae (HBI II and IPSO) have been successfully applied in oceanographic reconstructions (Johns et al., 1999; Denis et al., 2010; Massé et al., 2011). A biomarker for phytoplankton in sea ice-free water (HBI III) (Collins et al., 2013; Campagne et al., 2015) and a resulting index (HBI II/HBI III, for short D/T) can provide information regarding changes in sea ice under different local environmental conditions in the Southern Ocean (Massé et al., 2011; Campagne et al., 2016).
Johns et al. (1999) proposed that in Southern Ocean sediments HBI II was synthesized by sea ice algae, HBI III by open ocean phytoplankton, and there was no HBI II biomarker in phytoplankton. Belt et al. (2007) reconstructed modern and Holocene sea ice changes using HBI II and HBI III in Antarctic continental shelf sediments. Armand et al. (2010) proposed that HBI II and HBI III combined withC data could reflect the relative contribution of sea ice diatoms and other phytoplankton. Denis et al. (2010) and Massé et al. (2011) suggested that in the Southern Ocean, the D/T ratio represented the relative contribution of organic matter from sea ice algae or phytoplankton in open waters, and that it was correlated with the sea ice environment or quick-freezing ice, or ice-free conditions (summer or longer term). Generally, high values of D/T are correlated with high sea ice concentration or a long duration of sea ice cover (including in summer), reflecting the low temperatures and strong winds in the region. Low D/T values indicate low sea ice concentrations, increased regional warming and melting, or a shorter sea ice duration (Barbara et al., 2010). The relative abundance of HBI II and HBI III can reflect the relative contribution of ice algae and phytoplankton in open water.
D/T is correlated with HBI II, and HBI II in Antarctic sediments is homologous with the sea ice alga(Massé et al., 2004; Belt et al., 2016). Sea ice provides a relatively stable growth environment for algae that live within it, while its duration is beneficial to the accumulation of algal biomass. Therefore, a high D/T indicates a significant increase in sea ice algal biomass and sea ice expansion. When sea ice melts, these algae are released into seawater, aggregate and sink rapidly. Compared with other phytoplankton, sea ice algae have a higher BP efficiency, which is significant for the Southern Ocean carbon cycle (van Leeuwe et al., 2018).
In this study, HBI II content in the sediment core ranged from 982.37 to 3220.67 ng·g, and HBI III content ranged from 49.31 to 1189.42 ng·g. D/T fluctuated between 1.2 and 30.15. D/T was negatively correlated with the SUM (= −0.7904,< 0.01,= 17; Figure 7c) and brassicasterol (= −0.7548,< 0.01,= 17; Figure 7a). D/T was also negatively correlated with dinosterol (= −0.8399,< 0.01,= 17; Figure 7b). There were good linear correlations between the SUM, diatom and dinoflagellate biomarkers, and D/T that indicates a relationship in their response to climate warming and reduced sea ice cover, where a more open water environment leads to increases in phytoplankton biomass and an enhanced BP, so that melting sea ice is a direct driver in ecosystem change (Smith and Comiso, 2008).
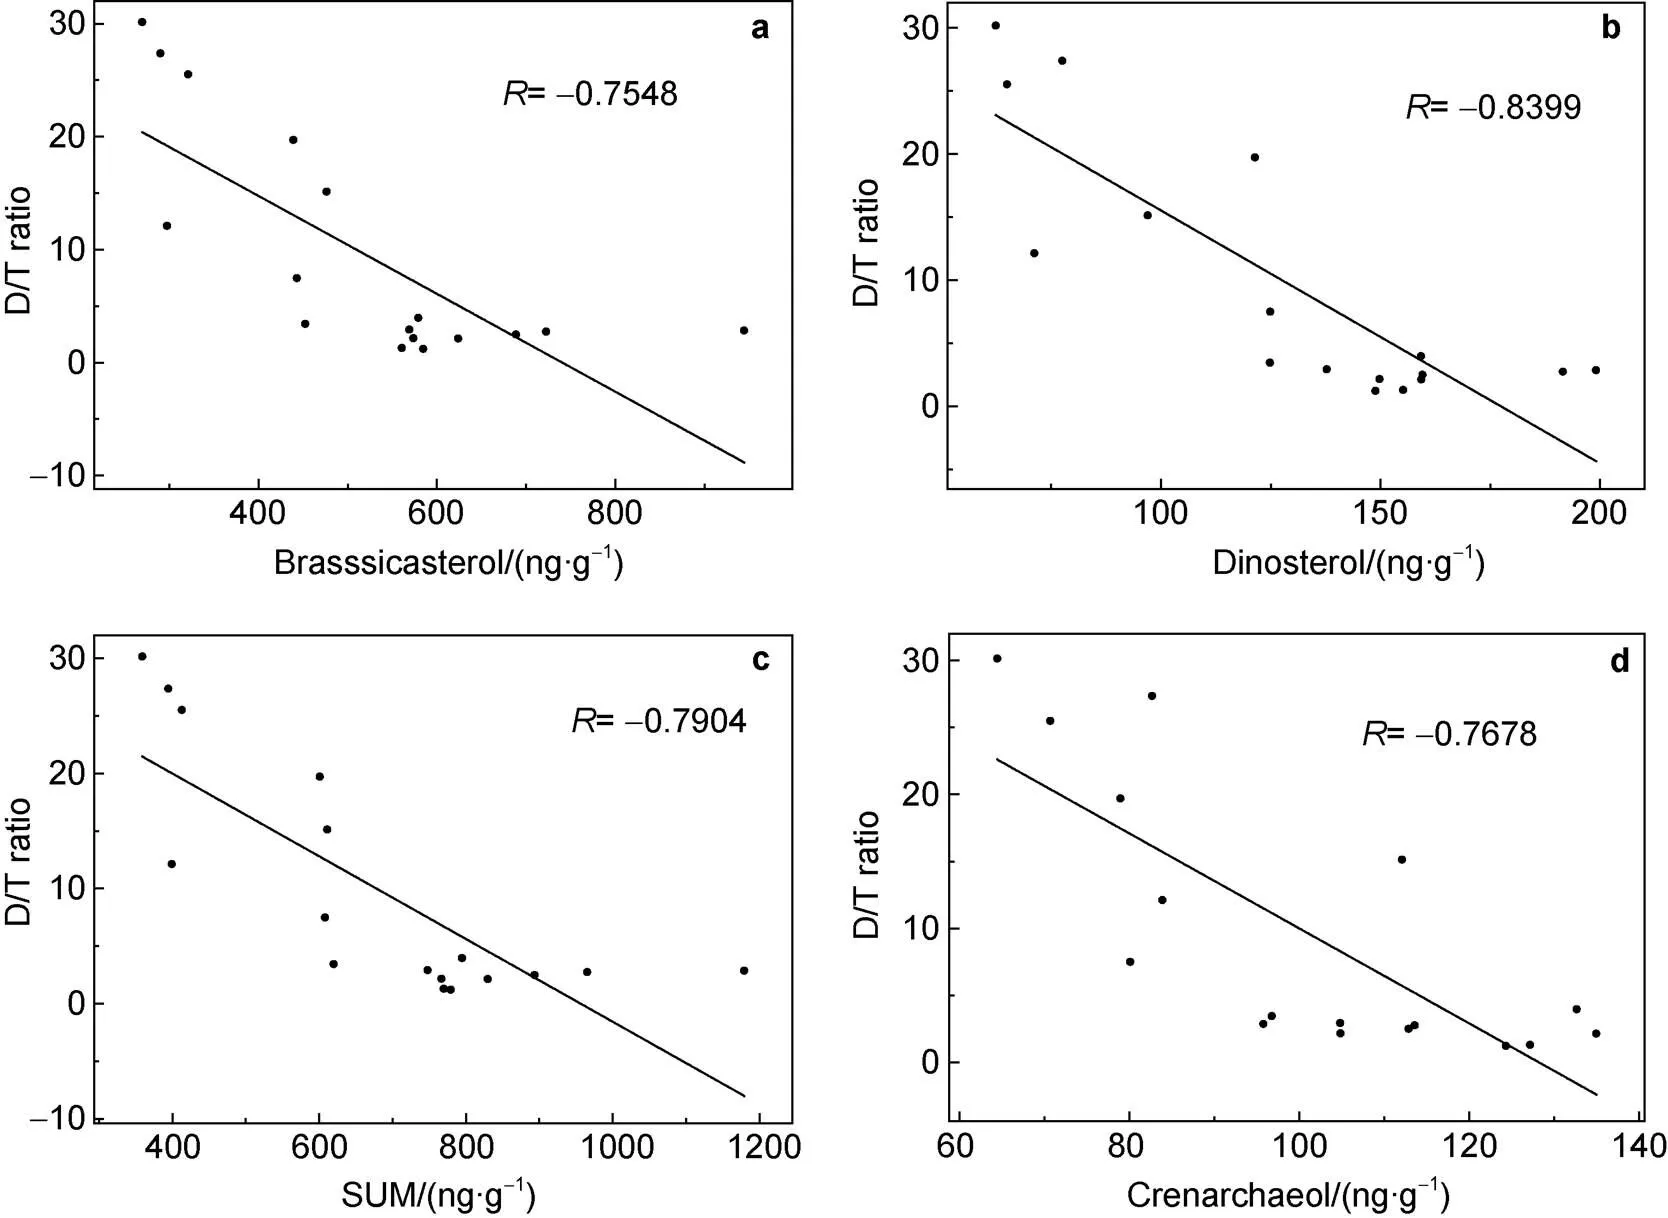
Figure 7 Correlation between biomarkers and a sea ice index (D/T) in sediment core D5-6. a, Brassicasterol; b, Dinosterol; c, Total phytoplankton productivity (SUM); d, Crenarchaeol.
3.5 IRD signals of climate change
IRD is used to indicate terrestrial material transported offshore via ice and the amount of IRD in sediments shows a relationship with cold/warm climate conditions. Sedimentary IRD content is generally higher in cold periods and lower in warm periods (Wang et al., 2009).IRD in the sediment core ranged from 0.43% to 13.7% at the highest (average = 3.62%), and gradually decreased from the bottom of the core to the top (Figure 8). The overall distribution could be divided into two parts (0–8 cm, 8– 17 cm). The sharp decrease in IRD at 8 cm suggested that the climate has warmed in recent decades. There is also a relationship between the transport of sea ice or icebergs and the size of sediment particles. Sea ice carries mainly silt and clay components, while icebergs carry more sand and coarser components (Clark et al., 1983; Hass, 2002).
3.6 Phytoplankton community and BP changes in response to global warming over the past century
One of the most important phenomena in climate change is global warming. Figure 8a shows global land and ocean temperature data (http://data.giss.nasa.gov/gistemp/graphs_v3/) over 90 years from 1922 to 2012; there is an overall increase with 1972 appearing as a turning point in global climate change. According to temperatures of the Northern and Southern hemispheres, global warming began to show increasing variability in the early 1970s, which is consistent with the slow rise of global temperatures since 1972. The most recent 50 years have the largest warming amplitude in a century (Folland et al., 2001; Jones et al., 2003). Over the past 50 years, the Antarctic Peninsula has warmed significantly (Vaughan et al., 2003; Turner et al., 2005). This is reflected in the warming of adjacent seas, the disintegration of ice shelves and the retreat of sea ice (Gille, 2002; Ducklow et al., 2007). Melting sea ice changes the phytoplankton community and affects the size distribution of phytoplankton (Moline et al., 2004; Montes-Hugo et al., 2008), which drives changes in the BP (Chierici et al., 2004; Chen et al., 2019). Therefore, we identified the interval in our sediment core (8.5 cm depth). The record was divided into two periods.
Stage I (8.5–0.5 cm) corresponds to the period from 1972 to 2012. The SUM ranged between 747.67– 1179 ng·g, the biomass of diatoms and dinoflagellates were 569.23–944.32 ng·gand 137.80–199.14 ng·g, respectively. The cholesterol content has a sharp increase from 546.78 to 2184.56 ng·g. It shows that global warming since 1972 has played a key role in increasing phytoplankton productivity in the study area. The TOC was relatively high, δC was lighter and IRD (< 250 µm) and D/T were generally low. Thus, in this stage, a warming climate and more open water from the melting of sea ice increased phytoplankton productivity, but there were still large inter-annual variations.
Stage II (8.5–16.5 cm) corresponds to the period from 1922 to 1972. Overall, there were small particles in the IRD (< 250 µm) and high D/T values. The SUM ranged from 358.61 to 749.76 ng·gand the biomass of diatoms, dinoflagellates and coccolithophores ranged from 269.67–579.09 ng·g, 62.35–159.22 ng·gand 26.52– 56.45 ng·g, respectively. The cholesterol content showed a slowly rising trend from 288.62 to 658.87 ng·g. In this stage, δC was relatively heavy and TOC content was low. Thus, phytoplankton productivity and zooplankton biomass were generally low. Generally, when the climate is colder, there is greater sea ice cover and the growth of marine phytoplankton and zooplankton is restricted, with a resulting overall marine productivity decline. The input of sedimentary organic matter from marine organisms decreased, but the relative contribution of sea ice algae increased from the increase in sea ice cover.
By comparing data in these two stages, phytoplankton productivity, diatoms and dinoflagellates, and zooplankton biomass showed an obvious increasing trend over the past ~100 years. This trend has been particularly obvious in the past 50 years, which corresponds to increasing global warming. The results indicate that with climate warming and the reduction of sea ice cover, diatom biomass is greatly increased and the BP is enhanced. Related to this was our finding that the proportion of calcareous phytoplankton (i.e. coccolithophores) decreased significantly. The Calkenones/SUM decreased from 6.18–7.61 to 3.05–6.99, and the calcium/silica ratio decreased from 7.93–10.20 to 3.81–9.5. The biological processes of coccolithophores and diatoms involve both the organic carbon and carbonate pumps. Different mechanisms play diversified roles in different environments, and environmental change may affect the efficiency of the BP, which may also impair its ability to act as a carbon receiver. The iGDGT content, dominant GDGT moieties, and dominant archaeal phylum have undergone consistent changes in the past 100 years that correspond to global warming (Figure 8). Since 1972, the biomass of these key microorganisms, archaea, and phytoplankton and zooplankton communities showed different trends but a consistent decline overall. However, an open question remains regarding whether the response of the Antarctic Peninsula’s marine biota to changing climate conditions implies interactions and influence among different groups of marine organisms. Reduced microbial production may weaken the ocean’s newly recognized microbiological carbon pump (MCP). In contrast, the carbon storage efficiency of the MCP is very high. In the context of global warming and predicted continued Antarctic sea ice reduction, the relative effect (increase or decrease) and proportion of the Antarctic BP/MCP can significantly affect the carbon storage of the global ocean and thus the Earth’s carbon cycle.
4 Conclusions
In this study, phytoplankton and zooplankton productivity was 690.0 ng·gon average. The average brassicasterol (519.79 ng·g), dinosterol (129.68 ng·g), Calkenones (40.53 ng·g) and cholesterol (669.25 ng·g) indicated that the relative contribution of phytoplankton productivity in the upper ocean was diatoms > dinoflagellates > coccolithophores. This is consistent with a field survey in waters adjacent waters to the Antarctic Peninsula that showed phytoplankton was dominated by diatoms.
In addition to productivity, we also reconstructed the dominant phytoplankton and zooplankton biomass in the eastern Antarctic Peninsula over the past century using brassicasterol, dinosterol, Calkenones and cholesterol as well as indexes such as the SUM, Calkenones/SUM and calcium/silica. Overall, the records showed similar characteristics. In the past 100 years, zooplankton biomass, phytoplankton productivity, diatoms and dinoflagellates increased, with this trend especially obvious in the last 50 years. In contrast, coccolithophores decreased, which may affect the phytoplankton assemblage (calcium/silica) and efficiency of the BP. The D/T ratio fluctuated between 1.20 and 30.15. Overall, diatoms, dinoflagellates and the SUM showed a good linear relationship with D/T, and there was an obvious response to climate warming and the reduction of sea ice cover. The development of a more open water environment during the study period led to an increase in phytoplankton and an enhanced BP.

Figure 8 Response of the ecological environment in the eastern Antarctic Peninsula to global warming over the past ~100 years. a, Global temperature data; b, D/T; c, Cholesterol; d, Brassicasterol; e, Dinosterol; f, Calkenones; g, Total phytoplankton productivity (SUM); h, Calkenones/SUM; i, Calcium/silica; j,GDGTs; k, Isoprenoid GDGTs (iGDGTs); l, GDGT-0; m, Crenarchaeol (Cren); n, TOC; o, δC and p, Ice-rafted debris (IRD).
We also found that iGDGT content and concentrations of different GDGT moieties as well as the dominant archaea phylum changed in a consistent manner over the past ~100 years, with an obvious shift corresponding to global warming. Reduced microbial production may weaken the ocean’s newly recognized MCP.
Since 1972, the archaea, phytoplankton and zooplankton records diverged and showed different trends. One area that will require future research is whether the climate response of the major biological groups off the eastern Antarctic Peninsula implies significant interactions and influence among these different groups.
Acknowledgements Our sincere thanks go to the researchers and crew of the R/V(Snow Dragon) for participating in the Chinese National Antarctic Research Expedition. This work was supported by the National Natural Science Foundation of China (Grant nos. 42076243, 41976227 and 41576186) and Chinese Polar Environment Comprehensive Investigation & Assessment Programs. We would like to thank two reviewers, and Associate Editor, Dr. Ad H. L. Huiskes for their valuable suggestions and comments. We appreciate Dr. Lei Bi from Polar Research Institute of China for his constructive suggestions in our preparation of this manuscript.
Armand L K, Leventer A. 2010. Palaeo sea ice distribution and reconstruction derived from the geological records//Thomas D N, Dieckmann G S. Sea ice, 2nd edn. Wiley, 469-530.
Barbara L, Crosta X, Massé G, et al. 2010. Deglacial environments in Eastern Prydz Bay, East Antarctica. Quaternary Sci Rev, 29(19-20): 2731-2740.
Barrett S M, Volkman J K, Dunstan G A, et al. 1995. Sterols of 14 species of marine diatoms (Bacillariophyta). J Phycol, 31(3): 360-369, doi:10.1111/j.0022-3646.1995.00360.x.
Belt S T, Brown T A, Rodriguez A N, et al. 2012. A reproducible method for the extraction, identification and quantification of the Arctic sea ice proxy IPfrom marine sediments. Anal Methods, 4(3): 705-713, doi:10.1039/C2AY05728J.
Belt S T, Massé G, Rowland S J, et al. 2007. A novel chemical fossil of palaeo sea ice: IP. Org Geochem, 38(1): 16-27, doi:10.1016/j. orggeochem.2006.09.013.
Belt S T, Smik L, Brown T A, et al. 2016. Source identification and distribution reveals the potential of the geochemical Antarctic sea ice proxy IPSO. Nat Commun, 7(1): 1-10.
Belt S T, Vare L L, Massé G, et al. 2010. Striking similarities in temporal changes to spring sea ice occurrence across the central Canadian Arctic Archipelago over the last 7000 years. Quat Sci Rev, 29(25-26): 3489-3504, doi:10.1016/j.quascirev.2010.06.041.
Blaga C I, Reichart G J, Heiri O, et al. 2009. Tetraether membrane lipid distributions in water-column particulate matter and sediments: a study of 47 European lakes along a north-south transect. J Paleolimnol, 41(3): 523-540, doi:10.1007/s10933-008-9242-2.
Calvo E, Pelejero C, Logan G A, et al. 2004. Dust-induced changes in phytoplankton composition in the Tasman Sea during the last four glacial cycles. Paleoceanography, 19(2): 1-10, doi:10.1029/2003pa 000992.
Campagne P, Crosta X, Houssais M N, et al. 2015. Glacial ice and atmospheric forcing on the Mertz Glacier Polynya over the past 250 years. Nat Commun, 6(1): 1-9, doi:10.1038/ncomms7642.
Campagne P, Crosta X, Schmidt S, et al. 2016. Sedimentary response to sea ice and atmospheric variability over the instrumental period off Adélie Land, East Antarctica. Biogeosciences, 13(14): 4205-4218, doi: 10.5194/bg-2015-610.
Chen J F, 2004. Biogeochemistry of settling particles in the South China Sea and its significance for paleo-environment studies. Shanghai: Tongji University.
Chen L Q, Gao Z Y, Yang X L, et al. 2004. Comparison of airsea fluxes of COin the Southern Ocean and the Western Arctic Ocean. Acta Oceanol Sin, 23(4): 647-653.
Chen W S, Yu P S, Han X B, et al. 2019. Contents and distribution of GDGTs in surface sediments of Ross Sea, Antarctic and their environmental significances. J Mar Sci, 37(1): 30-39.
Chierici M, Fransson A, Turner D R, et al. 2004. Variability in pH,CO, oxygen and flux of COin the surface water along a transect in the Atlantic sector of the Southern Ocean. Deep Sea Res Part II: Top Stud Oceanogr, 51(22-24): 2773-2787, doi:10.1016/j.dsr2.2001.03.002.
Clark D L, Hanson A. 1983. Central Arctic Ocean sediment texture: A key to ice transpor mechanisms//Molnia B F. Glacial-marine sedimentation. Springer, 301-330, doi:10.1007/978-1-4613-3793-5_7.
Collins L G, Allen C S, Pike J, et al. 2013. Evaluating highly branched isoprenoid (HBI) biomarkers as a novel Antarctic sea-ice proxy in deep ocean glacial age sediments. Quat Sci Rev, 79: 87-98, doi:10.1016/j.quascirev.2013.02.004.
Cooke D W, Hays J D. 1982. Estimates of Antarctic Ocean seasonal sea-ice cover during glacial intervals//Craddock C. Antarctic Geoscience: Part XI Marine Geology. Madison: The University of Wisconsin Press, 131: 1017-1025.
Damsté J S S, Muyzer G, Abbas B, et al. 2004. The rise of the rhizosolenid diatoms. Science, 304(5670): 584-587, doi:10.1126/science.1096806.
Denis D, Crosta X, Barbara L, et al. 2010. Sea ice and wind variability during the Holocene in East Antarctica: insight on middle–high latitude coupling. Quat Sci Rev, 29(27-28): 3709-3719, doi:10.1016/j. quascirev.2010.08.007.
Ducklow H W, Baker K, Martinson D G, et al. 2007. Marine pelagic ecosystems: the West Antarctic Peninsula. Phil Trans R Soc B, 362(1477): 67-94, doi:10.1098/rstb.2006.1955.
Ducklow H W, Wilson S E, Post A F, et al. 2015. Particle flux on the continental shelf in the Amundsen Sea Polynya and western Antarctic Peninsula. Elem: Sci Anthropocene, 3(6): 1-20, doi:10.12952/journal. elementa.000046.
Etourneau J, Collins L G, Willmott V, et al. 2013. Holocene climate variations in the western Antarctic Peninsula: evidence for sea ice extent predominantly controlled by changes in insolation and ENSO variability. Clim Past, 9(4): 1431-1446, doi:10.5194/cp-9-1431-2013.
Folland C K, Rayner N A, Brown S J, et al. 2001. Global temperature change and its uncertainties since 1861. Geophys Res Lett, 28(13): 2621-2624, doi:10.1029/2001gl012877.
Gates W L, Henderson-Sellers A, Boer G J, et al. 1996. Climate models–evaluation. Cambridge University Press, Cambridge, United Kingdom and New York, NY, USA.
Gille S T. 2002. Warming of the Southern Ocean since the 1950s. Science, 295(5558): 1275-1277.
Han X B, Zhang W Y, Yang H L, et al. 2015. The hydrodynamic environmental change in North Weddell Sea of Antarctic over past 100 years. J Mar Sci, 33(2): 30-39.
Hass H C. 2002. A method to reduce the influence of ice-rafted debris on a grain size record from northern Fram Strait, Arctic Ocean. Polar Res, 21(2): 299-306, doi:10.3402/polar.v21i2.6491.
Hernández-Molina F J, Larter R D, Rebesco M, et al. 2006. Miocene reversal of bottom water flow along the Pacific Margin of the Antarctic Peninsula: Stratigraphic evidence from a contourite sedimentary tail. Mar Geol, 228(1-4): 93-116, doi:10.1016/j.margeo. 2005.12.010.
Hernandez M T, Mills R A, Pancost R D. 2008. Algal biomarkers in surface waters around the Crozet Plateau. Org Geochem, 39(8): 1051-1057, doi:10.1016/j.orggeochem.2008.04.015.
Holligan P M, Fernández E, Aiken J, et al. 1993. A biogeochemical study of the coccolithophore,, in the North Atlantic. Global Biogeochem Cycles, 7(4): 879-900, doi:10.1029/93gb01731.
Johns L, Wraige E J, Belt S T, et al. 1999. Identification of a Chighly branched isoprenoid (HBI) diene in Antarctic sediments, Antarctic sea-ice diatoms and cultured diatoms. Org Geochem, 30(11): 1471-1475, doi:10.1016/s0146-6380(99)00112-6.
Jones P D, Moberg A. 2003. Hemispheric and large-scale surface air temperature variations: an extensive revision and an update to 2001. J Climate, 16(2): 206-223, doi:10.1175/1520-0442(2003)016<0206: halssa>2.0.co;2.
Kaiser J, Belt S T, Tomczak M, et al. 2016. Chighly branched isoprenoid alkenes in the Baltic Sea produced by the marine planktonic diatom Pseudosolenia calcar-avis. Org Geochem, 93: 51-58, doi:10.1016/j.orggeochem.2016.01.002.
Labeyrie L D, Pichon J J, Labracherie M, et al. 1986. Melting history of Antarctica during the past 60,000 years. Nature, 322(6081): 701-706, doi:10.1038/322701a0.
Luan Q S, Sun J Q, Wu Q, et al. 2012. Phytoplankton community in adjoining water of the Antarctic Peninsula during austral summer 2010. Adv Mar Sci, 30(4): 508-518.
Massé G, Belt S T, Guy Allard W, et al. 2004. Occurrence of novel monocyclic alkenes from diatoms in marine particulate matter and sediments. Org Geochem, 35(7): 813-822, doi:10.1016/j.orggeochem. 2004.03.004.
Massé G, Belt S T, Crosta X, et al. 2011. Highly branched isoprenoids as proxies for variable sea ice conditions in the Southern Ocean. Antart Sci, 23(5): 487-498, doi:10.1017/s0954102011000381.
Moline M A, Claustre H, Frazer T K, et al. 2004. Alteration of the food web along the Antarctic Peninsula in response to a regional warming trend. Glob Chang Biol, 10(12): 1973-1980, doi:10.1111/j.1365-2486. 2004.00825.x.
Montes-Hugo M A, Vernet M, Martinson D, et al. 2008. Variability on phytoplankton size structure in the western Antarctic Peninsula (1997–2006). Deep Sea Res Part II: Top Stud Oceanogr, 55(18-19): 2106-2117, doi:10.1016/j.dsr2.2008.04.036.
Murphy E J, Watkins J L, Trathan P N, et al. 2012. Spatial and temporal operation of the Scotia Sea ecosystem. Antarctic Ecosystems. Chichester, UK: John Wiley & Sons, Ltd, 160-212, doi:10.1002/978 1444347241.ch6.
Nicol S, Endo Y. 1999. Krill fisheries: Development, management and ecosystem implications. Aquat Living Resour, 12(2): 105-120, doi:10.1016/s0990-7440(99)80020-5.
Phillips R L, Grantz A. 2001. Regional variations in provenance and abundance of ice-rafted clasts in Arctic Ocean sediments: implications for the configuration of late Quaternary oceanic and atmospheric circulation in the Arctic. Mar Geol, 172(1-2): 91-115, doi:10.1016/s 0025-3227(00)00101-8.
Reiss C S, Cossio A M, Loeb V, et al. 2008. Variations in the biomass of Antarctic krill () around the South Shetland Islands, 1996–2006. ICES J Mar Sci, 65(4): 497-508, doi:10.1093/icesjms/ fsn033.
Riebesell U, Zondervan I, Rost B, et al. 2000. Reduced calcification of marine plankton in response to increased atmospheric CO. Nature, 407(6802): 364-367, doi:10.1038/35030078.
Riebesell U, Zondervan I, Rost B, et al. 2001. Effects of increasing atmospheric COon phytoplankton communities and the biological carbon pump. Global Change Newsl, 47: 12-15.
Rodriguez F, Varela M, Zapata M. 2002. Phytoplankton assemblages in the Gerlache and Bransfield straits (Antarctic Peninsula) determined by light microscopy and CHEMTAX analysis of HPLC pigment data. Deep Sea Res Part II: Top Stud Oceanogr, 49(4-5): 723-747, doi:10.1016/s0967-0645(01)00121-7.
Rost B, Riebesell U. 2004. Coccolithophores and the biological pump: responses to environmental changes//Thierstein H R, Young J R. Coccolithophore: from molecular processes to global impact from molecular processes to global impact. Springer: Berlin, 99-125.
Rowland S J, Belt S T, Wraige E J, et al. 2001. Effects of temperature on polyunsaturation in cytostatic lipids of Haslea ostrearia. Phytochemistry, 56(6): 597-602, doi:10.1016/s0031-9422(00)00434-9.
Schloss I R, Abele D, Moreau S, et al. 2012. Response of phytoplankton dynamics to 19-year (1991–2009) climate trends in Potter Cove (Antarctica). J Mar Syst, 92(1): 53-66, doi:10.1016/j.jmarsys. 2011.10.006.
Schouten S, Eldrett J, Greenwood D R, et al. 2008. Onset of long-term cooling of Greenland near the Eocene-Oligocene boundary as revealed by branched tetraether lipids. Geology, 36(2): 147-150, doi:10.1130/g24332a.1.
Schouten S, Forster A, Panoto F E, et al. 2007. Towards calibration of the TEX86 palaeothermometer for tropical sea surface temperatures in ancient greenhouse worlds. Org Geochem, 38(9): 1537-1546, doi:10.1016/j.orggeochem.2007.05.014.
Schubert C J, Villanueva J, Calvert S E, et al. 1998. Stable phytoplankton community structure in the Arabian Sea over the past 200, 000 years. Nature, 394(6693): 563-566, doi:10.1038/29047.
Seki O, Ikehara M, Kawamura K, et al. 2004. Reconstruction of paleoproductivity in the Sea of Okhotsk over the last 30 kyr. Paleoceanography, 19(1): 1-18, doi:10.1029/2002pa000808.
Smith W O, Comiso J C. 2008. Influence of sea ice on primary production in the Southern Ocean: A satellite perspective. J Geophys Res-Oceans, 113(C5):1-19.
Smith D G, Ledbetter M T, Ciesielski P F. 1983. Ice-rafted volcanic ash in the South Atlantic sector of the Southern Ocean during the last 100,000 years. Mar Geol, 53(4): 291-312, doi: 10.1016/0025- 3227(83)90047-6.
Smith W O Jr, Shields A R, Dreyer J C, et al. 2011. Interannual variability in vertical export in the Ross Sea: Magnitude, composition, and environmental correlates. Deep Sea Res Part I: Oceanogr Res Pap, 58(2): 147-159, doi:10.1016/j.dsr.2010.11.007.
Turner J, Colwell S R, Marshall G J, et al. 2005. Antarctic climate change during the last 50 years. Int J Climatol, 25(3): 279-294.
van Leeuwe M A, Tedesco L, Arrigo K R, et al. 2018. Microalgal community structure and primary production in Arctic and Antarctic sea ice: A synthesis. Elem: Sci Anthropocene, 6: 4, doi:10.1525/ elementa.267.
Vaughan D G, Marshall G J, Connolley W M, et al. 2003. Recent rapid regional climate warming on the Antarctic Peninsula. Clim Change, 60(3): 243-274, doi:10.1023/A: 1026021217991.
Wang R J, Xiao W S, Li W B, et al. 2010. Late quaternary ice-rafted detritus events in the Chukchi Basin, western Arctic Ocean. Chin Sci Bull, 55(4-5): 432-440, doi:10.1007/s11434-009-0424-8.
Weijers J W H, Schouten S, Hopmans E C, et al. 2006. Membrane lipids of mesophilic anaerobic bacteria thriving in Peats Have Typical Archaeal Traits. Environ Microbiol, 8(4): 648-657.
Werne J P, Hollander D J, Lyons T W, et al. 2000. Climate‐induced variations in productivity and planktonic ecosystem structure from the Younger Dryas to Holocene in the Cariaco Basin, Venezuela. Paleoceanography, 15(1): 19-29.
Zhao M, Mercer J L, Eglinton G, et al. 2006. Comparative molecular biomarker assessment of phytoplankton paleoproductivity for the last 160 Kyr off Cap Blanc, NW Africa. Org Geochem, 37(1): 72-97.
Zhu G H, Wang C S. 1993. Distribution characteristics of planktonic nano- and microalgae in adjacent surface waters off the South Shetland Islands, Antarctica. Acta Ecologica Sinica, 13(4): 383-386.
, E-mail: huangjing@pric.org.cn
3 August 2020;
4 February 2021;
20 March 2021
10.13679/j.advps.2020.0025
: Yang D, Zhang H S, Han Z B, et al. Biomarker records of D5-6 columns in the eastern Antarctic Peninsula waters: responses of planktonic communities and bio-pump structures to sea ice global warming in the past centenary. Adv Polar Sci, 2021, 32(1): 28-41,
10.13679/j.advps.2020.0025
杂志排行
Advances in Polar Science的其它文章
- Information for authors
- Editorial Note
- Assessment on India’s involvement and capacity-building in Arctic Science
- Complete genome analysis of bacteriochlorophyll a-containing Roseicitreum antarcticum ZS2-28T reveals its adaptation to Antarctic intertidal environment
- Leveraging the UAV to support Chinese Antarctic expeditions: a new perspective
- Seabird and marine mammal at-sea distribution in the western Bering Sea and along the eastern Kamtchatka Peninsula
