Wind induced turbulence caused colony disaggregation and morphological changes in the cyanobacterium Microcystis*
2021-03-10ZhuWeiChenHuaiminXiaoManrlingMiquelLiMing
Zhu Wei, Chen Huaimin, Xiao Man, Lürling Miquel & Li Ming
(1: Ministry of Education Key Laboratory of Integrated Regulation and Resource Development on Shallow Lakes, College of Environment, Hohai University, Nanjing 210098, P.R.China)(2: Australian Rivers Institute, Griffith University, Nathan, QLD 4111, Australia)(3: Aquatic Ecology & Water Quality Management Group, Department of Environmental Sciences, Wageningen University, P.O. Box 47, 6700 AA, Wageningen, The Netherlands)(4: College of Natural Resources and Environment, Northwest A & F University,Yangling 712100, P.R.China)
Abstract: Colony size and morphology influence the vertical migration capacity of Microcystis and therewith the occurrence of surface accumulations or blooms. To explore the influence of wind-induced turbulence on the colony size and morphology of Microcystis in field conditions, a high-frequency field investigation was conducted in an enclosure in Meiliang Bay, Lake Taihu, China, from 26 August to 7 September 2012. A Pearson’s correlation analysis indicated that the in situ growth rate of Microcystis was negatively related to surface cell density and positively related to wind speed. Strong wind speed stimulated Microcystis growth by enhancing light transmission due to the homodispersion of Microcystis in the water column. The Microcystis colony size was negatively correlated with wind speed, suggesting that wind-induced turbulence could break up colonies in shallow lakes. The results indicated that Microcystis colonies could be broken up by a turbulence intensity of 2.33×10⁻⁵ m2/s3, which corresponds to an average wind speed of 5.00 m/s in a reservoir with 30-m depth. Different Microcystis morphotypes were present and negative relationships were detected between the proportion of Microcystis ichthyoblabe and the proportion of Microcystis wesenbergii and between the proportion of Microcystis aeruginosa and the proportion of Microcystis wesenbergii out of all Microcystis throughout the water column, but more evidence is need to support the hypothesis that the morphology of Microcystis colonies changes over time. Altogether, the results suggest that declining wind speed, driven by climate change, will promote surface blooms of Microcystis due to the formation of larger colonies.
Keywords: Microcystis; water blooms; turbulence; colony size; morphology; Lake Taihu
The cyanobacteriumMicrocystismay form dense blooms throughout water systems around the world, which represents severe ecological and environmental issues[1-3]. The vertical migration capacity ofMicrocystisis an important trait underlying surface accumulations[4-5]. This migration ability depends on the density of the cyanobacteria-interplay between gas vesicles and carbohydrate ballast-, as well as the colony size and morphology, which are affected by turbulence[6-7]. Therefore, insight is needed in the influence of turbulence on colony size and morphology ofMicrocystisto understand the effect of turbulence on cyanobacterial blooms and surface accumulations.
The effect of turbulence on the colony size ofMicrocystishas mainly been studied in the laboratory. Some scholars[8-10]found that small-scale turbulence could increase the colony size ofMicrocystisin laboratory experiments. However, this was mainly because small-scale turbulence promoted the mixing of carbon dioxide and nutrients in the culture equipment, as well as the colonies, which brought them continuously in higher light that, consequently, improvedMicrocystisgrowth. Li et al.[7]reported that artificial high turbulence could change the colony size and morphology of someMicrocystisspecies. Nevertheless, their work indicated that the natural wind-induced turbulence could not disaggregateMicrocystiscolonies, whereas O’Brien et al.[11]got the opposite result.
Only one study has explored the effect of wind-waves on the colony size ofMicrocystisin field conditions[12]. These authors found that the mean size ofMicrocystiscolonies in the water column increased from 32.8 to 69.4 μm within 48 h during the passage of Typhoon Soulik, when the average wind speed was 6.63 m/s[12]. This result does not rule out the possibility that wind-waves changed the microenvironment so that the growth ofMicrocystiswas promoted, thereby increasing the colony size. Therefore, it is necessary to conduct high-frequency systematic monitoring in the field to study the relationship between wind-waves or turbulence and the colony size ofMicrocystis.
The differentMicrocystiscolonies have been interpreted as being different species[13]. There are obvious seasonal successions ofM.ichthyoblabe,M.wesenbergii, andM.aeruginosain most eutrophic lakes[14-16]. Recently, Xiao et al.[13]proposed a conceptual model of the morphological transition of aMicrocystiscolony, pointing out phenotypic plasticity rather than species replacement to explain variousMicrocystismorphotypes. Subsequently, Li et al.[7]confirmed in an indoor experiment that turbulence could change the colony morphology ofMicrocystis. All of these results suggest thatMicrocystiswith different morphologies belong to the same species and that morphology is constantly changing. However, it is important to conduct field research to obtain evidence for the transition of colony morphology. According to the morphology change model proposed by Xiao et al.[13], turbulence could potentially driveM.ichthyoblabetoM.wesenbergii-like colonies and toM.aeruginosa-like colonies. Hence, reduced biomass inM.ichthyoblabewould be accompanied by increased biomass ofM.wesenbergii, and likewise, reduced biomass inM.wesenbergiiwould be accompanied by increased biomass ofM.aeruginosa. Thus, the proportion ofM.ichthyoblabeshould be negatively related to the proportion ofM.wesenbergiiand the proportion ofM.wesenbergiibiomass should be negatively related to the proportion ofM.aeruginosa. To verify the above hypothesis, it is necessary to conduct high-frequency measurements of the biomass of different morphologies ofMicrocystisin lakes.
To this end, it is necessary to analyze colony size and morphological changes inMicrocystisunder different wind-induced turbulence conditions through high-frequency measurementsinsitu. Hence, the aims of this study were: (1) to clarify the influence of wind-induced turbulence on colony size ofMicrocystisin the field; (2) to intensively investigate morphology and morphological changes inMicrocystiscolonies; (3) to provide a systematic data set that can be used in subsequent numerical simulations ofMicrocystisbloom formation. Therefore, an enclosure was set up in Lake Taihu and the biomass, colony size and morphology ofMicrocystisat different depths in the enclosure were sampled at 2-h intervals to clarify the effect of turbulence on these parameters and the occurrence ofMicrocystisblooms.
1 Materials and Methods
1.1 Site description
Our investigation was conducted in a 4.00 m × 4.00 m enclosure, which was established approximately 150 m away from the eastern shoreline of Meiliang Bay, Lake Taihu (31°25′N, 120°13′E; Fig.1). The enclosure was made of a flexible geotextile underwater with floating rubber tubing above the surface of the water column, and was open to the atmosphere and to the bottom sediment. The mean water depth in the enclosure during the investigation was approximately 2.00 m and there was no exchange of phytoplankton between the inside and outside of the enclosure.
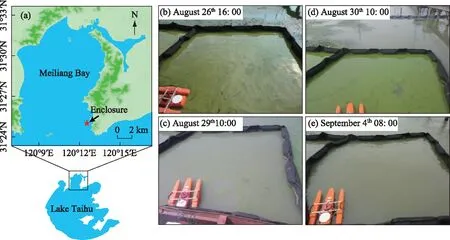
图1 太湖梅梁湾处围隔的位置及研究期间围隔内水华生消过程
1.2 Field sampling
Sampling was performed every 2 h from 14:00 on August 26 to 12:00 on September 7 in 2012. At each sampling, water samples (50 mL) were collected at varying depths through a slender plastic pipe (diameter 0.004 m) linked to a syringe. Water samples were taken from the surface (0 m) and at 0.10 m, 0.25 m, 0.40 m, 0.80 m, 1.20 m, 1.60 m, and 2.00 m depth. Formalin (2% (v/v)) was immediately added to the samples before measurements ofMicrocystiscell density, colony size, and morphology. Meanwhile, equal volumes of water samples were collected at the surface and middle layers of the water column, mixed, and then added into a 500-mL plastic bottle for subsequent nutrient concentration analysis.
1.3 Measurements of environmental factors
Air temperature, light intensity, and wind speed were measured in the field using an electronic thermometer (Mettler SG7, Toledo, OH, USA), a digital lux meter (ZDS-10, Shanghai Xuelian Instruments, China), and a wind recorder (TPJ-30, Zhejiang TOP Instrument Co., Ltd., China), respectively. The wind-driven current in the enclosure was measured using a ship-mounted Acoustic Doppler Current Profiler (ADCP; FlowQuest 2000, San Diego, USA) with its beams downward. The ADCP configuration was set to 0.13 m in bin cells (standard deviation of 0.001 m/s). The 3-dimensional current velocities and directions at different water layers were monitored synchronously every second. However, due to the unreceived reflection of 0.27 m near the ADCP[17-18], the 3-dimensional currents in the 0-0.27 m blind zone were unable to be measured in this study.
The root mean square (RMS) velocity (m/s) was used to define the characteristic speed of the turbulence in each water layer, and was calculated as follows:
(1)
(2)
whereμRMSxis the fluctuation of the current for Cartesian vectorx(which is similarly calculated for theyandzvectors) andnis the number of samples per measurement. TheRMSvelocities are expressed as averages in different water layers. The turbulent dissipation rate (ε in m2/s3) in each water layer, which describes the turbulence intensity, was calculated from theRMSvelocity (m/s)[19]as follows:
(3)
whereAis a dimensional constant of order 1[20]andhis the water depth (m) describing the size of the largest vortices.

1.4 Analysis of cell density, colony size and morphospecies of Microcystis
To estimate the cell density in eachMicrocystissample, a 10-mL centrifuge tube containing 5 mL sample was shaken in a water bath oscillator (100℃, 180 r/min) for approximately 5 min to disperse the colonies completely into single cells[23]. Next, cells were counted at least three times in a blood cell counting chamber under an optical microscope (Olympus CX31; Olympus Corp., Japan) at ×400 magnification. The average value of three results was used as the cell density until the difference between three calculated results was less than 10%.
EachMicrocystissample was shaken well and then photos were taken using a digital camera (Olympus C-5050) coupled to an optical microscope (Olympus CX31). The photomicrographs were analyzed using UTHSCSA ImageTool v3.00 software[24]. TheMicrocystiscolonies were classified into five morphologies:M.ichthyoblabe,M.aeruginosa, sphericalM.wesenbergii, irregularM.wesenbergii, and others, according to the taxonomic methods of Yu et al.[25]and Li et al.[7]. Each individual colony was assumed to be spherical to calculate the biovolume, because it is difficult to accurately measure and calculate the diameter ofMicrocystiscolonies, especially those with irregular morphologies. The diameter (D) ofMicrocystiscolonies was calculated as follows[26]:
(4)
where,Lis the longest axis andWis the shortest axis (aligned perpendicular to the longest axis) ofMicrocystiscolonies. More than 200 colonies per sample were measured to determine the biovolume percentage of various morphospecies for each size group of each morphospecies. The median colony diameter (D50) value was used to estimate the average colony size in all measured samples, which indicated that 50% of the colonies were smaller than this size[27-28].
1.5 Data analysis
In the current study, the time interval was 24 hours (from noon-12:00 hours- on the first day until noon the next day) and was defined as a complete day. Thus, the sampling period was divided into August 26th, August 27th... September 6th.
The following formula was used to calculate the average cell density ofMicrocystis(Cave) in the water column:
(5)
where,Ciis the cell density ofMicrocystisat the depthi, andhiis the height of the water column at depthi(h1=0.010 m;h2=0.165 m;h3=0.150 m;h4=0.275 m;h5=h6=h7=0.400 m;h8=0.200 m), andhis the water depth (2.00 m).
There was a certain deviation in each measurement of cell density ofMicrocystis. If only twoCavewere used to calculate theinsitugrowth rate, there will be a large systematic error. Hence, a least square linear regression of the natural logarithm ofCavevs. time was performed for each complete day, and the slopes of the regression lines represented theinsitugrowth rates ofMicrocystis[29].
The average colony size ofMicrocystis(D50ave) in the water column was calculated as follows:
(6)
where,D50iis the average colony size ofMicrocystisat depthi.
The proportion of each morphospecies (M.ichthyoblabe,M.aeruginosa, sphericalM.wesenbergii, irregularM.wesenbergiiand others) out of all theMicrocystisthroughout water column (Pmorphospecies) was calculated as follows:
(7)
where,Piis the proportion of each morphospecies out of allMicrocystisat depthi.
Correlation analyses between theinsitugrowth rate ofMicrocystisand environmental factors were performed using SPSS 19.0 software (IBM, Armonk, NY, USA). The relationships among the proportions of each morphospecies out of allMicrocystisthroughout the water column were analyzed via the interval maxima regression (IMR) method[30]. The proportions of two morphospecies were defined as the independent variable and the dependent variable, respectively. First, the independent variables along with the dependent variables were arranged in ascending order. Each independent variable was divided into equal increments, resulting in 18-32 intervals. Next, the maximum dependent variables of every interval were obtained and then fitted linearly with each independent variable. Then, to test the correlation between the fitted data and the original data, a bivariate Pearson’s correlation analysis was conducted using SPSS 19.0 software. The relationships between average colony size throughout the water column and wind speed and turbulence dissipation rate were determined by the IMR method. For all analyses, aPvalue of <0.05 was considered to indicate statistical significance.
The minimum-scale of turbulence is determined by the Kolmogorov scale (LK: μm):
(8)
(9)
where,υis kinematic viscosity (0.901×10⁻⁶m2/s at 25℃),γis shear rate (s-1),εis turbulent dissipation rate (m2/s3), which is calculated as follows[31]:
(10)
where,wis wind speed (m/s), andhis water depth (h=2.00 m in this study).
2 Results
2.1 Meteorological factors and nutrient concentrations
The air temperature showed a distinct diurnal trend of increasing in the morning and decreasing in the afternoon (Fig.2a). The range of maximum daily air temperature was 24.9-39.1℃, and the average air temperature during the whole study period was 26.9℃. Light intensity showed a similar diurnal trend as air temperature, and the maximum daily light intensity ranged from 178 to 1023 μmol·photons/(m2·s).
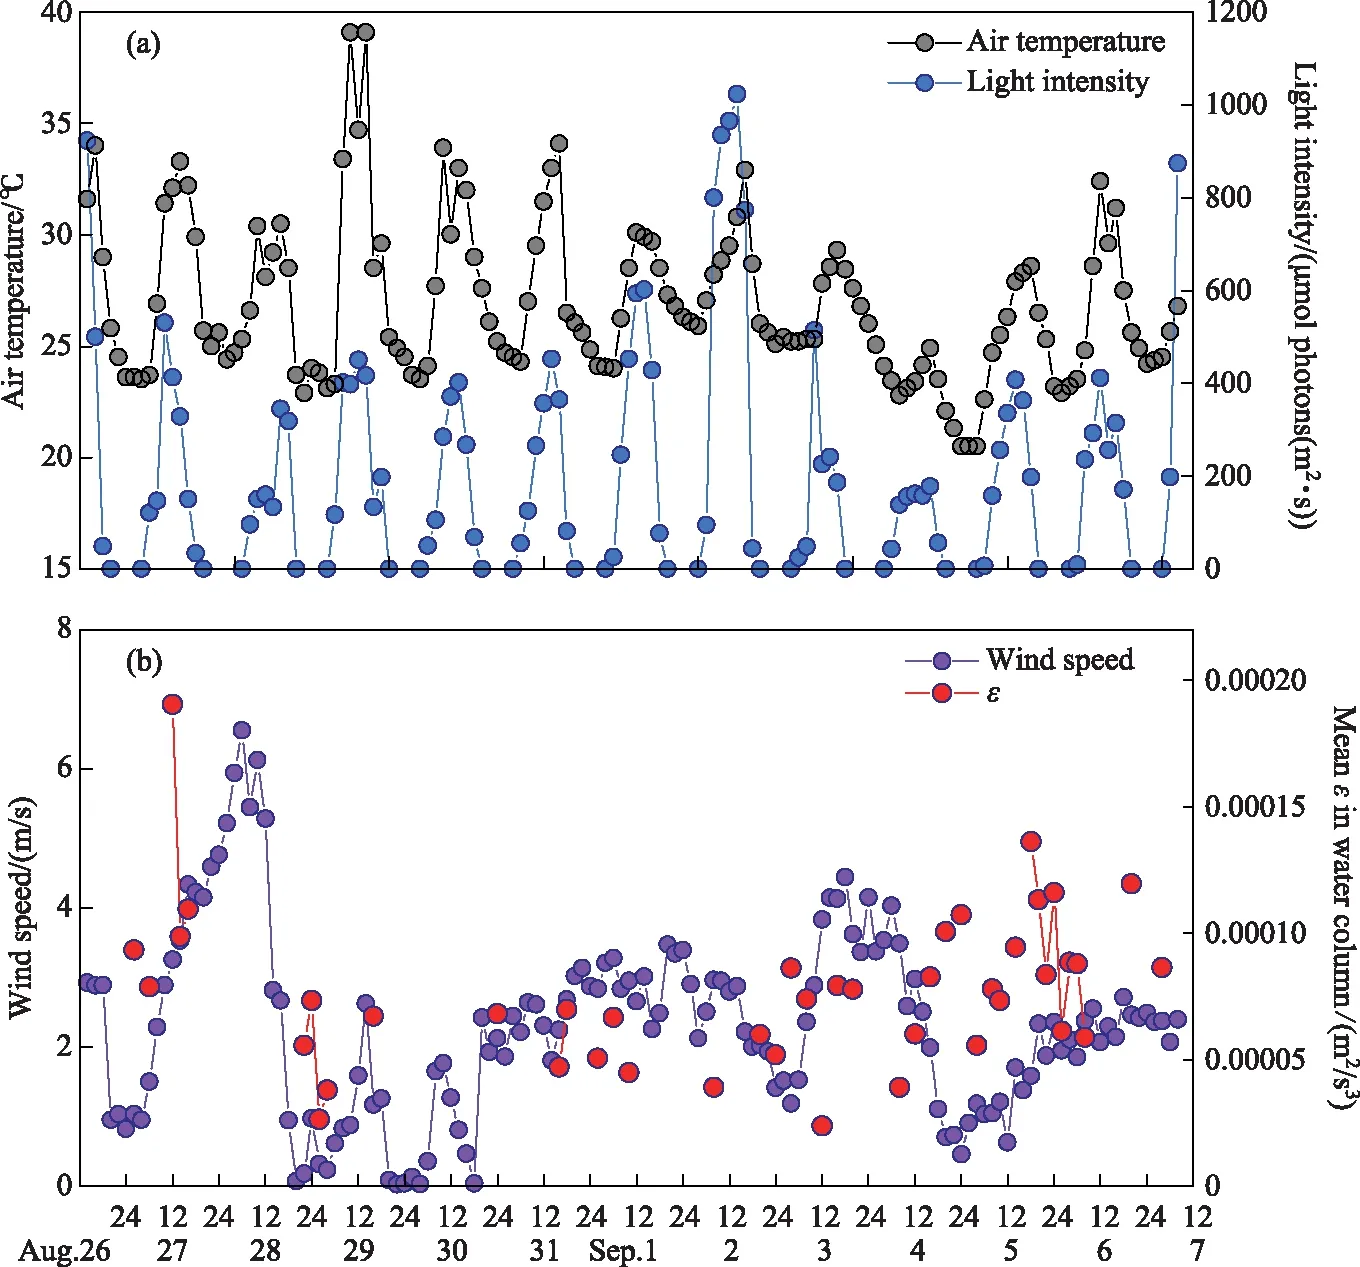
图2 研究期间气象因子的昼夜变化
The average wind speed was 4.87 m/s from 12:00 on August 27thto 12:00 on August 28th, with a peak wind speed of 6.55 m/s(Fig.2b). Wind speed above 3.00 m/s could also be observed on September 1stand 4th. The mean turbulence dissipation rate (ε) ranged from 2×10⁻⁵to 19×10-5m2/s3and showed the same trend as the wind speed.

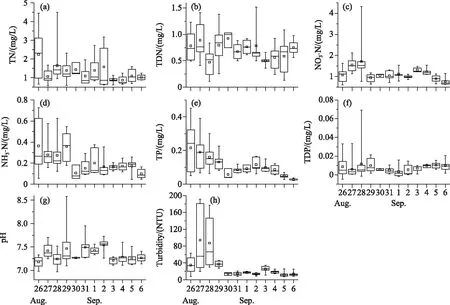
图3 研究期间营养盐的变化规律
2.2 Cell density, colony size and morphology of Microcystis
Microcystiswas the dominant species, accounting for >99% of all phytoplankton during the study. The surface cell density ofMicrocystisfluctuated widely during the study period (Fig.4a).Microcystismainly accumulated in the water surface with a high cell density above 1×10⁷cells/mL on August 26thand 30thand September 3rd. When wind speed was higher than 3.00 m/s on August 28thand September 1stand 4th, the surface cell density decreased to <2×10⁵cells/mL. The average cell density in the whole water column varied from 3×10⁴to 18×104cells/mL during the study (Fig.4a).
The median colony diameter (D50) ofMicrocystisat the water surface decreased dramatically under strong wind on August 27th(Fig.4b). After August 28th, theD50ofMicrocystisat the surface first increased and then declined. The averageD50ofMicrocystisthrough the whole water column was slightly lower than that at the water surface with range of 66.2-768.0 μm. The trend in the variation inD50in the whole water column also decreased under strong wind on August 27th(Fig.4b). When wind got down, theD50in the whole water column increased and then declined.
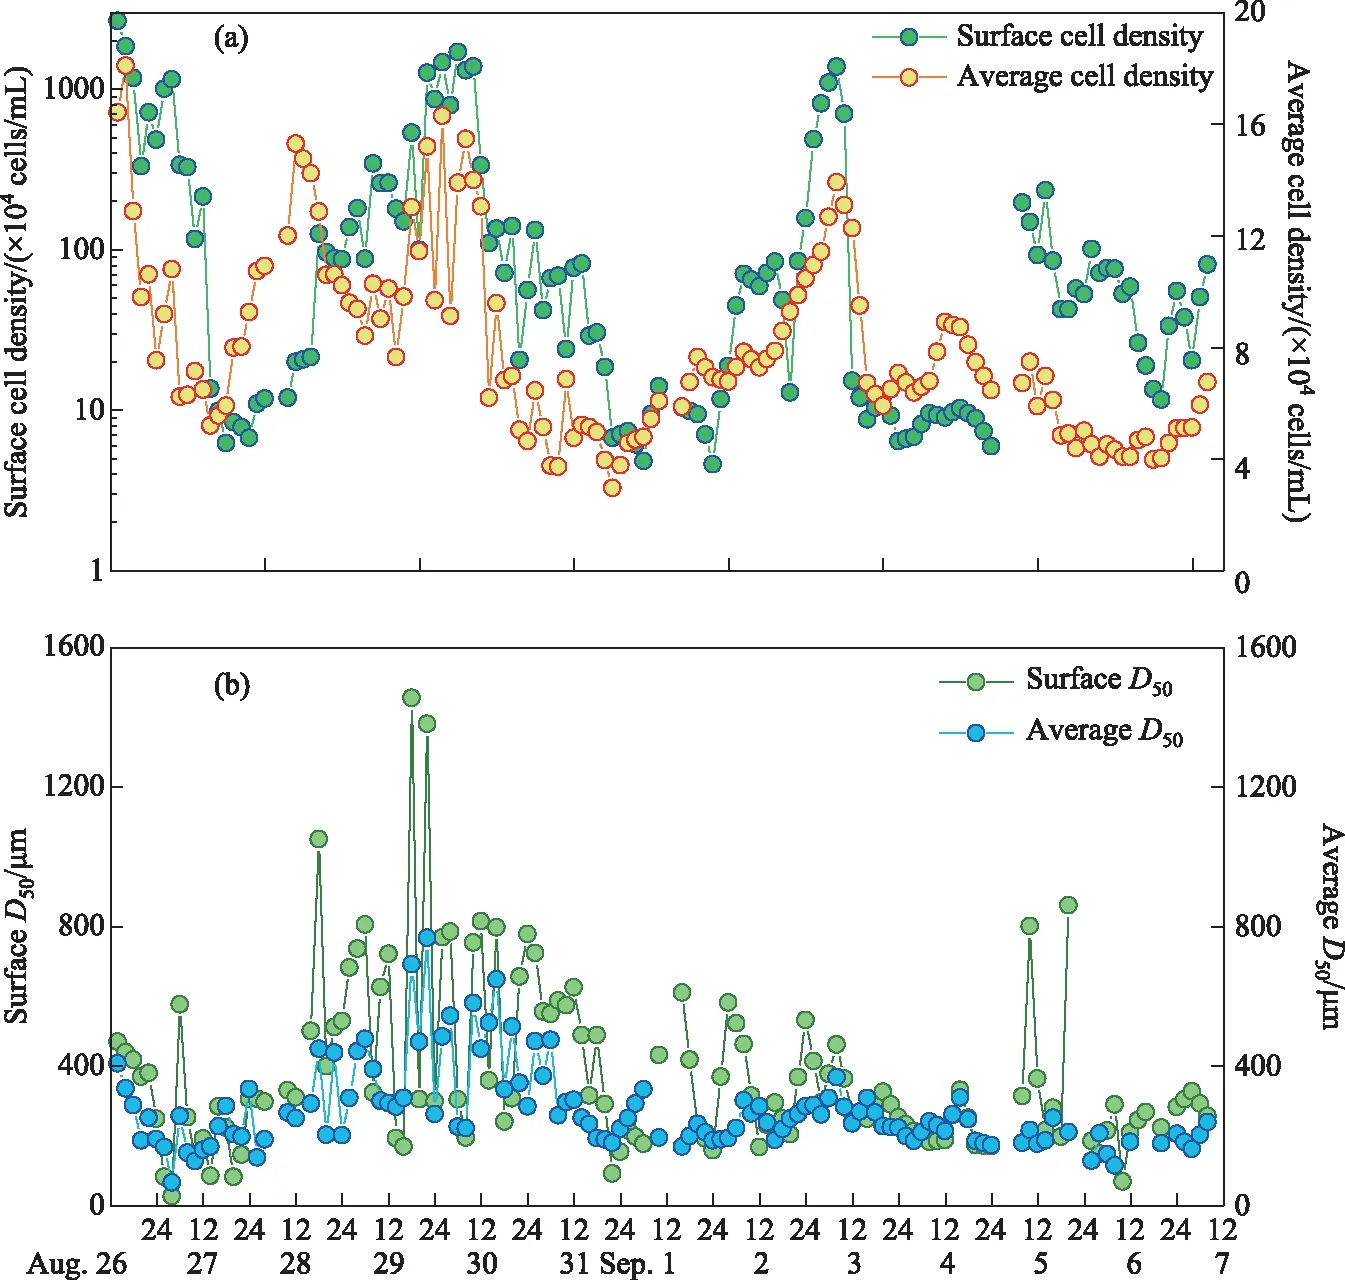
图4 研究期间微囊藻细胞密度(a)及群体粒径(b)的昼夜变化

图5 研究期间表层及整水柱不同形态微囊藻所占比例的昼夜变化
The proportion of each morphospecies out of allMicrocystisat the water surface and in the water column varied over time (Fig.5). SphericalM.wesenbergiiand irregularM.wesenbergiiwere initially dominant in the surface layer, but the proportions ofM.aeruginosaandM.ichthyoblabeincreased over time. The trends in the variations of the proportions ofMicrocystismorphospecies throughout water column can be summarized as follows: the dominant species wasM.ichthyoblabein the early stage of the study, followed by an increase in the proportions of irregularM.wesenbergiiandM.aeruginosa, and finally, dominance ofM.ichthyoblabe. The proportion of sphericalM.wesenbergiiin the water column gradually decreased during the study.
2.3 Relationships between Microcystis growth and environmental factors
Theinsitugrowth rates ofMicrocystisobtained by linear fitting are shown in Fig.6. Except for the growth rate fitting results on August 31st, September 1st, and September 3rd, the other linear fitting results were significant. Theinsitugrowth rate ofMicrocystisranged from -1.074 to 1.134 day-1.

图6 研究期间微囊藻原位生长率的变化规律


表1 研究期间微囊藻原位生长率与环境因子和表层藻密度的皮尔逊相关系数
AT, air temperature; L, light intensity; W, wind speed;Csur, surface cell density ofMicrocystis;Cave, average cell density ofMicrocystisthrough water column; T, turbidity.*Significant at 0.05 level (two-tailed).**Significant at 0.01 level (two-tailed).
2.4 Changes in colonial morphology of Microcystis
Fig.7 shows the correlations among the proportions of each morphospecies throughout the water column. The proportion ofM.ichthyoblabeout of allMicrocystisthroughout the water column was negatively (P< 0.001) correlated with that ofM.wesenbergii. The proportion ofM.aeruginosawas negatively (P< 0.001) correlated with that of sphericalM.wesenbergii, irregularM.wesenbergii, and the sum of those two morphospecies. There were significant negative correlations between the averageD50and wind speed and meanεin the water column (Fig.8).

图7 不同形态微囊藻所占比例之间的关系(蓝色点代表最大值,灰色点代表除最大值之外其余的值)
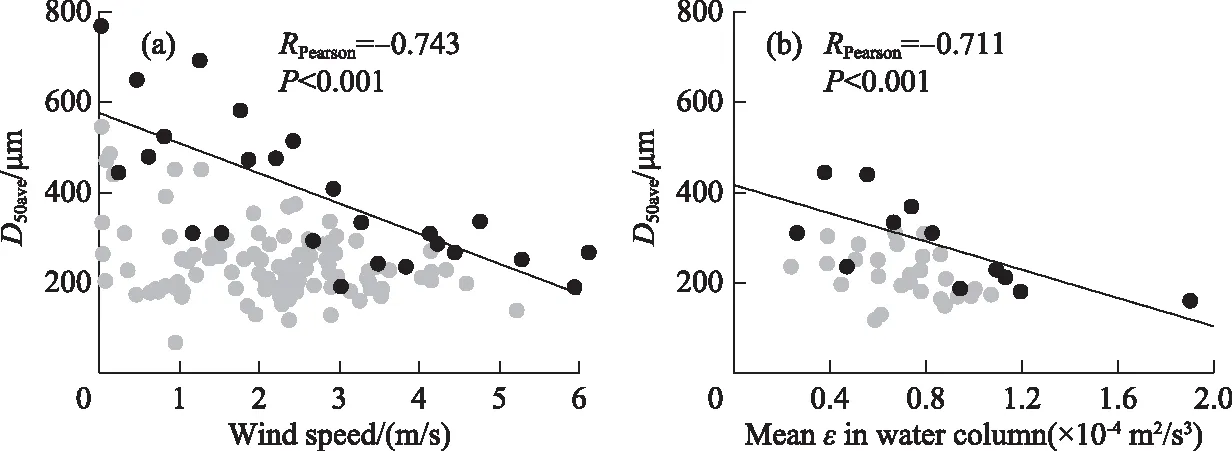
图8 整水柱微囊藻群体平均粒径与风速(a)和平均紊流耗散(b)之间的关系(深灰色点代表最大值,灰色点代表除最大值之外其余的值)
3 Discussion
The short-term dynamics ofMicrocystisbiomass in an enclosure ecosystem in a shallow lake was investigated in this study, with theinsitugrowth rate ofMicrocystisanalyzed by curve-fitting method. The horizontal migration ofMicrocystiswas avoided because of the enclosure ecosystem. TheMicrocystisbiomass was not affected by fish or zooplankton because fish were excluded from the enclosure and theMicrocystiscolonies in the enclosure ecosystem were too large (D50> 200 μm (Fig.4b)) to be predated on by zooplankton[32]. Nevertheless, the cell density ofMicrocystisin the 1-cm surface water layer was hundreds of times higher than the average cell density in the rest of the water column. Therefore, an accurate assessment of the thickness ofMicrocystisaggregation on the water surface is an important factor affecting the analytical results, but is almost impossible to achieve. In the current study, surface thicknesses of 0.5 cm, 0.4 cm, 0.3 cm and 0.2 cm were used in calculations. We found that there was no significant difference in the average cell density ofMicrocystisin the whole water column calculated with the surface thickness of 1 cm (ttest,P>0.05, Attached Tab.Ⅰ ). Therefore, theinsitugrowth rate calculated with the surface thickness of 1 cm was deemed reliable.
The majority of the calculatedinsitugrowth rates in the current study were within the range of 0.069 and 0.642 day-1(Fig.6), similar to the results measured by the FDC method in other studies[33-34]. Theinsitugrowth rate ofMicrocystisdetermined by Cao et al.[35]using specially designed chambers in Lake Taihu was far lower than that determined in our study. This is because they conducted their experiment in spring, when the temperature was much lower than that in the current study (conducted in August). Theinsitugrowth rate ofMicrocystismeasured by the FDC method by Wu and Kong[36]was between 0.2 and 0.3 day-1in August. However, if the FDC was substituted into formula 1 proposed by Tsujimura[33], the calculatedinsitugrowth rate could reach 0.6 day-1, a value similar to those obtained in this study. Similarly, Wilson et al.[37]reported that the growth rate of individualMicrocystiscolonies ranged from 0.2 to 0.4 day-1. Li et al.[38]found that the maximuminsitugrowth rate ofMicrocystisin Lake Taihu measured by the RNA/TOC method was 0.6 day-1. Although Stolte and Garcés[39]noted that most cyanobacteria have aninsitugrowth rate of >0.5 day-1, and many show growth rates of >1.0 day-1in the laboratory, theinsitugrowth rate ofMicrocystisin a shallow lake would be <0.6 day-1most of the time. However, some of theinsitugrowth rates calculated in the present study were between -0.3 and -0.5 day-1(Fig.6), indicating that there was a considerable decline in theMicrocystiseven in midsummer. Further studies on the mechanism ofMicrocystisdecline are expected to provide a new ideas for the control ofMicrocystisblooms.

In this current study, the dissolved phosphorus in the water column may have been absorbed by the rapidly growingMicrocystis, whose growth was promoted by increasing turbulence. Xie et al.[46]reported a similar result where the TDP concentration in a shallow lake (Lake Donghu, China) decreased due toMicrocystisgrowth. The large number ofMicrocystisaccumulated on the water surface will be under a state of nutrient stress[47-48]and photoinhibition[49-50], which are not conducive to its growth. Sufficient turbulence can causeMicrocystisto become evenly distributed in the water column, rather than aggregated at the surface[51-52]. The homodispersion ofMicrocystiscolonies in the water column is conducive to light transmission and nutrient uptake, both of which stimulateMicrocystisgrowth[53-54]. The existence of this pathway was verified by the negative relationship between theinsitugrowth rate and the surface cell density ofMicrocystisdetected in the current study (Tab.1). The nitrogen concentration was relatively high in our study, and was not significantly related to the growth rate ofMicrocystis.
This study showed a significant negative relationship betweenMicrocystiscolony size and wind speed during the 12 days of continuous monitoring, indicating that wind-induced turbulence in shallow lakes could break upMicrocystiscolonies. A similar negative correlation has been demonstrated in the indoor oscillating grids test carried out withMicrocystiscolonies by O’Brien et al.[11]. Zhang et al.[55]also found the length ofDolichospermumflos-aquaefilaments decreased noticeably with the increasing turbulence energy dissipation rates in chemostats with self-designed mixing propellers. The turbulence dissipation rate in the current study ranged from 2×10⁻⁵to 19×10-5m2/s3, indicating that turbulence at the above intensities could break upMicrocystiscolonies under natural conditions. According to the relationship between turbulence intensity and wind speed as well as water depth given by MacKenzie and Leggett[31], a turbulence intensity of 2.33×10⁻⁵m2/s3is equivalent to that produced by an average wind speed of 5.00 m/s in a 30-m depth reservoir. Li et al.[7]showed that the minimum turbulence intensity required to break aMicrocystiscolony was 0.020 m2/s3in a laboratory experiment using submerged impellers. The minimum turbulence intensity in the field would be much lower than that in a laboratory because the laboratory experimental time (30 min) was too short to observe disaggregation ofMicrocystisat lower turbulence intensities. Therefore, the disaggregation ofMicrocystiscolonies by wind-induced turbulence will occur continuously under natural conditions.
The process of colony formation by cell-adhesion is faster than that by cell-division[56]. Although the extracellular polysaccharides on the surface ofMicrocystiscolonies and cells are negatively charged[57-58], Chen and Lürling[59]showed that Ca2+, an important divalent electrolyte cation in the water, will counteract the electrostatic repulsion to promote the formation of largeMicrocystiscolonies by cell adhesion. Moreover, Qin et al[8]observed that the colony size ofMicrocystisincreased from 32.8 to 69.4 μm under the action of wind-waves, suggesting that strong turbulence could increase the chance of collisions betweenMicrocystiscolonies and cells. However, our field results did not show that strong turbulence promoted the adhesion ofMicrocystiscells or colonies to form larger colonies (Fig.8). This may be affected by the minimum-scale of turbulence. As shown in Fig.9, the maximum ofD50avewas limited by theLKunder different wind speeds. The opposite results between Qin et al.[12]and our study was because the colony size ofMicrocystiswas smaller thanLKduring their monitoring period. During August 28thto 29thand September 4thto 5thwhen the wind speed was less than 1.00 m/s,Microcystiscolonies aggregated at the water surface (Fig.4a), resulting in significantly increasedD50ave(Fig.4b). Other studies also found that individual colony size in the surface scums can be up to 2000 μm, but theD50is usually less than 800 μm[4,9,26]. Therefore, low turbulence would promoteMicrocystisadhesion to form large colonies, but the colony sizes does not exceed the minimum-scale of turbulence.

图9 整水柱微囊藻群体平均粒径与柯尔莫哥洛夫尺度之间的关系
No significant correlation was detected between the proportions of sphericalM.wesenbergiiand irregularM.wesenbergii(Fig.7c), although Li et al.[7]have shown that sphericalM.wesenbergiican change into irregularM.wesenbergiiunder the effect of turbulence. The lack of correlation may be caused byM.ichthyoblabecolonies continuously changing into sphericalM.wesenbergiicolonies, thus interfering with the relationship between sphericalM.wesenbergiiand irregularM.wesenbergii. However, both the proportions of sphericalM.wesenbergiiand irregularM.wesenbergiiwere negatively correlated with that ofM.aeruginosa(Fig.7d, e), indicating that whetherM.wesenbergiiwas deformed or not, their colonies were continuously dissolved and turned intoM.aeruginosa. The relationships found in the current study between the variousMicrocystiscolony morphotypes (Fig.7) support the morphology change model proposed by Xiao et al.[13]that the morphology ofMicrocystiscolonies changes over time. Other researchers[60-62], however, have shown that there are some differences in cell size, mucilage sheath, toxin production, and gene sequences in different morphotypes ofMicrocystiscolonies. In the future studies, it is necessary to measure the above characterization in the dynamic change ofMicrocystismorphotypes for verifying the hypothesis.
Recent studies have forecasted that global climate change will reduce average wind speeds on land[63-65], resulting in lower turbulence intensity in lakes. The results of this study imply that the colony size ofMicrocystisin lakes will increase with lower wind speeds, and the probability of surface accumulation will increase. Another prediction from global climate change is an increase in extreme weather events, such as tropical typhoons with high rainfall and winds, which may not only transport nutrients into lakes, but will also stir up sediments[66-68]. In our study, no relation between water column nutrient concentrations and wind speed was found, but at higher winds, such as during typhoons, dissolved inorganic nutrients at the sediment-water interface increased with wind[66]. Consequently, cyanobacterial biomass increased in the next month after tropical cyclones passed[66]. Hence, the availability of nutrients and a more favorable volume-to-surface ratio of smaller colonies due to colony breakage under high winds will promote biomass build-up, while during subsequent stable weather conditions likely larger sizedMicrocystiscolonies will accumulate at the water surface.
The aggregation ofMicrocystisat the water surface is not conducive to light penetration. Thus, other phytoplankton may receive even less light[13, 65]. Janatian et al.[69]indicated that a decrease in wind speed will shift phytoplankton groups fromr-selected coccal and colonial green algae and cyanobacteria toK-selected shade-adapted thin filamentous cyanobacteria in the large and shallow Lake Võrtsjärv. Therefore, decreasing wind speed will likely reduce phytoplankton biodiversity in eutrophic lakes, and buoyant cyanobacteria such asMicrocystiswill become more dominant.
4 Conclusions
Strong turbulence in field conditions promotedMicrocystisgrowth due to homodispersion ofMicrocystiscolonies and release of nutrient from sediment.Microcystiscolonies can be disaggregated by strong wind-induced turbulence in the field. The negative relationships betweenM.ichthyoblabeandM.wesenbergiiand betweenM.wesenbergiiandM.aeruginosain the proportion of morphospecies out of allMicrocystiswere found in this study, but more evidence is need to support the hypothesis that the morphology ofMicrocystiscolonies changes over time. On the basis of our results, we conclude that a climatically modulated decline in wind speed will promote the surface accumulation ofMicrocystisdue to larger colony formation.
5 Appendix
The Attached Table Ⅰ is seen in the electronic version (DOI: 10.18307/2021.0205).