基于团体标准T/CALAS 21—2017的Wistar大鼠微卫星DNA群体遗传质量分析
2021-01-02周佳琪光姣娜刘佐民岳秉飞
魏 杰, 左 琴, 王 洪,李 欢,周佳琪, 光姣娜,范 涛,刘佐民,付 瑞,岳秉飞
(中国食品药品检定研究院,北京102629)
Wistar rats were bred into an outbred stock by the Wistar Institute of the United States in the early 20th century. It is one of the earliest rat strains introduced to China, and also one of the most used laboratory rat strains. The development of outbred stock Wistar rats is due to its wide application in metabolism, toxicology, oncology and other fields[1-6].
Wistar rats are widely distributed in China.Different care environments and management levels affect characteristics of outbred stock rats from different sources[7].Maintaining the relative genetic stability of the population is critical to control genetic quality in outbred stocks[8]. Previous studies have analyzed genetic diversity in outbred stock rats in China, but the evaluation parameters and methods are different[9-11]. For a long time, there was no standard method for genetic monitoring for outbred stock rats. Until 2017, the Chinese Association for Laboratory Animal Sciences(CALAS) issued and implemented the association standard T/CALAS 21—2017:Laboratory animal -Methods for microsatellite markers of laboratory mice & rats, which provided a standard method for microsatellite detection of outbred stock rats for the first time[12].
In this study, the standard method was used to monitor the outbred stock of Wistar rats in our center. PCR products of 25 microsatellite loci were analyzed by the second-generation sequencing technology. The genetic diversity of the population in different periods was compared. Meanwhile, we also evaluated the applicability of the association standard T/CALAS 21—2017.
1 Materials and methods
1.1 Animals
Wistar rats have been bred in isolation for more than 20 years in Laboratory Amimal Center of National Institutes for Food and Drug Control(NIFDC)since they were introduced from the Japan Branch of the Charles River Laboratories International Corporation in 1994. The nucleus population which consisted of 40 pairs of Wistar rats can breed 2.5 generations per year according to the rotational mating system. In 2015 and 2019,twenty 30-week old Wistar rats (half males and half females) were randomly selected from the nucleus population of our center and named as group A and group B, respectively. All procedures are approved by NIFDC's Laboratory Animal Welfare Ethical Review Body (No. 21).The production license numbers of group A and group B are SCXK(Beijing) 2014-0013 and SCXK (Beijing) 2017-0005 respectively, and the quality certificates are 111251151100400574 and 111251191100401871,respectively.For address change of NIFDC in 2017,the rats were bred in Fengtai facilities in 2015 and Daxing facilities in 2019. Environmental control of the two facilities met all requirements of national standards.
1.2 Preparation of sample DNA
About 0.5 cm tail tips were cut for DNA extraction. Genomic DNA was extracted by the conventionalphenol-chloroformextractionmethod[13].The integrity,concentration and purity of DNA were detected by agarose electrophoresis and nanodrop microvolume spectrophotometer. TheA260/A280ratios should be between 1.8-2.0. The DNA concentration of samples was adjusted to 40-80 ng/μL and the sample DNA was stored at -20℃for later use.
1.3 Primers, amplification procedures[12]and main reagents
Twenty-five pairs of primers were synthesized according to the association standard T/CALAS 21—2017, and one of each pair was labled by fluorescein. PCR amplification was performed according to the method in T/CALAS 21—2017.The primer sequences are shown in Tab.3 of the standard. For T/CALAS 21—2017 standard-setting was done in our laboratory, so we used the same methods in 2015 before the standard was issued.
The main reagents we used were TaKaRa TaqTM(Hot Start Version from TaKaRa, Japan),agarose (Invitrogen, USA), and SangonTM50×TAE buffer(Sangon,China).
1.4 Sequencing for PCR products
The specificity of the amplification products was detected by agarose gel electrophoresis. Once the specificity of products was poor and unable to perform effective sequencing typing after experimental conditions optimized, the loci would not be perceived as effective markers to evaluate the genetic quality.
The stable products were sent to Beijing TSINGKE Biological Technology Co., Ltd. to conduct the second-generation sequencing. The fragment length of PCR products could be accurate to 1 base pair and then sequence typing was performed by the fragment length of each locus for the two groups.
1.5 Data processing and results evaluation
POPGENE VERSION 1.31 was used to process the genotyping data. The allele frequency,average effective allele number (Ne), observed heterozygosity, expected heterozygosity, average heterozygosity (H) of each microsatellite locus of the two groups were analyzed following by Hardy-Weinberg Equilibrium (HWE) test.According to T/CALAS 21—2017, if the average heterozygosity is between 0.5-0.7 and there is no significant difference between the expected heterozygosity and the observed heterozygosity by chi-square test (P>0.05),the population is a qualified outbred stock.Or if the population is in HWE, it also can be regarded as a qualified outbred stock.
The polymorphism information content (PIC)of each locus was processed by software Littleprogram 0.6. PIC (http://www. bbioo. com/)was used to evaluate the genetic information content of loci and the applicability of the association standard was further evaluated.
2 Results
There were no ideal results in D2mgh26 locus for most Wistar rats even after optimizing experimental conditions. So it was removed, while the remaining 24 microsatellite loci were stably amplified. On the 24 loci, 100 alleles and 69 alleles were obtainedfromgroupAand group Brespectively.
2.1 Genetic analysis of group A Wistar rats
The average heterozygosity of group A was 0.574, the average PIC was 0.541, and thePvalue was 0.052. The chi-square test results showed no significant difference between the expected heterozygosity and the observed heterozygosity (P>0.05). The genetic parameters of group A were shown in Table 1.
2.2 Genetic analysis of group B Wistar rats
The average heterozygosity of group B was 0.447, the average PIC was 0.393, and thePvalue was 0.066. The chi-square test results showed no significant difference in expected heterozygosity and observed heterozygosity (P>0.05). The genetic parameters of group B were shown in Table 2.
3 Discussion
3.1 Population genetic quality analysis of Wistar rat in group A and group B
According to association standard T/CALAS 21—2017, when the average heterozygosity of an outbred stock is between 0.5 and 0.7 and there is no significant difference between the expected heterozygosity and the observed heterozygosity by chi-square test, it can be regarded as a qualified outbred stock. In terms of the results, group A Wistar rats met the evaluation criteria of outbred stock, while the average heterozygosity of group B was slightly lower than 0.5, indicating that group B did not meet the standard although there was no statistical difference between the expected heterozygosity and the observed heterozygosity of group B.
Average heterozygosity is an important parameter to evaluate the genetic quality of outbred stock. When the average heterozygosity is lower than 0.5, the group will be at the risk of an inbreeding trend. When it is higher than 0.7, the group will tend to be wild[14].Therefore,the analysis of average heterozygosity and HWE test couldprovide references for genetic quality control of outbred stock. However, the parameters are also affected by the effective population size, the number of tested animals, the number of loci and other factors[15]. Once the influencing factors change, the results will change accordingly. In this study, the average heterozygosity of group B Wistar rats was lower than 0.5, but there was no abnormality in the HWE test. The effective size of the Wistar nucleus population was not large enough,this may be the main reason for an inbreeding trend.What's more, the numbers we tested only accounted for 1/4 of the population. Group A and group B were from the same population but at different periods. Group B has been bred more than 20 generations than group A. When there is no exogenous gene introduced, the gene abundance is likely to descend,and the heterozygosity tends to be lower than the former.

表1 A组Wistar大鼠的遗传参数Table 1 Genetic parameters of group A Wistar rats
For a better evaluation of the population, it is necessary to calculate the inbreeding coefficient combining pedigree records and expand the sample size. Of course, continuous monitoring of the population will be the best way to discover if there is an inbreeding trend.
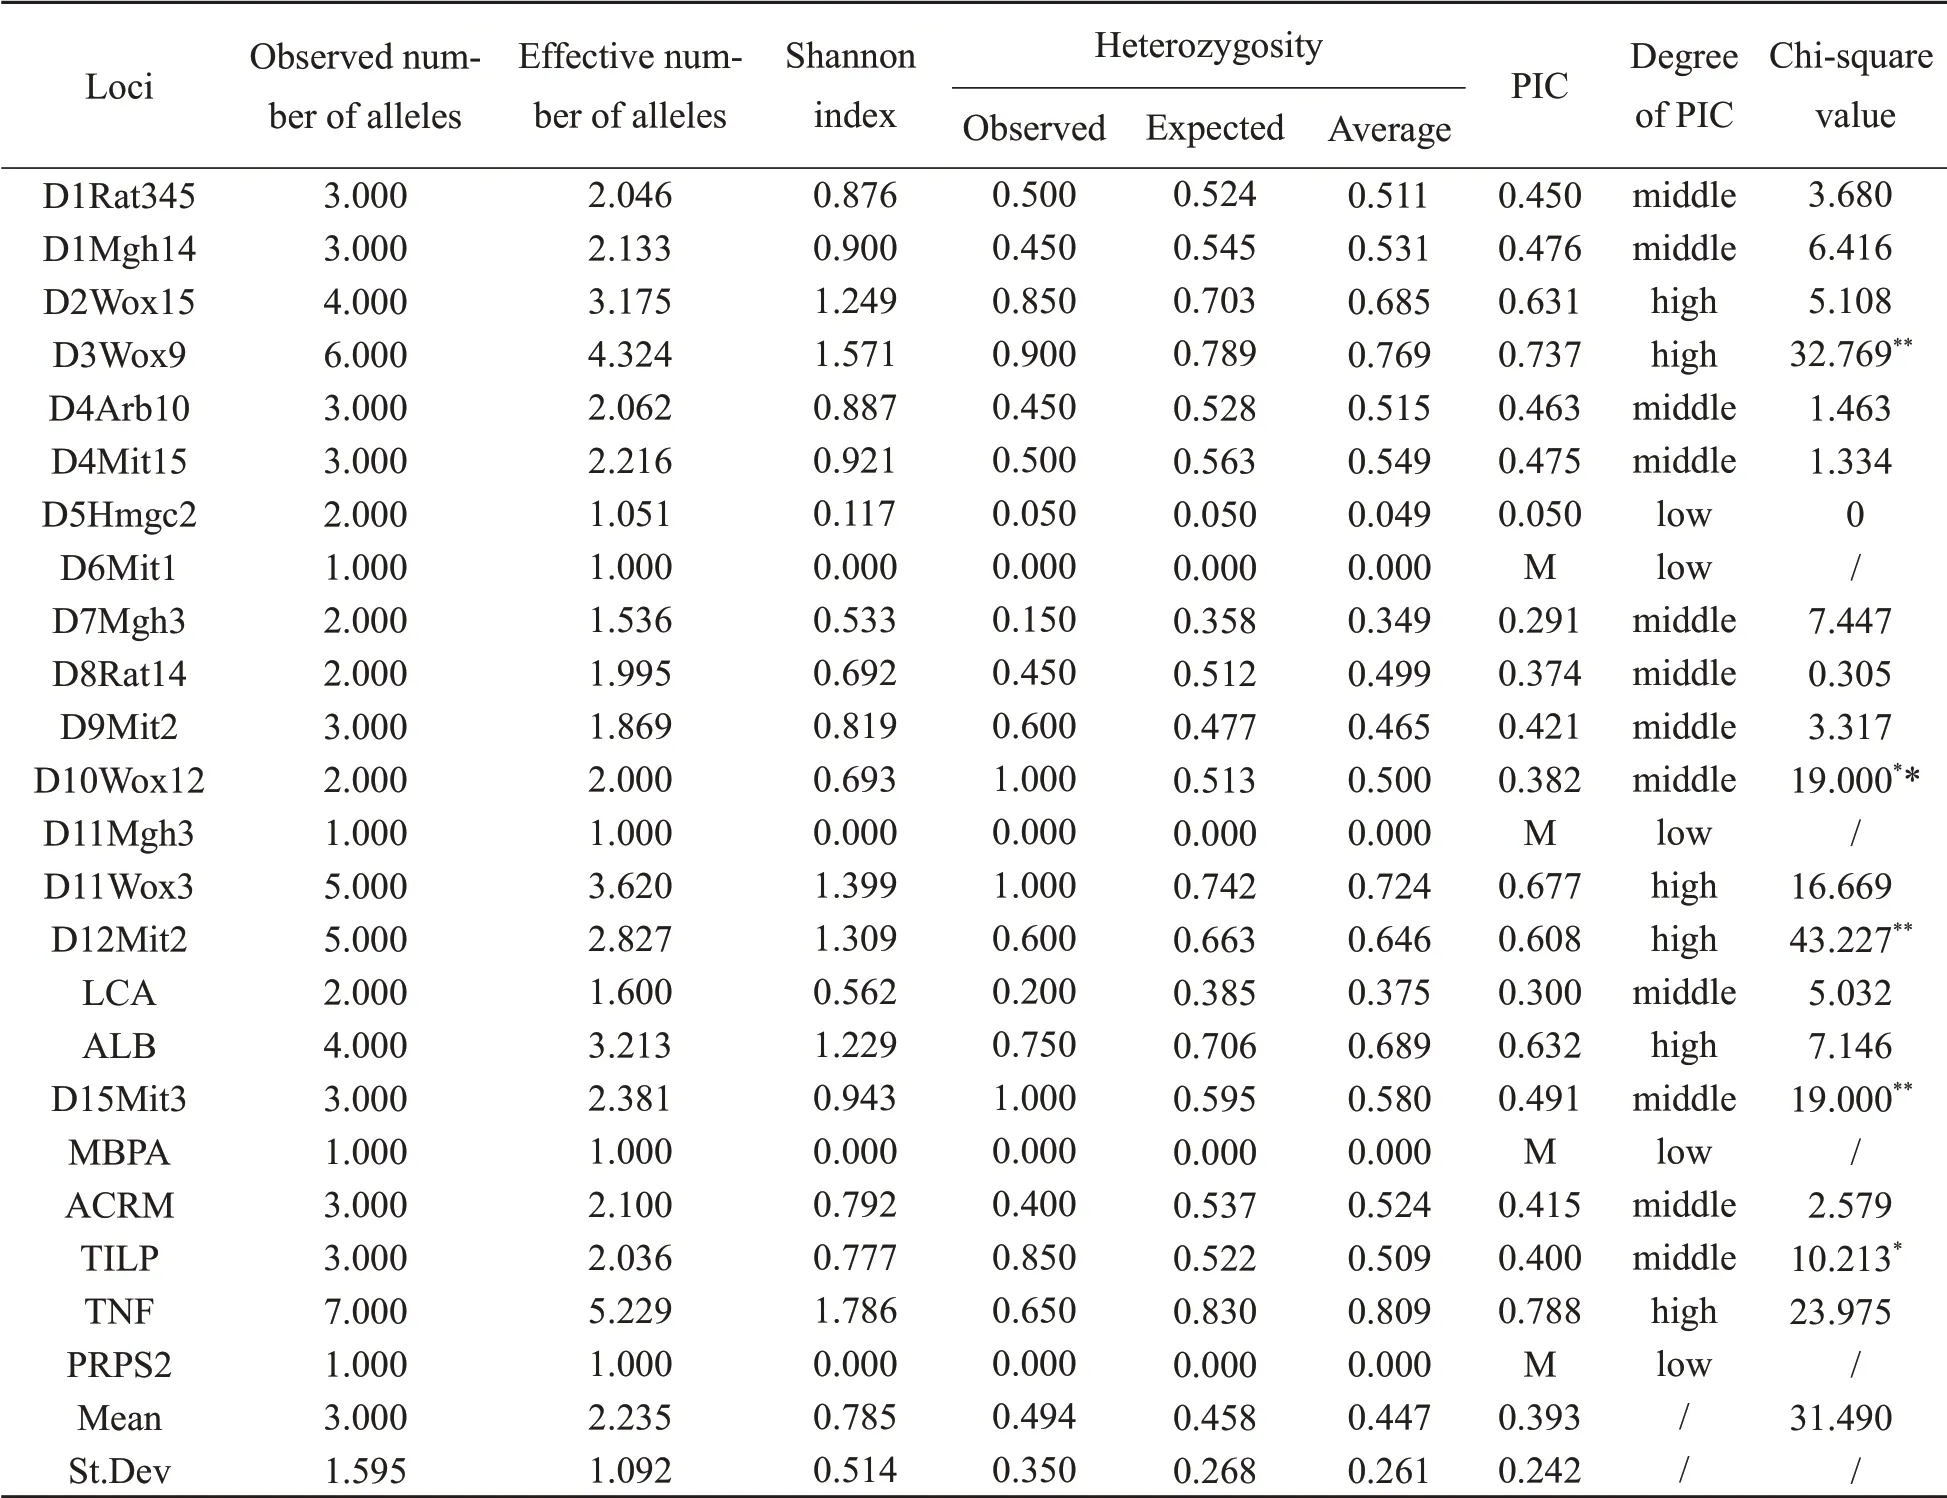
表2 B组Wistar大鼠的遗传参数Table 2 Genetic parameters of group B Wistar rats
3.2 Genetic diversity analysis of Wistar rats in group A and group B
The Shannon index, average PIC and other parameters of group B Wistar rats were lower than those of group A. This difference was mainly based on the number of alleles obtained from the population. From 2015 to 2019, the number of alleles in the population was reduced from 100 to 69,which resulted in the decline of genetic diversity.
PIC is an indicator of locus polymorphism.When PIC is above 0.5, the locus shows highly polymorphic and can provide rich genetic information. When PIC is below 0.25, the locus presents low polymorphic and provides poor genetic information.When PIC is between 0.25 and 0.5,the locus shows moderately polymorphic, which can provide reasonable genetic information[16]. When evaluating the genetic diversity of outbred stock,highly polymorphic loci should be selected as far as possible.
In addition, changes in loci polymorphism between the two groups also reflected population genetic diversity. There were 15 highly polymorphic loci, 8 moderately polymorphic loci and 1 lowly polymorphic locus in group A. Only D2Wox15 locus showed homozygous and lowly polymorphic. After 4 years, the highly, moderately and lowly polymorphic loci in group B were 6, 13 and 5 respectively.Compared with group A,5 lowly polymorphic loci (D5Hmgc2, D6mit1, D11Mgh3,MBPA, and PRPS2) were increased in group B,and 4 of them showed monomorphism excepting D5Hmgc2.
In the study, D2Wox15 in group A showed monomorphism, while high polymorphism in group B. After 4 years, if the high polymorphism locus turns to monomorphism, we could take it as population degradation because no exogenous gene is introduced. Now the case is just on the contrary.The genetic characteristics of the rats in D2Wox15 are likely to moderate polymorphism, and the monomorphism also exists. The Wistar population consisting of 40 pairs is not large, and in 2015, the rats in group A were all monomorphic.
3.3 Applicability analysis of T/CALAS 21—2017
Now, the genetic quality control of outbred stock is still in its early stage in practice.At the end of the 20th century, the quadric optimization method played an important role in the genetic quality control of outbred stock, but the actual operation was complicated. It requires the data of mandibular measurement, isoenzyme typing,physiological and biochemical determination of the population and so on, thus, this method is not popular[8]. The national standard GB14923—2010 implemented in 2010, proposes that outbred stock should be tested once a year, and recommends biochemical marker detection and microsatellite marker detection as methods for outbred stock monitoring. The biochemical marker method comes from GB14927.1—2008, while the microsatellite marker methods lack established standards or regulations[17]. Before this standard, many scholars also used molecular biology methods to analyze the genetic quality of outbred stock rats, but there was no unified evaluation system[18].
In 2015, the State Council issued theReform Plan for Deepening Standardization Work, which pointed out the lack of legal effects of association standards in China clearly. In 2017, the Ministry of Civil Affairs issued theRegulations on the Management of Association Standards (Trial Implementation), and in 2018 the newly revisedStandardization Law of the People's Republic of Chinawas formally implemented. All these documents provided a clear legal status to association standards[19]. T/CALAS 21—2017 was developed and implemented under such background.
The microsatellite marker method has the advantages of a wide genetic profile, high throughput and high sensitivity. The chromosome coverage rate of the microsatellite marker method in T/CALAS 21—2017 reaches 100%, while it is less than 50% in GB14927.1—2008. Furthermore, the microsatellite marker method in T/CALAS 21—2017 only needs a few tissue samples of tail or ear for detection,which is more in line with the welfare and ethical requirements of laboratory animals than the method in GB14927.1—2008,which needs to sacrifice the animals to collect samples. By using the association standard, we also find some areas for improvement. For example, once the result in our study does not conform to that in the HWE test,there will be no conclusion on the genetic quality of the population. Wu et al.[14]considersed average heterozygosity more important, and Beijing local standard DB11/T 1804—2020 for minipig also took the parameter as the first evaluate criterion[20].However, HWE test results are the criterion for evaluating genetic quality of outbred stock according to the national standard GB14923—2010.
The association standard T/CALAS 21—2017 has made up for the absence of a standard evaluation method on the genetic quality of outbred stock caused by the difficulty and long period of national standard project approval. But it is still a common problem of highlighting formulation and neglecting implementation for association standards[19]. Formulation, implementation, use,feedback, revision and improvement is an intact closed-loop standardization system. Through continuous monitoring of outbred stock by T/CALAS 21—2017 and results from feedback to animals breeding and production, the management level of outbred stock rats will be further improved.
