Kinetic modeling of high-temperature oxidation of pure Mg
2020-12-18FngzhouXingLijunZhng
S M,Fngzhou Xing,N T,Lijun Zhng,∗
a State Key Laboratory of Powder Metallurgy,Central South University,Changsha,Hunan 410083,P.R.China
b Max-Planck-Institut für Eisenforschung GmbH,Max-Planck-Straße 1,40237,Düsseldorf,Germany
Received 14 June 2019;received in revised form 24 December 2019;accepted 26 December 2019 Available online 2 June 2020
Abstract A variety of experimental tracer diffusivities of Mg and O in magnesium oxide available in the literature were firs assessed.Atomic mobilities including bulk and short-circuit diffusion of Mg and O were then obtained by means of the CALPHAD(Calculation of Phase Diagram)approach.Afterwards,the diffusion-controlled kinetic model of oxidation in a gas-MgO-Mg environment was developed based on the moving boundary model and Fick's law,coupling with the modifie thermodynamic description of MgO.A mathematical expression for parabolic rate constant kp of the oxide scale was derived for magnesia and correlated with the thermodynamic and diffusion kinetic information.The evaluated kp results were in line with the experimental data.Finally,the oxidation process of pure magnesium at 673 K was model-predicted,and the predicted evolution of the oxide thicknesses agreed very well with the experimental data.It was indicated that the grain boundaries diffusion of magnesium cations predominated the high temperature oxidation process.© 2020 Published by Elsevier B.V.on behalf of Chongqing University.This is an open access article under the CC BY-NC-ND license.(http://creativecommons.org/licenses/by-nc-nd/4.0/)Peer review under responsibility of Chongqing University
Keywords:MgO;Diffusion;Oxidation;Atomic mobility;CALPHAD;Wagner's model.
1.Introduction
Magnesium alloys possess excellent properties including low density,high specifi strength and rigidity,good damping and cutting performance,great degradation behavior and biocompatibility,and thus serve as the key materials for realizing the lightweight of automobiles and biomedical applications[1-4].However,the corrosion behavior limits the practical applications of magnesium alloys[5-7].In order to improve the serviceability of magnesium alloys,it is crucial to study the oxidation of pure magnesium and even magnesium alloys,which will be helpful for comprehensive understanding of their oxidation mechanisms.
So far,there have been several experimental measurements of the oxidation process of pure magnesium[8-12].However,it is very difficul to describe the oxidation behaviors over the wider temperature range through purely experimental measurements due to their relatively high time/money cost.Under this situation,some underlying modeling/numerical simulation techniques are highly needed to describe the oxidation process.In actual,the oxidation process of metals is a really complex one,involving the chemical reactions between metal and oxygen,as well as diffusion of cations and anions in oxides[13].Considering the fact that the rate of chemical reactions depends on the diffusion of ions,the overall oxidation rate is mainly controlled by the mass transport through oxides.The general Wagner's model[14]provides an understanding of mass transport processes occurring within a growing oxide scale,thereby leading to a capacity to predict the effect on the changes of the oxidation rate along with the temperature.In the Wagner's model[14],the complex process,including the evolution of microstructures due to diffusion of ions,grain growth,defect annihilation,spallation,etc.,was simplified and the parabolic equation was derived by considering only the diffusion-controlled process.It should be noted that the parabolic rate constant in Wagner's model should generally depend on both thermodynamic and kinetic parameters,including oxygen activity and bulk diffusion coefficient Very recently,Xing et al.[15]derived an equation for parabolic oxidation rate constant of Ni accounting for various diffusivities within the Wagner's framework.However,in Ref.[15],the empirical degree of defect ionization and vacancy concentration were introduced to replace the thermodynamic factor,which is not a general treatment for different metals/alloys.Thus,there is a need to correlate the parabolic rate constant with the general thermodynamic and kinetic information.
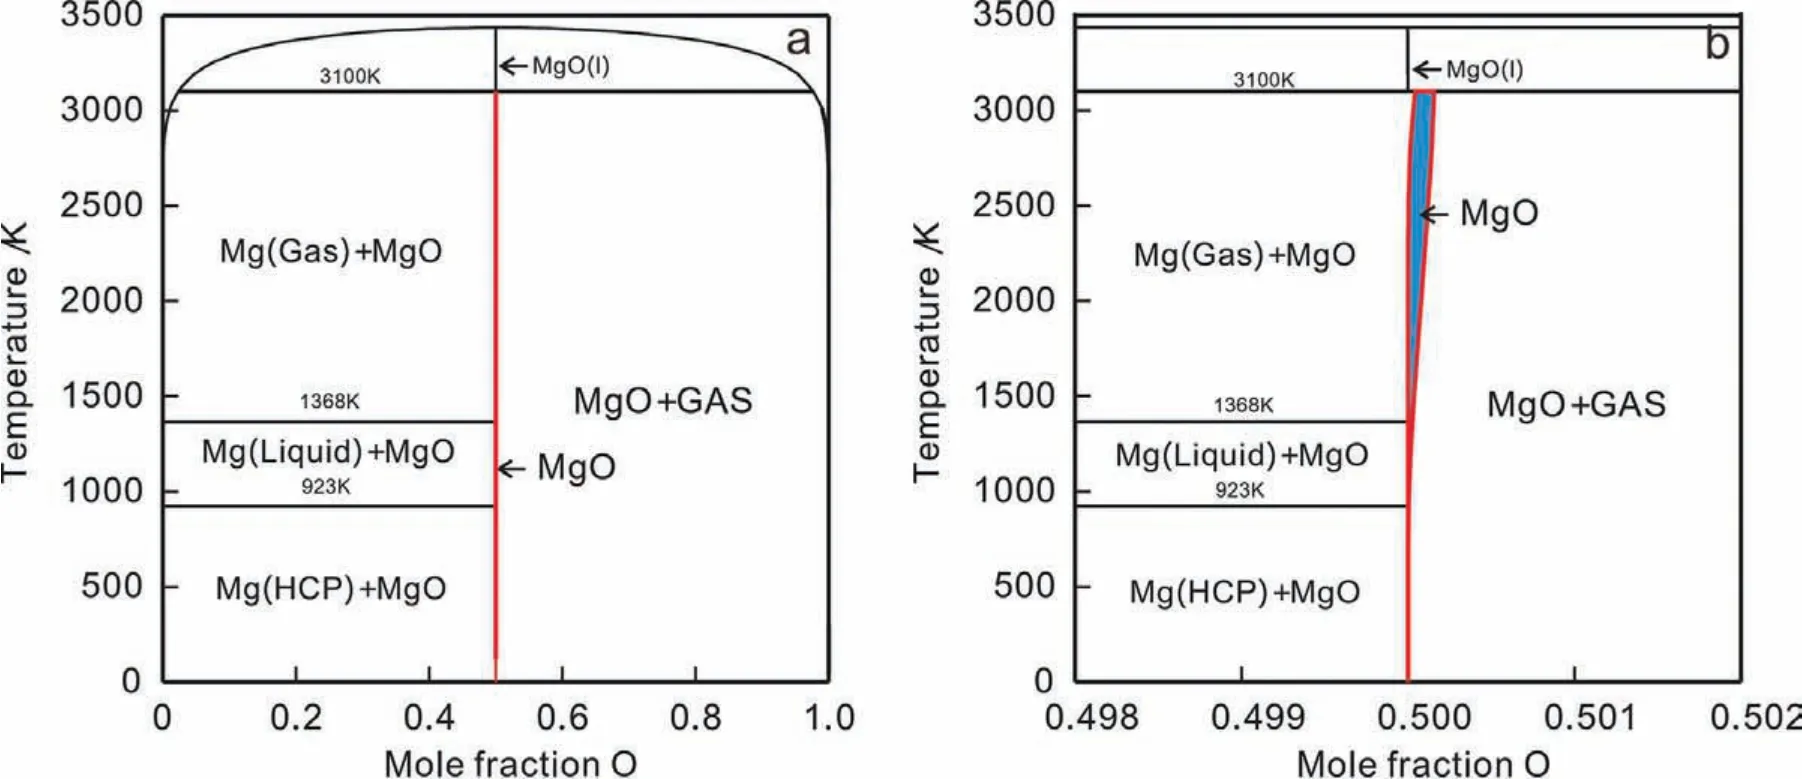
Fig.1.(Color online)Calculated phase diagram of binary Mg-O system:(a)over the entire composition range;(b)in the vicinity of MgO compound,according to the thermodynamic descriptions originally from Hallstedt[16]together with the modifie thermodynamic descriptions for MgO in this work.
Up to now,only one set of thermodynamic descriptions[16]for the Mg-O binary system exist in the literature,while no relevant kinetic descriptions have been reported.The Diffusion-Controlled Transformation(DICTRA)software package,operating under the Calculation of PHAse Diagram(CALPHAD)framework,has been widely employed to establish the atomic mobility databases for different materials,from which various diffusivities of composition and temperature dependence can be predicted together with the reliable thermodynamic databases.During the past several years,DICTRA has been employed to develop the atomic mobility descriptions of the oxides for different metals,including pure Fe[17,18],Cr[19]and Al[20],as well as some complex oxides LaCoO3-δ[21].
Consequently,the oxidation process of pure Mg at high temperatures is chosen as the target in the present work.The major objectives are:(i)to perform critical review of all the experimental tracer diffusivities of Mg and O in MgO in the literature,and obtain the self-consistent atomic mobility descriptions of O and Mg in MgO;(ii)to derive a mathematical expression for growth rate constantkpof oxide scale by fully considering diffusion and thermodynamics in metal and oxygen ions in the framework of the Wagner's theory;and(iii)to predict the growth process of magnesium oxide during oxidation of pure magnesium,and clarify the oxidation mechanism of pure magnesium.
2.Literature review on various diffusivities in MgO
The diffusion behavior of magnesium cations in MgO has been extensively studied during the past years[22-29],and different types of diffusion coefficient of ions in Mg-O system are critically reviewed in the following and concisely summarized in Table 1.
The self-diffusivities of magnesium cations in MgO single crystals over the temperature range of 1400∼1600°C were firs measured in 1957 by Lindner and Parfit[22],who used the isotope exchange technology with the isotope28Mg.In their experiments,the impurities in magnesia were ignored,thus the magnesia was regarded as ideal crystals and the diffusion was intrinsic.They found that the activation energy of magnesium diffusion at low temperatures(<1400°C)was lower than that at higher temperature(>1400°C).After that,several further investigations on diffusion of magnesium in pure MgO single crystals were reported by Harding et al.[23,24]and Wuensch et al.[25].Harding et al.[24]compared their experiment data with those by Lindner and Parfit[22]and found that self-diffusion of magnesium in MgO is sensitive to the impurities and easily affected by short circuit diffusion at low temperatures.Wuensch et al.[25]employed26Mg rather than28Mg to measure the self-diffusion coeffi cients in an argon atmosphere.The experimental data measured by Harding et al.[23,24]are thus different from those by Lindner and Parfit[22].Moreover,the initial materials in the study of Wuensch et al.[25]contained even more impurities than those used by Lindner et al.[22],resulting in the inaccurate experimental self-diffusivities by Wuensch et al.[25].
In the aspect of short circuit diffusion of magnesium ions in MgO,Sakaguchi et al.[27]utilized26Mg to measure the diffusion coefficient of magnesium in single-crystal MgO,taking both bulk and dislocation diffusion into consideration.Orman et al.[28]measured the grain boundary diffusion coefficient of magnesium in polycrystal MgO at 2273 K.However,their experiments were under the condition of high pressure from 15 to 25 GPa.Recently,the molecular dynamic simulations were carried out by Landuzzi et al.[29]and the grain boundary diffusion coefficient of Mg and O in MgO were also evaluated.
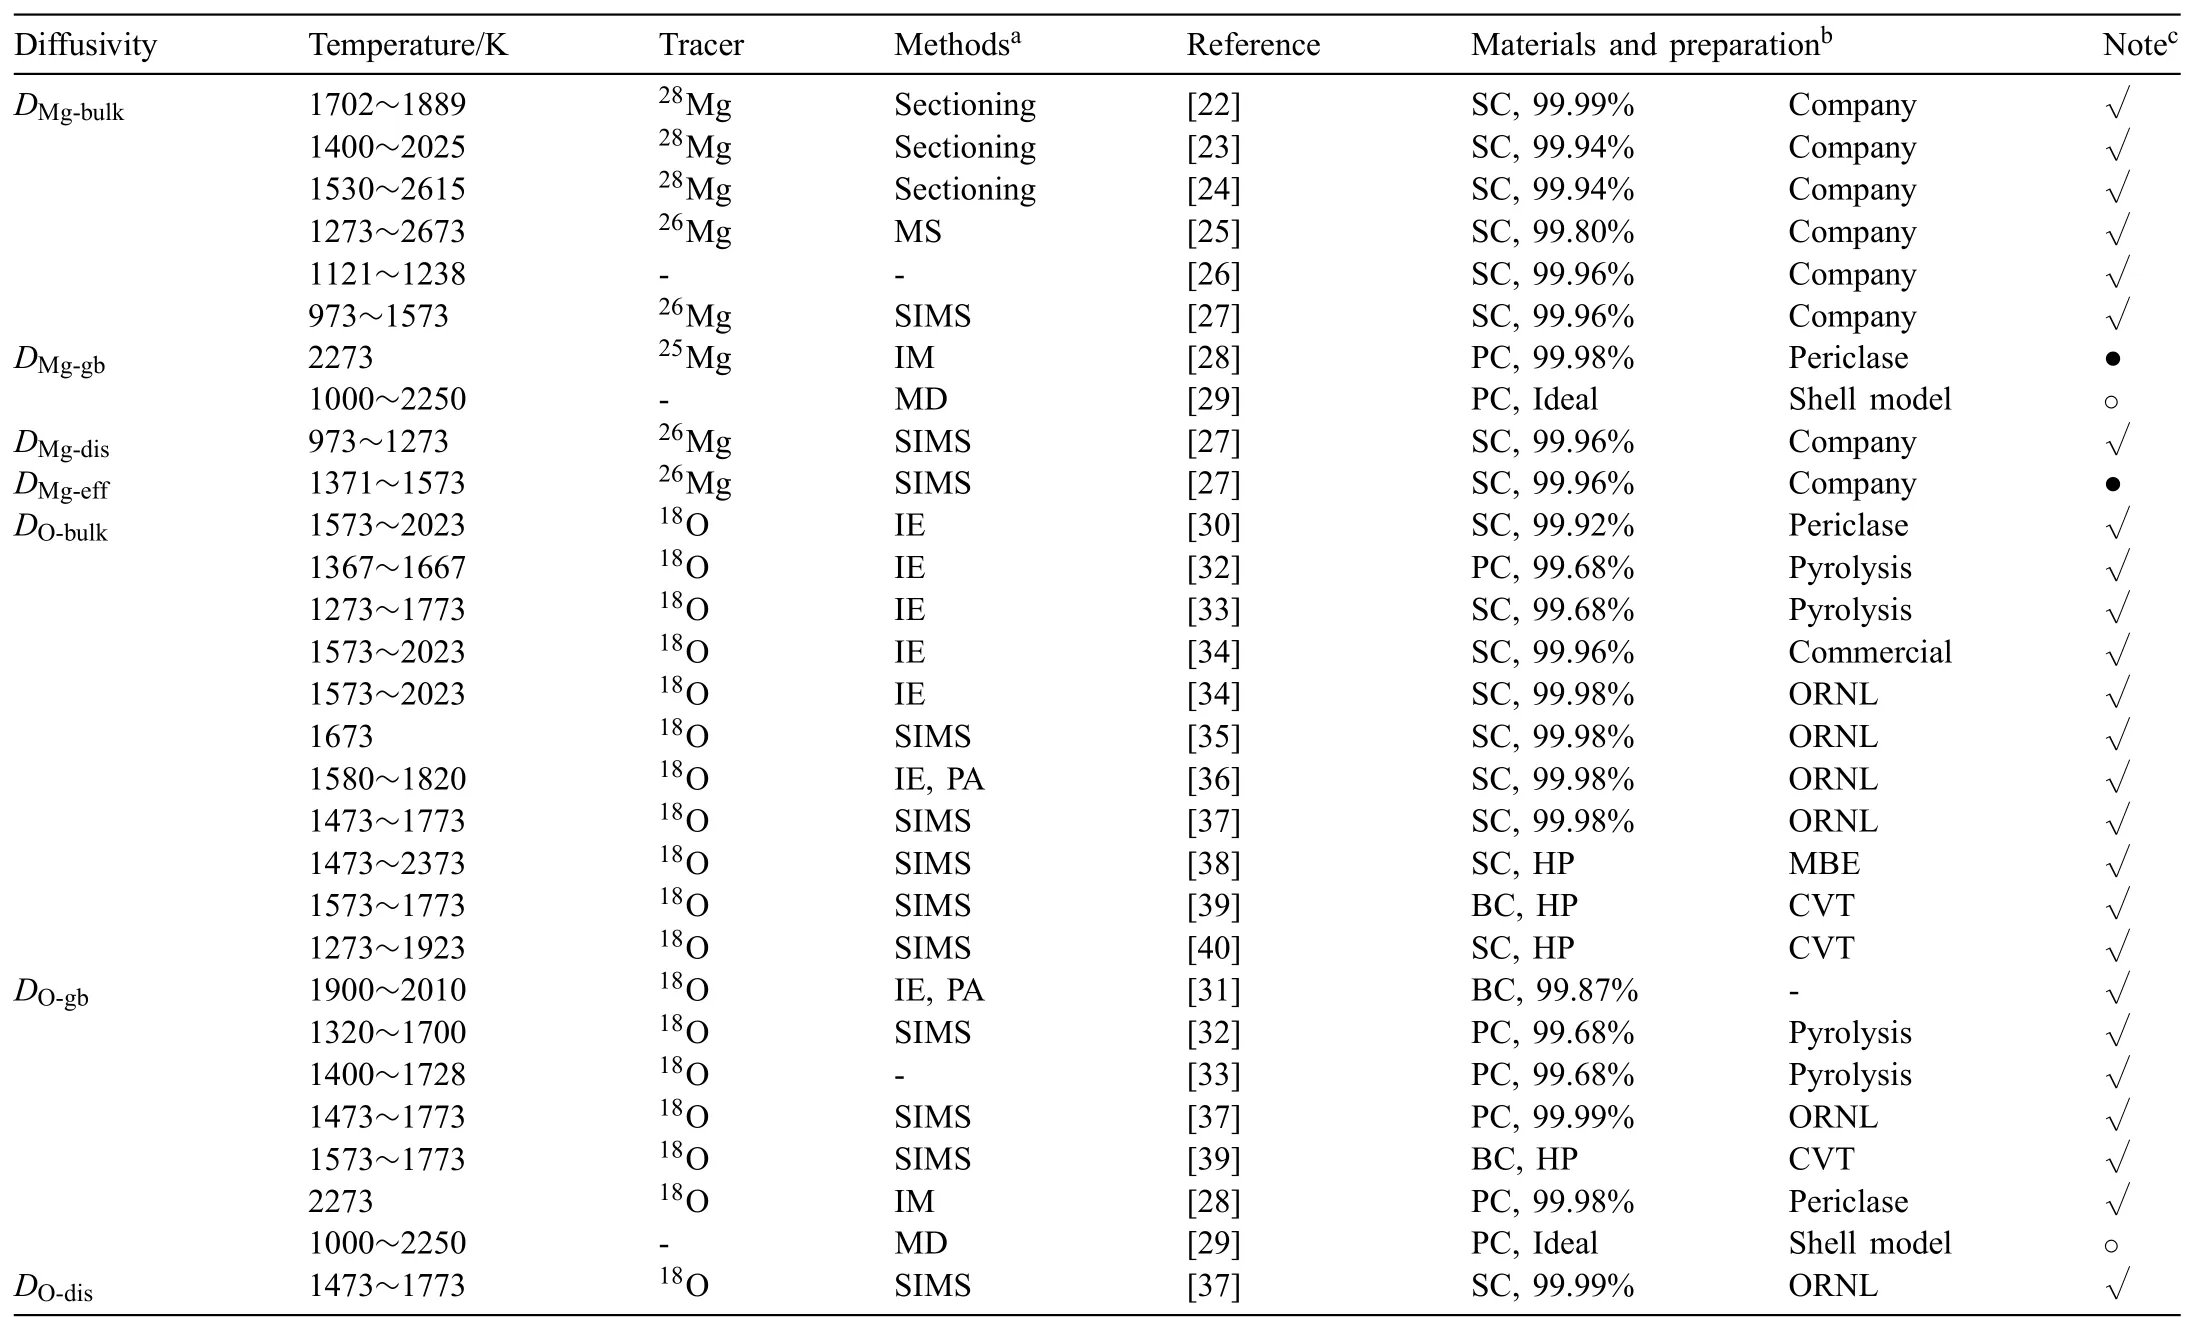
Table 1Summary of all the experimental diffusivities of Mg and O in MgO available in the literature
Up to now,there have been many studies on diffusion coefficient of oxygen in MgO available in the literature[28-40].In 1960,Oishi and Kingery[30]firs measured the selfdiffusion coefficient of oxygen anions in single-crystal MgO,and their measured self-diffusion coefficient of oxygen are smaller than those of the magnesium cations by two orders of magnitudes.However,their samples comprise a small amount of impurities.In 1971,the grain boundary diffusion coeffi cients of oxygen in MgO with bicrystals were measured by Mckenzie et al.[31]by means of Fisher's model[41].Their results indicated that grain boundary diffusion would dominate predominantly the mass transport property in polycrystalline MgO at low temperatures.After that,the self-diffusion coefficient of oxygen were determined by Hashimoto et al.[32]in polycrystalline MgO by isotope exchange technology and they concluded that the diffusion of oxygen along the grain boundaries are relatively faster than the bulk diffusion of oxygen.One year later,Shirasaki and Hama[33]reported that the self-diffusivities of oxygen in loosely-sintered and wellsintered polycrystalline MgO,following the same approach by Hashimoto et al.[32].Thereafter,Oishi et al.[34]measured two groups of the oxygen diffusivities in 1983,and the obvious differences between diffusion mechanisms at different temperatures were observed.They claimed that diffusion was impurity-insensitive at high temperatures while structuresensitive at low temperatures,i.e.,that the existence of dislocations and subgrains could increase the diffusion coeffi cients,which is actually in line with the diffusion mechanism of magnesium in MgO.In the same year,Henriksen et al.[35]determined the diffusivities of oxygen in pure,doped and deformed samples at 1673 K by means of the secondary-ion mass spectrometer(SIMS)method,and explained that the rate of oxygen diffusion in deformed materials was about fourfold larger than that in undeformed samples.Meanwhile,Reddy and Cooper[36]measured the diffusion coefficient of oxygen in MgO in the temperature range of 1580 to 1820 K.Then,18O was used as a tracer element in single crystals,deformed single crystals and polycrystals of MgO,and thus bulk,dislocation and grain boundary diffusion coefficient of18O were measured by means of SIMS method by Dolhert[37].In 1994,Yang and Flynn[38]measured the diffusivities of oxygen anions using high-purity magnesium oxides produced by molecular beam epitaxy(MBE),which is smaller than others by about two orders of magnitude.After that,Liberatore and Wuensch[39]measured the diffusion coefficient of oxygen in bulk and grain boundaries by using MgO bicrystals with high purity prepared by chemical vapor transport(CVT)and concluded that the enhancement of diffusivities was more conspicuous along grain boundaries with higher energy.In 2002,Yoo et al.[40]evaluated the prefactor and activation energy of oxygen diffusion coefficient in larger range of temperature and the smaller standard deviations were observed.In 2015,the molecular dynamic simulations were also applied by Landuzzi et al.[29]to evaluate the grain boundary diffusion coefficient of oxygen that deviate largely from the experimental data[32,33,37,39].
3.Model descriptions
3.1.Thermodynamic model
The Mg-O phase diagram was reported by Wriedt[42]in 1987.It was pointed out by Wriedt[42]that MgO is not an ideal stoichiometric compound but with a very narrow homogeneity range.However,the specifi homogeneity range has never been reported so far.In 1993,Hallstedt[16]assessed the thermodynamic description of the Mg-O system by means of CALPHAD approach.Hallstedt[16]firstl took the solubility of oxygen in liquid magnesia into account,while the solubility of oxygen was not considered in the solid magnesia,and MgO was thus treated as an ideal stoichiometric compound.In addition,the site occupations of ions in lattice were regular,so the formula unit of solid magnesia with two sublattices was written as(Mg2+)1(O2−)1,where the firs sublattice denotes the octahedral interstices and the second one was occupied by oxygen anions in a face-centered cubic(fcc)lattice.It should be noted that the vacancies were not considered in the formula unit,and thus the MgO phase was treated as a rigid stoichiometric phase.
Although the homogeneity range of MgO is too narrow to be measured accurately,it should not be neglected in the study of diffusion kinetics.The similar treatment in our previous studies on binary Co-Si[43]and Al-O systems[20]is also applied to the present Mg-O system,i.e.,that very tiny homogeneity range can be introduced in MgO by modifying its thermodynamic descriptions but keeping the deviation of the invariant reaction temperatures within 2 K.Based on the thermodynamic description by Hallstedt[16],the new sublattice model(Mg2+,Mg3+,Va)1(O2−)1was employed for MgO by introducing the magnesium cations with high valence to maintain the electro-neutrality.As a result,the molar Gibbs energy of MgO phase can be written as:whereis site fraction ofXin theisublattice,0GA:Bis the mole Gibbs energy of the end member of compound,andGexthe excess Gibbs energy.In this work,0GMg3+:O2−=0GMg2+:O2−+70000,0GVa:O2−=0 andGex=0 were set,while the other parameter0GMg2+:O2−was kept as the reported values in Hallstedt's original work[16].

Based on thermodynamic descriptions originally from Hallstedt[16]together with those for MgO modifie in this work,the phase diagram of binary Mg-O system was calculated,as presented in Fig.1.As can be seen in the enlarged part of the Mg-O phase diagram,a very narrow homogeneity range exists in the MgO compound now.With the derived thermodynamic descriptions for MgO in Eq.(1),the site fractions of vacancy at the stoichiometric composition of MgO under the condition ofP(O2)=0.21 atm was computed and plotted in Fig.2(a).Moreover,the corresponding thermodynamic factor and chemical potential of O in MgO as a function of O compositions at 673 K were also calculated and shown in Fig.2(b).As can be seen in Fig.2,the site fraction of vacancy increases as the temperature increases,while the chemical potential profil indicates that the direction of driving force is consistent with the concentration gradient.Moreover,as the mole fraction of oxygen is close to 0.5,the thermodynamic factor will approach to the infinit.Under this circumvent,the so-called average thermodynamic factor as proposed in[43]is also introduced here.The detailed discussion can be referred to the Appendix.
3.2.Diffusion kinetic model
The oxidation rate of magnesium at high temperatures is controlled by diffusion[44],which is driven by the gradient of chemical potential.Based on the °Agren's theory,the flu of the ions in the lattice-fi ed reference frame is given as[17]

whereμiis the chemical potential,V0the volume per mole of anion sites.MiVais atomic mobility of componentijumping from one site to a neighboring site and has the form:MiVa=M0exp(-Q/RT),in whichM0is the frequency factor,which is the function of vibrational frequency(ν),jump distance(δ)and temperature(T)viaM0=δ2ν/RT,whileQis the activation energy.Here,by assuming that atomic mobilities of magnesium cations in the frst sublattice have the relationship MMg2+Va=MMg3+Va=MMgVa,Eq.(2)can be simplifie as

According to Ref.[17],one can obtain the expression for the tracer diffusion coefficient D∗Mg,which is given by

Compared with Einstein's equation:D∗=RTM,the atomic mobility of magnesium in MgO can be inferred

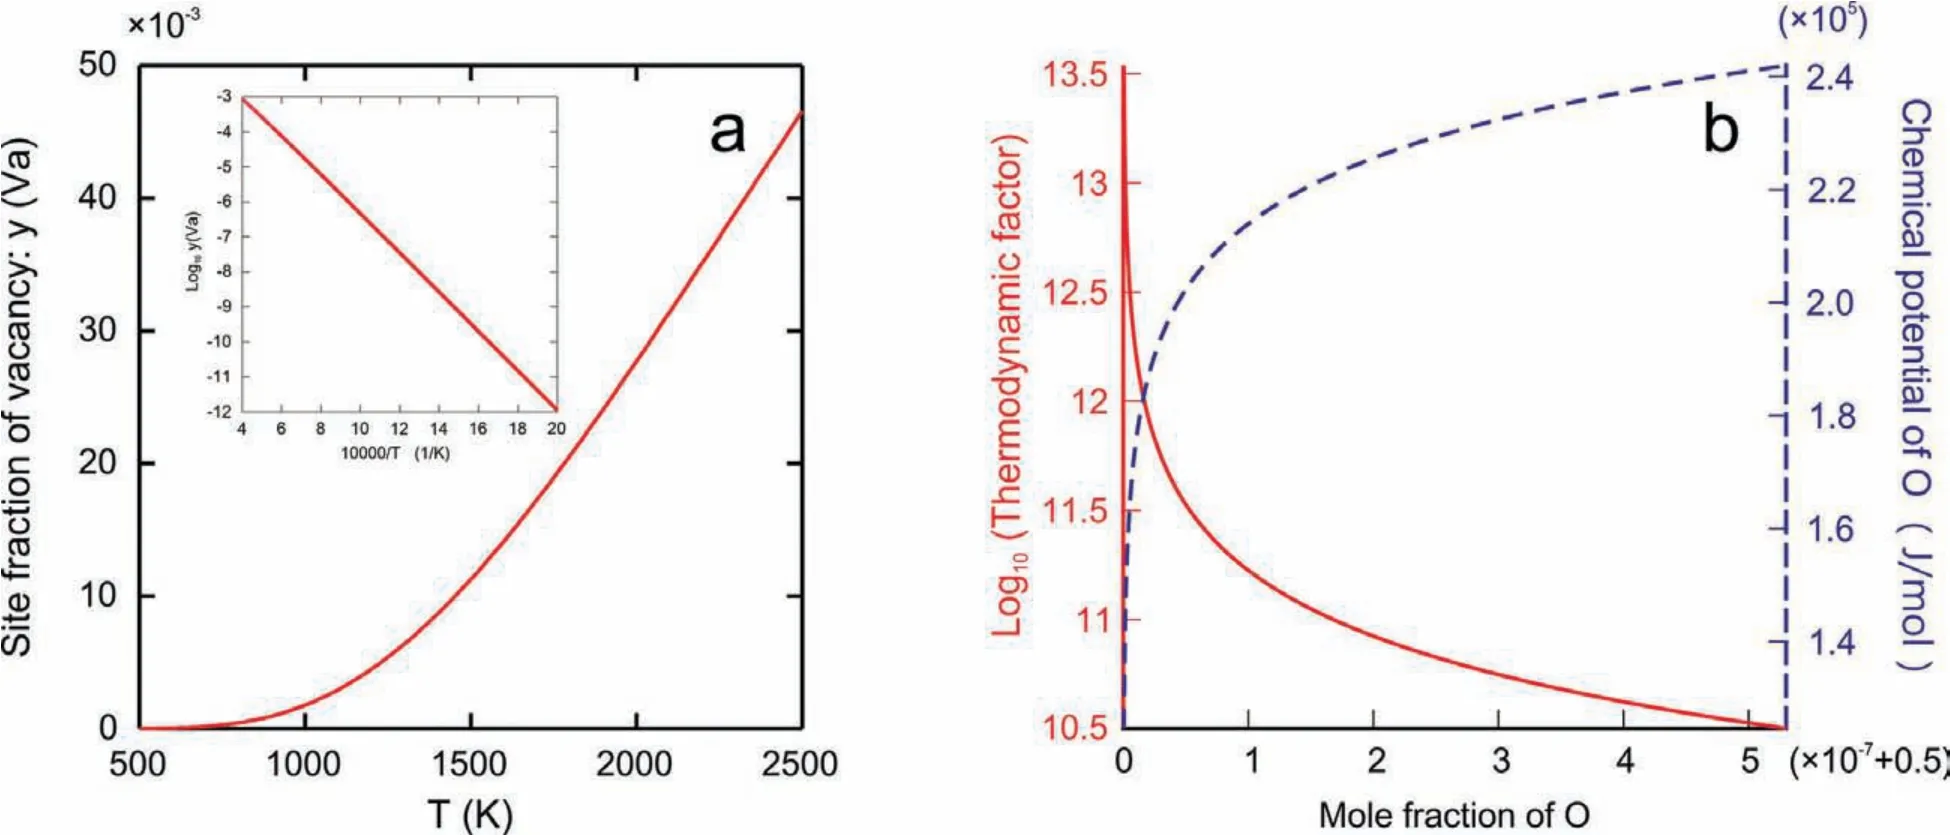
Fig.2.(Color online)Calculated(a)site fractions of vacancy at the stoichiometric composition of MgO under the condition of P(O2)=0.21 atm;(b)thermodynamic factors(red solid line)and chemical potentials(blue dash line)of O in MgO as function of O composition at 673 K,based on the presently obtained thermodynamic descriptions for MgO with slight modification of the original parameters from Hallstedt[16].
As mentioned above,the ions in MgO diffuse according to the vacancy mechanism.Although the second sublattice is fully occupied by oxygen anions in the thermodynamic model above,there are a few sites for vacancies,of which the contribution is too small to be considered in the thermodynamic model.Supposing that the site fractions of species in the second sublattice are yIIVaand yIIO,the flu of the tracer O∗alongzaxis in a lattice-fi ed frame of reference can also be expressed in the similar way,

which yields:

Then,the atomic mobility of oxygen has the form:

It should be noted that there are several types of diffusivities besides the bulk diffusivity in normal lattice.As a matter of fact,there are various defects in real crystals,like dislocations and grain boundaries in polycrystals,which can largely enhance the diffusion velocity through reducing the activation energy.Considering the influenc caused by defects,it is necessary to use effective diffusion coefficient to replace the bulk diffusivity in the present work.To quantitatively analyze the diffusion behavior in real polycrystals,the model proposed by Hart[45]and Harrison[46]was utilized to describe the effective diffusion coefficient in this work[47].The same frequency factor with bulk diffusion but a redistributed coefficienFredfor activation energy was introduced in the circuit diffusion compared with the bulk atomic mobility.Then,the atomic mobilities along dislocation and grain boundaries can be expressed as


where the value of redistributed coefficien in the equation is generally less than 1 for the circuit diffusion.Fredis in relation to the energy of the defects,including Burger's vector and thickness of grain boundaries,where Burgers vector's square represents the energy of a dislocation,and the grain boundary thickness,to some extent,represents the energy of a grain boundary.Besides,the effective diffusion coefficient are connected to the quantity of the defects relating to the key factors,namely,the dislocation density and grain size.Thus,the effective mobility and diffusion coefficient can be expressed as[45,46]

hereδdenotes the average thickness of grain boundaries,daverage grain size which depends on the temperature and time,ρdislocation density andbBurgers vector.Dbulk,DDIS,DGBandDeffare the tracer diffusion coefficient in bulk,dislocation and grain boundary and the effective tracer diffusion coefficients respectively.
3.3.Oxidation kinetic model
The diffusion-controlled oxidation process obeys the parabolic law.According to the Wagner's theory[14]:

whereXrepresents the oxide thickness(unit:m),kpoxide growth rate constant(unit:m2/s)andttime(unit:s).Based on Eq.(11),the key to evaluate the thickness of oxides as a function of time lies in the reasonable value ofkp,which is determined by both thermodynamics(driving force)and kinetics(diffusion coefficients)In fact,the reliable thermodynamic and kinetic information needed forkpcan be provided by the CALPHAD-type thermodynamic and kinetic descriptions.The derivation of the mathematical expression forkpis described in the following.
The oxidation rate can be determined by the moving rate of interfaces,including both oxide/metal and oxide/gas interfaces.The inward diffusion of oxygen ions results in an internal migrating interface towards pure Mg,while the outward diffusion of magnesium ions can cause an external migrating interface towards gas.The schematic diagram is shown in Fig.3.Based on the moving boundary model[20],the moving rate of boundary has the form:

wherevdenotes moving rate of interface,the molar volume ofi(i=α,β)phase and Jik the diffusion flu of componentkiniphase,which can be expressed by Fick's frst law:

Here,Dkdenotes chemical diffusion coefficien of componentk.Dkcan be related to the tracer diffusion coefficienand thermodynamic factor[16]via the following equation:

Since thermodynamic factor for a nearly stoichiometric compound is infinit,the average thermodynamic factor define as[43]is introduced and the detail discussion is listed in the Appendix.The combination of Eqs.(12)-(14),and may determine the moving rates of two interfaces of oxide phase,respectively.Therefore,the values ofkpcan be determined by the sum of moving rates of interfaces in both sides and finall simplifie into:

whereΔμOdenotes the difference of chemical potential of oxygen in magnesium oxide.According to the local equilibrium hypothesis,the identical components in the two phases have the same chemical potentials at interface.Thus,the chemical potentials of oxygen at two interfaces equal to those of gas and Mg(hcp)phase respectively.Moreover,since magnesium oxide owns a very narrow homogeneity range,i.e.,that MgO is nearly a stoichiometric compound,the variation of chemical potential of oxygen can be expressed by:

4.Results and discussion
4.1.Bulk diffusion in MgO
The atomic mobilities for bulk diffusion in MgO were assessed on the basis of various experimental diffusivities in the bulk MgO available in the literature by means of a non-linear least-squares optimization scheme incorporated in the PARROT module of the DICTRA software package.The experimental tracer diffusivities of Mg in MgO in Refs.[22-27]as displayed in Fig.4(a)were used to assess the atomic mobility parameters of Mg.On the contrary,as shown in Fig.4(b),the experimental data of O[30,32-40]have a larger scatter because the purity of samples reported in the literature are not identical,which is one of the relating key factors of diffusion coefficients The impurity contents may change the quantity of vacancies,ions interaction and substructures,thereby,influencin the tracer diffusion coefficients The samples studied in the Refs.[30,32,33]with the highest impurity correspond to the highest diffusion coefficient in Fig.4(b).Conversely,the samples in Ref.[38]with the highest purity possess the lowest diffusion coefficients Moreover,the samples with similar purity have the diffusion coefficient close with each other.Therefore,the experimental data from Ref.[38]were accepted to evaluate the atomic mobility descriptions for O in MgO.The other data in Fig.4(b)are considered as the results of the combined contributions of the bulk and short circuit diffusion,which will be discussed inSection4.3.The evaluated atomic mobility parameters are expressed as Eq.(17):

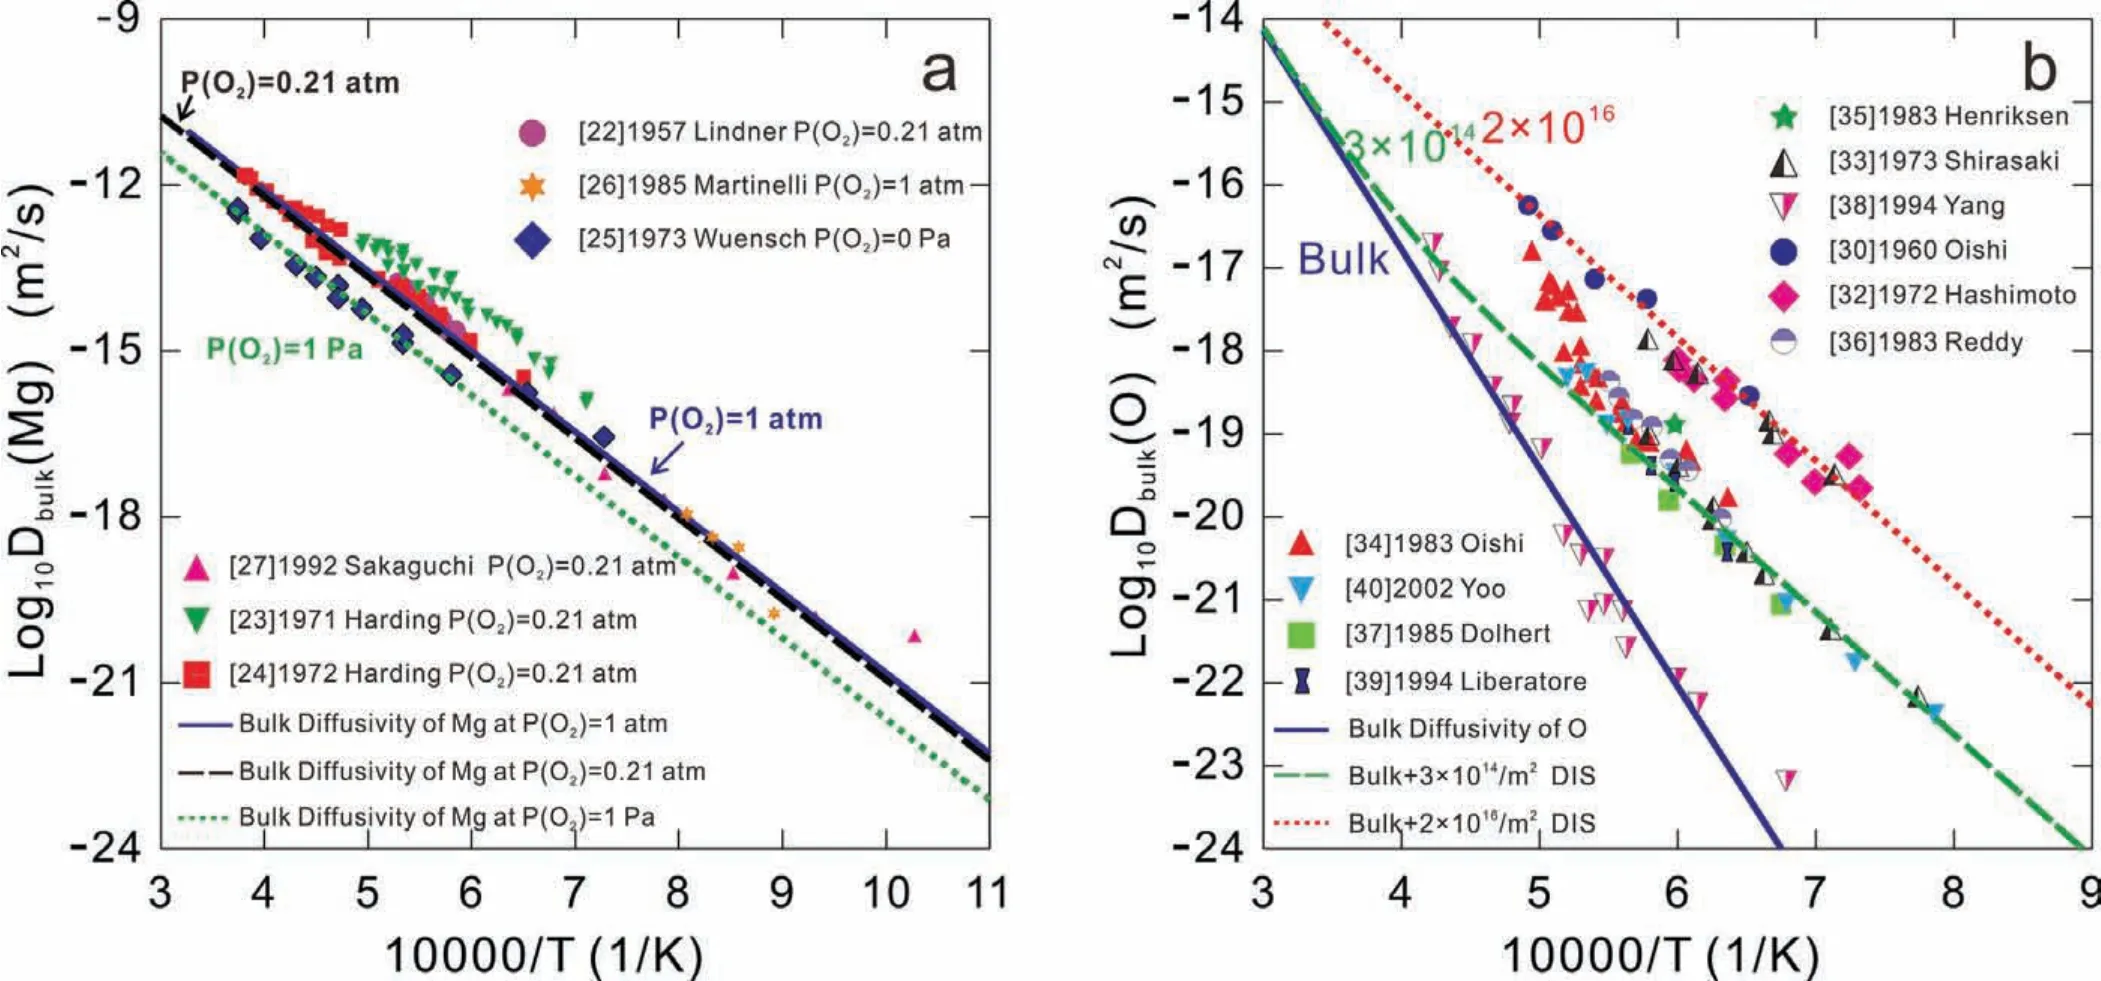
Fig.4.(Color online)Calculated bulk diffusion coeff cients of(a)Mg and(b)O in MgO as a function of inverse temperature and oxygen partial pressure,compared with the experimental data[22-27,30,32-40].
The calculated bulk diffusion coefficient of the magnesium cations and oxygen anions as a function of inverse absolute temperature under different oxygen partial pressures and temperatures are shown in Fig.4,compared with the experimental data[22-27].It should be noted that the partial oxygen pressure determines the vacancy concentration in MgO,which affects the diffusion coefficient according to Eq.(4)and(7).As can be seen in Fig.4(a),the calculated temperaturedependent bulk diffusion coefficient of magnesium increase slightly as the partial oxygen pressure increases and agree very well with most of the experimental data[22,24-27].It should be noted that the experimental data in Ref.[23]deviate from the calculated results because the impurities exist in the tracer solution,as explained in Ref.[24].As can be seem in Fig.4(b),the calculated bulk diffusion coeffi cients of oxygen also accord with the experimental data in Ref.[38].
4.2.Short-circuit diffusion in MgO
In practice,most materials are polycrystal,and thus a large amount of defects such as grain boundaries and dislocations coexist.As mentioned in Section 3.2,the jumping rates of atoms along the short-circuit paths such as grain boundaries and dislocations are much higher than that in the lattice.Therefore,the contributions of both grain boundaries and dislocations to diffusion should be taken into account.On the basis of Eq.(9),the mobilities along the short-circuit paths were evaluated by the same method declared above.
The experimental diffusivities of Mg along the dislocations reported in Ref.[27],shown in Fig.5(a),were employed to assess the atomic mobility parameters.Moreover,the experimental data in Ref.[37],as shown in Fig 5(b),were used to assess the atomic mobility parameters of O along the dislocations,the obtained atomic mobility parameters along the dislocations are presented as follows:

As shown in Fig.5,both calculated diffusivities of Mg and O conform to the experimental data in Ref.[27]and Ref.[37]respectively.Comparing the mobility along the dislocations with that in the bulk,the redistributed coefficient of activation energy along the dislocations can be calculated
Besides the dislocation diffusion coefficients the grain boundary diffusion coefficient of Mg and O are also studied,and the results are displayed in Fig.6.For the oxygen anions,there are several groups of experimental data on the grain boundary diffusion coefficient available in the literature,including the data from the experimental measurements[31-33,37,39]and the molecular dynamics simulations[29].The molecular simulation results scatter much larger over several magnitudes than the experimental data,and thus were not used in this work.Moreover,the scattering between different sets of experiments[31-33,37,39]for the grain boundary diffusion coefficient of O is about two magnitudes.It is quite normal because the high-angle grain boundaries have higher energy than the low-angle grain boundaries along which the diffusivities are lower[39].In order to balance the influence from different categories of grain boundary,the average grain boundary diffusion coefficient of O were used by fittin to all the experimental data[31-33,37,39],and the results can be seen in Fig.6(b).
Due to lack of data on magnesium diffusion along grain boundaries(except for one piece of information frommolecular dynamics simulations[29]which cannot be accepted in the present work),no assessment for magnesium mobility for the grain boundary diffusion was performed here.As discussed above,the redistributed coefficient of Mg and O along dislocations are nearly the same.Thus,it seems reasonable to assume that the grain boundary diffusion coefficient of Mg and O also have the same redistributed coefficient as adopted in this work to predict the grain boundary diffusion coefficient of Mg in MgO.The predicted grain boundary diffusion coefficient of Mg in MgO as a function of inverse temperature are presented in Fig.6(a).
The finall obtained atomic mobility parameters of Mg and O diffusion along grain boundaries are given as


Here,Eq.(19)represents the average grain boundary mobilities.As shown in Fig.6(a),the predicted grain boundary diffusion coefficient agree with the molecular dynamics results from Landuzzi et al.[29]at temperatures higher than 2000 K.When the temperature is the lower than 2000 K,the noticeable differences between the two values exist,and become larger and larger as the temperature decreases.As can be seen in Fig.6(b),the agreement between calculated results and the experimental data seems to be good.Moreover,the mobility for diffusion of O along the high-angle grain boundaries is higher by about ten times than the average value,which is however higher than the mobility for diffusion of O along the low-angle grain boundaries by around ten times.The redistributed coefficient of grain boundary diffusion coeffi cients of Mg and O can be evaluated as0.619.
4.3.Effective diffusion in MgO
With Eq.(10),the effective diffusion coefficient can be evaluated based on the obtained atomic mobility parameters for diffusion along the bulk and short-circuit paths.
The factors influencin the diffusion along dislocation include dislocation density and burgers vector.As reported in the literature[27,37,48],the dislocation density is insensitive to the change of temperature.The values of dislocation density in MgO are in the range of 1×10¹³/m2∼1×1015/m2[27,37].In this work,the typical valueρ=1×10¹⁴/m2was adopted.Besides,the burgers vector of main dislocationsconsidering that MgO is with the face-centered cubic structure[49-51].Based on the lattice parameters available in the literature,the length of burgers vector can be calculated as 0.297 nm[50].Therefore,the value ofρb2in Eq.(10)is calculated in the order of 10−5.One can obviously see that the contribution of diffusion along the dislocation to the effective diffusion is small and thus may be neglected.
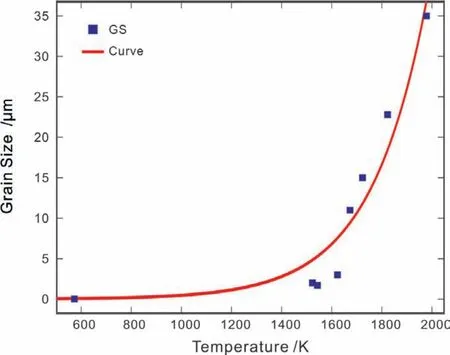
Fig.7.(Color online)Calculated average grain size of MgO as a function of temperature,compared with the experimental data[29,31-33,37,48,52,53].
As mentioned inSection 4.1,all the experimental data except the data from Ref.[38]were not used to evaluate the atomic mobility parameters because the purity of samples was not satisfactory.That is because the impurities in those samples may largely enhance the diffusion coefficients To some extent,the content of impurities can be viewed as the dislocation since both of them can serve as the fast path for diffusion.As presented in Fig.4(b),the influence of different dislocation densities on the bulk diffusion are compared with the experimental data with different impurities,and the results show a good agreement with the experimental data.As for the grain boundary diffusion,the influenc factors include the thickness of grain boundary and the average grain size.As reported in the literature,the thickness can be viewed as a constant for simplification and thus the typical valueδ=1 nm[28,29,31,39]was adopted here.Moreover,as the temperature increases,the grains may coarse,resulting in the decrease of interface energy.Therefore,the average grain size should be a function of temperature,i.e.,d=Aexp(BT),whereddenotes the average grain size,whileAandBare the undefine constants.As shown in Fig.7,the temperaturedependent average grain sizes can be obtained by fittin to the experimental data[29,31-33,37,48,52,53]using a least-square method:

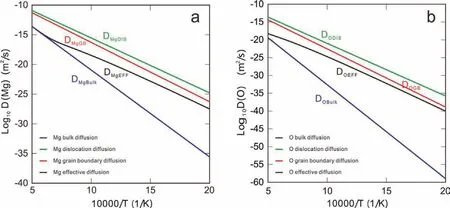
Fig.8.(Color online)Model-predicted effective diffusion coeff cients of(a)Mg and(b)O as a function of inverse temperature,compared with the bulk and short-circuit diffusion coeff cients.
wheredis the average grain size in the dimension of m,Ttemperature in K.
Based on the obtained atomic mobility parameters and the values for factorsρ,b,d,δ,the effective diffusion coeffi cients can be evaluated,and displayed in Fig.8.As can be seen in Fig.8,at higher temperatures,the effective diffusion coefficient are close to the bulk diffusion coefficient but show large scattering at lower temperature conversely.It can be explained by the different grain sizes existing at different temperatures.As the temperature decreases,the grains become smaller and there are more grain boundaries to enhance the diffusion of ions.By contrast,at high temperatures,the large grains eliminate the effect of grain boundaries on diffusion.Therefore,the contributions of short-circuit paths to diffusion can be ignored at higher temperatures but turn to be more and more essential as the temperature decreases.For instance,as shown in Fig.8(b),the extrapolated value ofDObulkat 500 K is close to∼10−60m2/s,while those ofDOGBandDODISare in the range of 10−40∼10−35m2/s.It should be noted that the reliability of the obtained effective diffusion coefficient at lower temperatures needs further confirmatio because it is very difficul to measure the grains with several nanometers accurately.Moreover,by comparing Fig.8(a)with Fig.8(b),the effective diffusion coefficient of O are much lower than those of magnesium cations.Base on Eq.(15),it can be concluded that the high-temperature oxidation process of pure Mg is predominantly controlled by diffusion of the magnesium cations.
4.4.Oxide growth rate constant kp and prediction of oxidation process of pure Mg
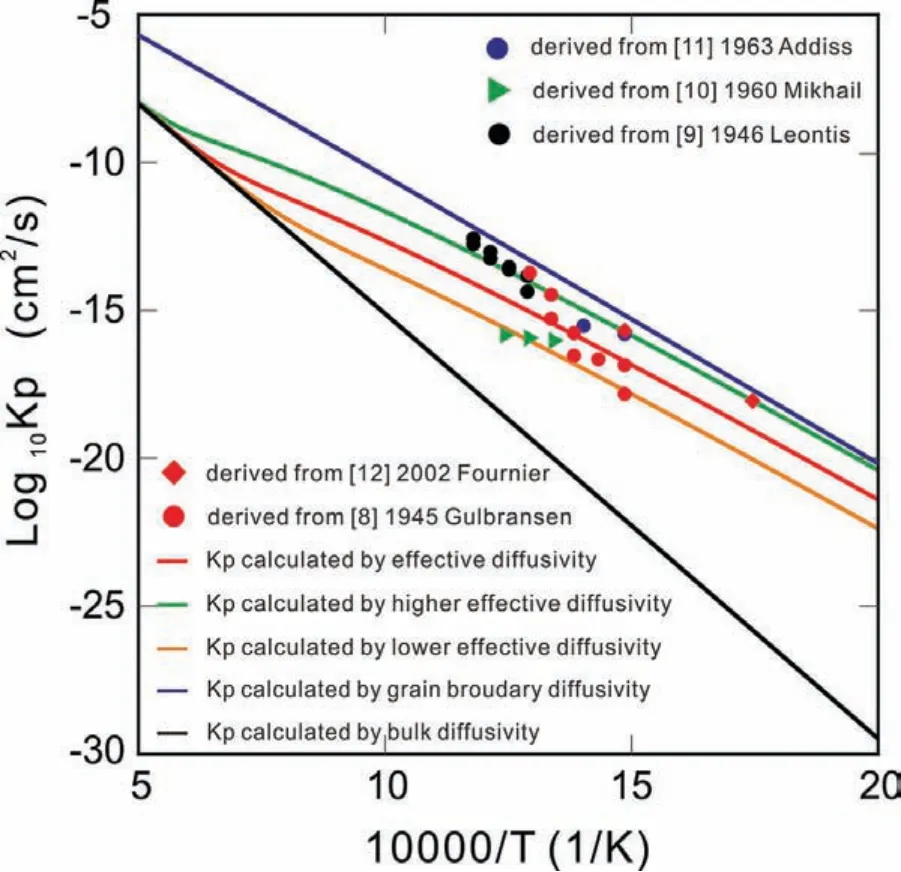
Fig.9.(Color online)Logarithmic values of growth rate constant of oxide kp as a function of inverse temperature from 500 K to 2000 K,compared with the experimental data[8-12].
Based on the kinetic model of oxidation inSection 3.3,the growth rate constant of oxideskpcan be evaluated based on Eqs.(15)and(16)by the thermodynamic and kinetic descriptions obtained in this work.In order to truly reveal the oxidation mechanism,different sets ofkpvalues were calculated by considering different types of diffusion coefficient(i.e.,bulk,grain boundary and/or effective diffusion coeffi cients).The calculated results and the experimental growth rate constants are shown in Fig.9,where the experimentalkps were calculated based on Eq.(11)together with the experimental thickness in Refs.[8-12],while the model-predicted values ofkpwere calculated by the bulk diffusion coefficient(black line),grain boundary diffusion coefficient(blue line)and effective diffusion coefficient with different grain boundary angles(red,green,orange lines),respectively.Based on Eq.(11),the oxide thickness as a function of time can be directly predicted by the evaluatedkp.The model-predicted thickness of MgO atP(O2)=0.21 atm and 673K is presented in Fig.10.It can be found that the model-predicted thickness according to the effective diffusivities with the high-angle grain boundaries can reproduce all the experimental data perfectly,which indicates the high-angle grain boundaries exist predominantly in the MgO polycrystals at 673 K.
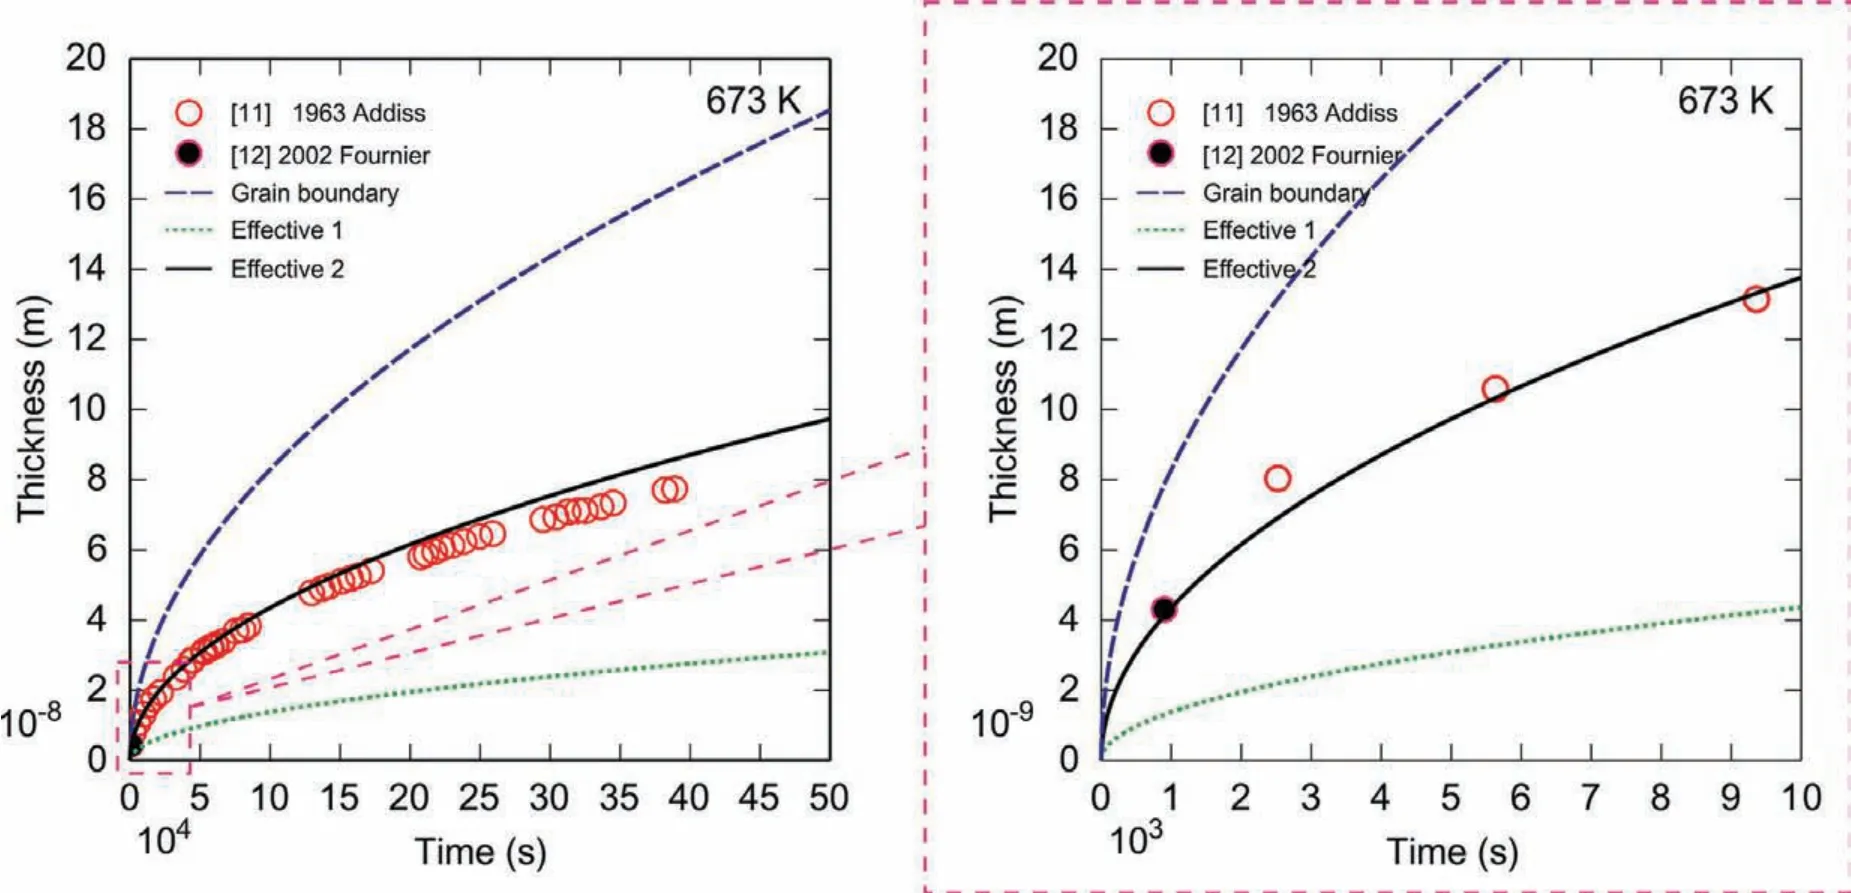
Fig.10.(Color online)Model-predicted evolution of thickness of MgO oxide at 673K and P(O2)=0.21 atm using different sets of diffusivities,compared with the experimental data[11,12].
From Fig.9 and Fig.10,one can conclude(i)that the calculated results based on the effective diffusivities reproduce the experimental data satisfactorily,which illustrates the reliability of the presently evaluated atomic mobility descriptions for Mg and O in MgO;(ii)that the grain boundaries can largely enhance the oxidation rate,especially at low temperatures;and(iii)that the grain boundaries with high angles can enhance the diffusion coefficient more effectively than those with low angles.
Though the predictedkpvalues and thicknesses of MgO during oxidation are consistent with the experimental data,one should bear in mind that the naturally formed oxide fil on Mg is quite diverse and depends on various factors.For example,the contributions of defects like grain boundary and dislocation were included in Eq.(10),but some empirical or typical parameters of defects were used due to lack of suffcient experimental data on i.e.,the thickness of grain boundary,and the dislocation density.Therefore,in order to perform the quantitative modeling of the real oxidation process in different metals/alloys,the accurate description of microstructure evolution during the oxidation process should be a prior,which will be the topic for next paper.
5.Conclusions
·Atomic mobility descriptions for Mg and O in MgO were firs obtained by means of CALPHAD approach based on various diffusion coefficient critically reviewed from the literature,together with the reported thermodynamic descriptions.Both bulk diffusion and short-circuit diffusion were taken in account.Different diffusivities evaluated according to the obtained atomic mobilities agree well with most of the experimental data.
·A mathematical expression for growth rate constantkpof oxide scale by fully considering diffusion and thermodynamics in metal and oxygen ions was proposed in the framework of the Wagner's theory.The growth rate constantkpof magnesium oxide was predicted by the obtained atomic mobility descriptions,and the predictedkps show a good agreement with the experimental data.
·The growth of magnesium oxide as a function of time at 673 K was simulated based on the Wagner's model.The simulated results with high-angle grain boundaries reproduced the experiments satisfactorily.Furthermore,the mechanism of magnesium oxidation over a wide range of temperature was discussed.The results indicate that grain boundary diffusion of magnesium cations predominated during the high temperature oxidation process.
Acknowledgements
The financia support from the National Key Research and Development Program of China(Grant No.2016YFB0301101),the Hunan Provincial Science and Technology Program of China(Grant No.2017RS3002)-Huxiang Youth Talent Plan,and the Youth Talent Project of Innovation-driven Plan at Central South University(Grant No.2282019SYLB026)is acknowledged.Sa Ma acknowledges the financia support by the Fundamental Research Funds for the Central Universities of Central South University(Grant No.2019zzts485).The authors thank Prof.Bengt Hallstedt at Aachen University,Germany for kindly providing thermodynamic database of Mg-O system.
Appendix.Derivation of oxide growth rate constant kp
The modifie formula unit of solid magnesium oxide phase is given with two sublattices as:(Mg,Va)1(O)1,where the valences of ions are neglected.Nevertheless,to ensure the diffusion of oxygen in the second sublattice based on vacancy diffusion mechanism,the formula unit can be rewritten as(Mg,Va)1(O,Va)1.As reported in Ref.[13],the chemical diffusion coefficient of magnesium and oxygen ions in magnesium oxide can be expressed by:

Here,ni(i=Mg,O)represents the number of speciesiper mole firs or second sublattice sites,which can be regarded as one during calculation since the fraction of vacancy is close to zero.Because the mole fractionxihas a relationship withni(xi=ni/(nMg+nO)),the chemical diffusion coefficien of O in Eq.(A1)can thus be deduced as:
whereφis thermodynamic factor which can be determined from thermodynamic description.And the chemical diffusivity of Mg has the same form.Using the Gibbs-Duhem relationship,andxMg=xO=0.5,one can express the chemical diffusivity of Mg as:
In the stoichiometric compound,the average thermodynamic factorφave[41]needs to be introduced to replaceφfor evaluation of the diffusion coefficients
wherex1andx2respectively denote minimum and maximum of mole fraction of oxygen in MgO,μ1andμ2are chemical potentials.According to Eq.(16),the chemical potential differenceΔμOcould be calculated.
As is mentioned in Section 3.3,the distance between the two interfaces of MgO phase related to the interface moving rate,is the thickness of oxide film Based on Eq.(12),interface moving rates could be deduced by chemical diffusion flux It should be noted that the mole fraction of O in magnesium and the mole fraction of Mg in gas are approximated to be zero,resulting in zero flu of component O and Mg in pure magnesium phase and gas phase,respectively.Moreover,the mole fractions of magnesium and oxygen in MgO are both 0.5.Therefore,combined with the Fick's frst law,the absolute values of interface moving rates could be derived as:

where v1and v2respectively denote moving rate of metal/oxide interface and oxide/gas interface,Vmthe volume occupied by per mole ions(sum of magnesium and oxygen ions).Vmis considered as independent of composition.It is reasonable to assume that the concentration profile within MgO phase region is linear at any time as magnesium oxide has very narrow homogeneity range.Thus,the growth rate of magnesium oxide could be determined by interface moving rates:
whereΔxOandΔxMgrespectively represent mole fraction difference of O and Mg,andΔxO=ΔxMg.Combine Eq.(11)with the solution of Eq.(A6),growth rate constant of oxide kpis derived as:

杂志排行
Journal of Magnesium and Alloys的其它文章
- Microstructural evolution of Mg-Al-Re alloy reinforced with alumina fiber
- Predicting and controlling interfacial microstructure of magnesium/aluminum bimetallic structures for improved interfacial bonding
- Plasma electrolytic oxidation of AZ31 and AZ91 magnesium alloys:Comparison of coatings formation mechanism
- Effects of annealing treatment on microstructure and tensile behavior of the Mg-Zn-Y-Nd alloy
- Microstructure and performance of biodegradable magnesium alloy tubes fabricated by local-heating-assisted dieless drawing
- Comparisons of microstructure homogeneity,texture and mechanical properties of AZ80 magnesium alloy fabricated by annular channel angular extrusion and backward extrusion
