Evolution of PEO coatings on AM50 magnesium alloy using phosphate-based electrolyte with and without glycerol and its electrochemical characterization
2020-12-18AshutoshJngdeKumrBlwert
Ashutosh Jngde,S.Kumr,C.Blwert
aDepartment of Materials Engineering,Indian Institute of Science,Bangalore 560 012,India
bInstitute of Materials Research,Helmholtz-Zentrum Geesthacht,Max-Planck-Str.1,21502 Geesthacht,Germany
Received 3 December 2019;received in revised form 6 March 2020;accepted 4 May 2020 Available online 13 June 2020
Abstract PEO coatings were synthesized from phosphate-based(bP-PEO)and glycerol added phosphate-based(gP-PEO)electrolytes with different processing times.For both bP-PEO and gP-PEO coatings treated with different processing time its morphology,elemental and phase composition,and electrochemical behaviour has been comparatively investigated.For this,scanning electron microscope(SEM),energy-dispersive X-ray spectroscopy(EDXS),X-ray diffraction,electrochemical impedance spectroscopy(EIS),and potentiodynamic polarization techniques were employed.The gP-PEO coatings were observed to have higher pore density with reduced pores size,surface porosity,and average coating thickness compared to bP-PEO for all the PEO processing time.XRD studies revealed that glycerol addition resulted in the fostering of crystalline MgO(periclase)phase and promoting Mg3(PO4)2(farringtonite)phase amorphization.In general,electrochemical behaviour showed improved corrosion behaviour for gP-PEO compared to bP-PEO.© 2020 Published by Elsevier B.V.on behalf of Chongqing University.This is an open access article under the CC BY-NC-ND license.(http://creativecommons.org/licenses/by-nc-nd/4.0/)Peer review under responsibility of Chongqing University
Keywords:Magnesium alloy;Plasma electrolytic oxidation;Glycerol additive;Electrochemical impedance spectroscopy;Corrosion.
1.Introduction
The ubiquitous use of Mg and its alloys in the fiel of engineering and technological applications is severely restricted by its relatively poor corrosion properties.Mg exhibits the most active standard reduction potential of−2.36V(vs standard hydrogen electrode)amongst the structural engineering metals and alloys[1].Furthermore,the naturally formed passive layer on the Mg surface is not as perfect as in the case of Al,Ti,and Zr,etc.valve metals.This imperfect passive layer for the Mg system is due to its low Pilling-Bedworth ratio(PBR)having a value of 0.8[2].Alloying Mg with other noble elements often results in poorer corrosion performance than the Mg.The differential solute atom segregation existed between the Mg grain interior and its boundaries or the intermetallic phases formed as a result of alloying acts as local cathodic sites and thus promotes micro galvanic corrosion and deteriorate its corrosion performance[3].Several surface treatment techniques namely anodizing,chromating,phosphating,etc.have been exploited to enhance the corrosion behaviour of Mg and its alloy[4-6].However,plasma electrolytic oxidation(PEO)is a widely used technique for enhancing Mg and its alloys'corrosion behaviour particularly because of its resulting thicker and denser coatings and of its environment-friendly nature[7-9].The PEO technique has been used commercially for Mg alloy systems[10].Conventionally PEO techniques have been employed only for valve metals and their alloys,however recently it has been employed also over non-valve metal such as Fe[11]and even over semiconductor material such as Si[12].
In PEO technique many of its processing parameters such as electrolyte composition[13],electrolyte concentration[14],nature of power supply(DC unipolar pulse[15],DC bipolar pulse[16],and AC[17]),processing temperature[18],and substrate nature[19-22]influence the oxide structure produced.However,amongst all the PEO processing parameters the electrolyte composition has a predominant influenc on the resulting oxide structures.Silicate,phosphate,and aluminate based alkaline electrolytes have been extensively studied in the PEO surface treatment of Mg and its alloys[23-25].For PEO coating synthesis for Mg and its alloys,various additives have also been utilized in the electrolytes used to enhance its corrosion resistance[26-28].As electrolytic additive glycerol too has attracted researchers'attention recently as it helps in improving PEO coatings corrosion resistance[29-31].Like water,glycerol also is a polar solvent and thus inorganic salts dissolution is facilitated by its usage[32,33].Though the PEO technique has been extensively studied its formation mechanism is still not fully understood[34].Only a few studies[35-37]have been done on the evolution of PEO coatings on magnesium metal/alloys while most of the other research work focused on the investigation of microstructures,composition,and electrochemical behaviour only after fina PEO processing.
Thus,this study aims to investigate the temporal PEO coatings evolution along with their corrosion behaviour and investigate how the glycerol as an electrolytic additive influenc the coatings evolution and its corrosion behaviour.This research work is in continuation of our earlier study on the evolution of PEO coatings formed from silicate-based alkaline electrolyte(with and without glycerol additive)and their corrosion behaviour[29],however,the same has not been studied/attempted by any other research group until now and is reported herein frst.In this present research work,the morphological(porosity,pore sizes,and coated layer thickness),elemental compositions,phase content,and corrosion behaviour of PEO coating formed from alkaline phosphate and glycerol added alkaline phosphate electrolytes as a function of PEO processing time(15s,30s,1min,2min,4min,8min,and 16min)has been extensively and comparatively studied.Additionally,a comprehensive comparative assessment was also made between the finding of the present study and our previously published article[29].
2.Experimental methods
AM50 coupons having a dimension of 15mm x 15mm x 4mm were cut from the as-cast ingot.The nominal elemental composition of the AM50 coupon was Al-4.9wt.%,Mn-0.26wt.% and balance Mg.The coupons were mechanically abraded successively up to 1200 grit SiC emery paper followed by ultrasonically cleaned in ethanol and then air-dried.Theses AM50 Mg alloy coupons were used as an anode and stainless-steel coil tube as a cathode for PEO treatment.The composition of base electrolyte used for the PEO processing was sodium phosphate Na3PO4(20g/l)and potassium hydroxide KOH(1g/l).Glycerol C3H8O3(250ml/l)was used as an additive to phosphate-based electrolyte.The pH of phosphatebased electrolyte and glycerol added phosphate-based electrolyte were 12.0 and 11.7 respectively.A constant current(0.25 A)mode was employed for the PEO processing corresponding to 36 mA/cm2current density.A DC power source was used for supplying a unipolar pulse having 0.5ms and 4.5ms of‘on'and‘off'pulsed time respectively which corresponds to the duty cycle and frequency of 10% and 200Hz respectively.The cathode stainless steel tube was circulated with water to maintain an electrolyte temperature of 15±1°C.Various processing times i.e.15s,30s,1min,2min,4min,8min,and 16min were employed for PEO treatment.After PEO treatment the coated samples were cleaned with distilled water and then dried in an ambient environment.
The coated samples morphology and their elemental composition were characterized by scanning electron microscopy equipped with energy-dispersive X-ray spectroscopy(EDXS).SigmaScan Pro 4.0 software was used for pore analysis utilizing 12 numbers of SEM images which were captured randomly for each coated sample.Provisions were taken for the pores which are interconnected together by fin cracks induced by the residual stress to count them as separate pores.The coated samples were cut in through-thickness directions by Electrical discharge machining(EDM)to investigate its thickness and through-thickness elemental composition profile X-ray diffractometer(Rigaku)equipped with Johansson monochromator using Cu-Kαradiation was utilized to carry out the XRD study of coated samples.A scan range of 10°to 100°(2θ,degree)was employed with a scan rate and step size of 1°/min and 0.02° respectively.
The electrochemical behaviour of PEO coated samples were investigated in non-deaerated 0.5wt.% NaCl corrosive electrolyte solution.For all electrochemical tests,the classical three electrodes system cell was employed comprising of Pt foil as an auxiliary electrode,Ag/AgCl electrode as the reference electrode and coated samples with 0.5 cm2(an exposed area to the corrosive electrolyte)as the working electrode.Before electrochemical tests,the samples were ultrasonically cleaned in ethanol for 2min and then dried in air.For all the electrochemical tests 400ml of freshly prepared 0.5 wt.%NaCl(400 ml)as the corrosive electrolyte was used.Potentiostat(Autolab)equipped with a frequency response analyser(FRA)was utilized for all electrochemical tests.Electrochemical impedance spectroscopy(EIS)was measured as a function of various intermediate immersion time from the initial 0.5h to the fina 201h.Small amplitude of 10 mVRMSpotential sinusoidal perturbance with respect to open circuit potential(OCPs)was employed with varying frequency ranging from 10kHz to 100 mHz.Before every EIS scan,open-circuit potentials were recorded.EIS spectra were fitte with electrochemical equivalent circuits by utilizing ZviewTMsoftware.Potentiodynamic polarization tests were carried out at two different immersion time i.e.0.5h and 201h(after long-duration EIS study).All the potentiodynamic polarization tests were performed with a potential sweep of 1mV/s from the cathodic region(−300mV)with respect to OCP to the anodic region.
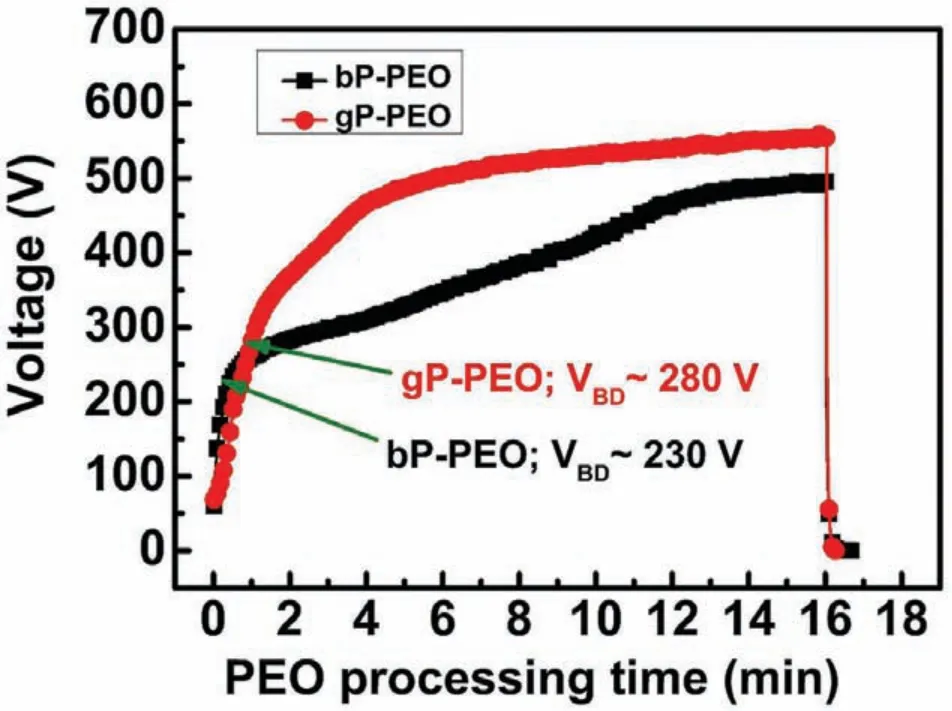
Fig.1.Evolution of voltage as a function of PEO processing time for both bP-PEO and gP-PEO.
3.Results and discussion
3.1.Voltage evolution during peo
The voltage evolution during the PEO processing for both bP-PEO and gP-PEO is shown in Fig.1.The voltage-time curve illustrates that for bP-PEO during the stage-I of PEO processing the voltage-time curve was linear.However,for gP-PEO,the curve is not strictly linear during stage-I perhaps due to difficult in the formation of the passive film During stage-I,the substrate dissolution,mild oxygen evolution,and passive layer formation were the prominent reactions.It was observed that the slope of the voltage-time curve during stage-I for bP-PEO was 5.00±0.31V/s which was signifi cantly steeper when compared to 3.83±0.06V/s for gP-PEO.This suggests that the initially formed thin passive layer for bP-PEO offered higher resistance to the applied current than that for gP-PEO.Thus,herein,the addition of glycerol in phosphate-based electrolyte resulted in the less steep voltagetime curve slope than that for without glycerol addition.This contrasts the finding of our previous investigation[29]where the glycerol addition to the silicate-based electrolyte resulted in a steeper voltage-time curve slope during stage-I.This indicates that the influenc of glycerol addition on characteristics of the voltage-time slope during stage-Idepends on the nature of base electrolyte.Dielectric breakdown of the initially formed thin passive layer which manifests the onset of stage-II by exhibiting the characteristic low-intensity global microdischarges which occurred slightly earlier for bP-PEO at 30s PEO processing time compared to 1 min for gP-PEO.However,the magnitude of dielectric breakdown potential,VBD,for bP-PEO was 230V which was quite lower than 280 V for gP-PEO.The higher VBDhas been reported in other investigations as well[29-31]where glycerol was employed as an electrolyte additive.In stage-II,several micro-discharges with moderate intensity were observed for both bP-PEO and gPPEO.The voltage increased with a reduced rate during stage-II than that during stage-I for both bP-PEO and gP-PEO.For bP-PEO and gP-PEO,the processing time of 12min and 8min marked the onset of stage-III respectively as the voltage-time curves flatte then onwards.Noticeably the onset of stage-III occurred much earlier for gP-PEO than for bP-PEO.The micro-discharges reduced in numbers but increased in intensity and the voltage increase rate was further reduced during stage-III than that during for stage-II for both bP-PEO and gP-PEO.From stage-II onwards,the voltage was higher for gP-PEO when compared to bP-PEO.This might be due to the lower electrical conductivity(10.1 mS/cm)of glycerol added phosphate electrolyte than that of base phosphate electrolyte(25.5 mS/cm).The fina voltage for gP-PEO with 558V was significantl higher when compared to 495V for bP-PEO.
3.2.Microstructural characterization
3.2.1.PEO surface morphology
The surface morphologies characterized by secondary electron-scanning electron microscope(SE-SEM)are shown in Fig.2 and 3 respectively for bP-PEO and gP-PEO as a function of PEO processing time.For 15s and 30s treated bP-PEO only sub-micron pores were observed and only from 1min processing onwards micro-pores along with sub-micron pores appeared in the formed coatings(Fig.2).However,as shown in Fig.3,for both 15s and 30s treated gP-PEO it appeared that no coated layers have formed and only some deposition in the form of discrete particles were visible.The absence of a coated layer for 15s and 30s treated gP-PEO was consistent with its less steep cell voltage-time slope,shown in Fig,1.However,for gP-PEO from 1min PEO processing time onwards,a coated layer was also observed.Only 1min treated gP-PEO had sub-micron pores while both microns-pores and sub-micron pored were observed for 2min treated gP-PEO sample onwards.Micro-cracks were also observed for both bP-PEO and gP-PEO particularly from respectively 2min and 4min PEO processing time onwards.These micro-cracks resulted from the relieving of thermal stress induced during PEO processing.The glycerol addition to the phosphate-based electrolyte promoted the micro-cracks formation as more micro-cracks were observed for gP-PEO than for bP-PEO.This contrasts the finding of our previous article[29]where the glycerol addition to the silicate-based electrolyte
Fig.4(a)illustrates that some distinctly localized deposits formed around Al8Mn5intermetallic phase for 15s treated bP-PEO.A few pores and cracks were also visible on those deposits.These pores and cracks might plausibly be created due to the occurrence of localized micro-discharge around Al8Mn5phase at 15s PEO processing time for bP-PEO which was quite earlier than the global micro-discharge occurrence observed at 30s PEO processing time.The composition profil across Al8Mn5phase revealed slight enrichment of O and P content at Al8Mn5/α-Mg interface for 15s treated bP-PEO.The microstructure in Fig.4(b)showed relatively larger pores and thicker layer at Al8Mn5/α-Mg interface for 30s treated bP-PEO compared to that overα-Mg matrix phase.The composition profil across Al8Mn5phase illustrates that a higher O and P content and a lower Al and Mn content were observed for 30s treated bP-PEO compared to the same for 15s treated bP-PEO.This suggests that a considerable layer has grown over Al8Mn5phase at 30s PEO processing time.However,Mg content over Al8Mn5phase was almost similar for both 15s and 30s treated bP-PEO.Furthermore,P content was slightly lower over Al8Mn5phase than overα-Mg matrix phase for 30s treated bP-PEO indicating preferential P enrichment in the formed layer overα-Mg matrix phase.Fig.4(c)revealed larger pores over and around Al8Mn5phase than overα-Mg matrix phase for 1min treated bP-PEO.It also appeared from the morphology shown in Fig.4(c)that relatively thicker layer formed over Al8Mn5phase than overα-Mg matrix phase.For 1min treated bP-PEO,both P and O content increased,and both Al and Mn content further decreased over Al8Mn5phase when compared to the same for 30s treated bP-PEO.This suggests that the coated layer over Al8Mn5phase has grown more in thickness for 1min treated bP-PEO compared to that for 30s treated bP-PEO.Moreover,the elemental content of P over both Al8Mn5andα-Mg phases was similar for 1min treated bP-PEO suggesting that the P content equilibrated over them.Interestingly,Mg content over Al8Mn5phase for 1min treated bP-PEO was considerably higher compared to 30s treated bP-PEO indicative of plausible MgO formation by redeposited from the adjacent molten pool(resulted due to microdischarges)on top of Al8Mn5phase.
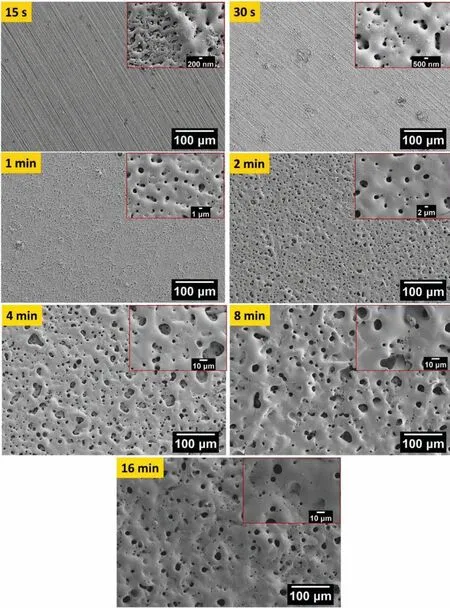
Fig.2.SE-SEM images showing the microstructural evolution of bP-PEO coatings on the AM50 substrate as a function of PEO processing time.
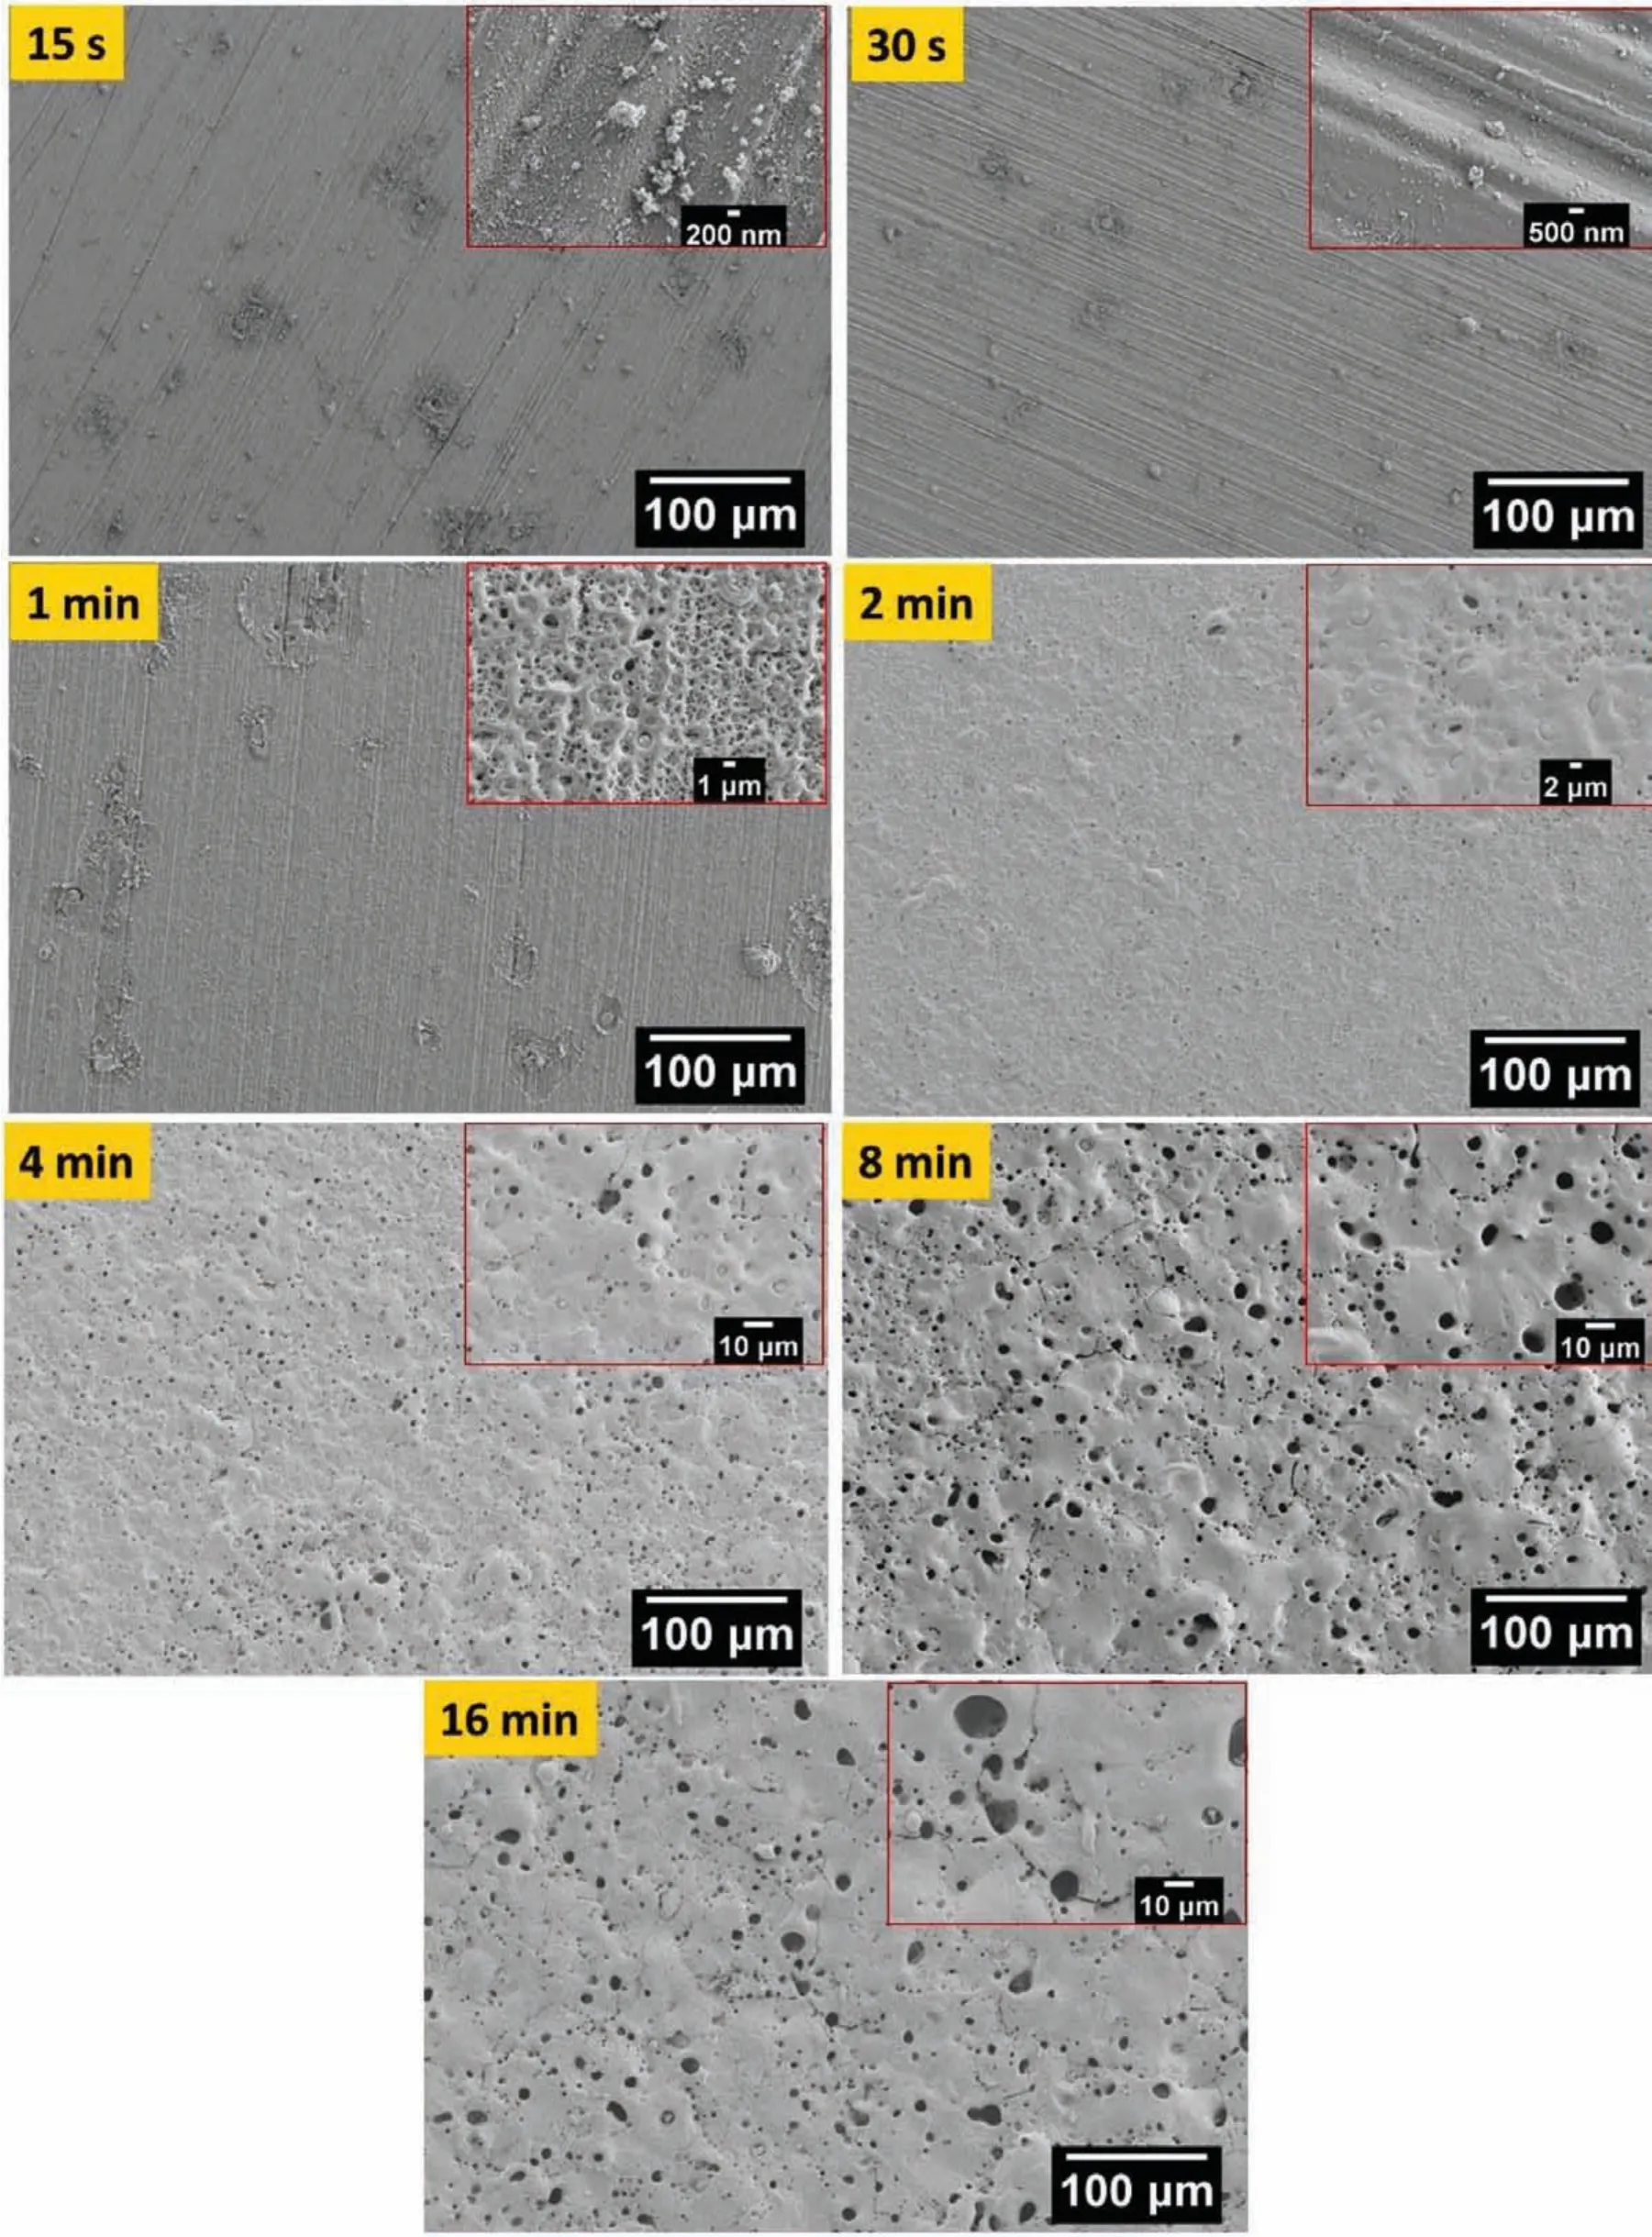
Fig.3.SE-SEM images showing the microstructural evolution of gP-PEO coatings on the AM50 substrate as a function of PEO processing time.
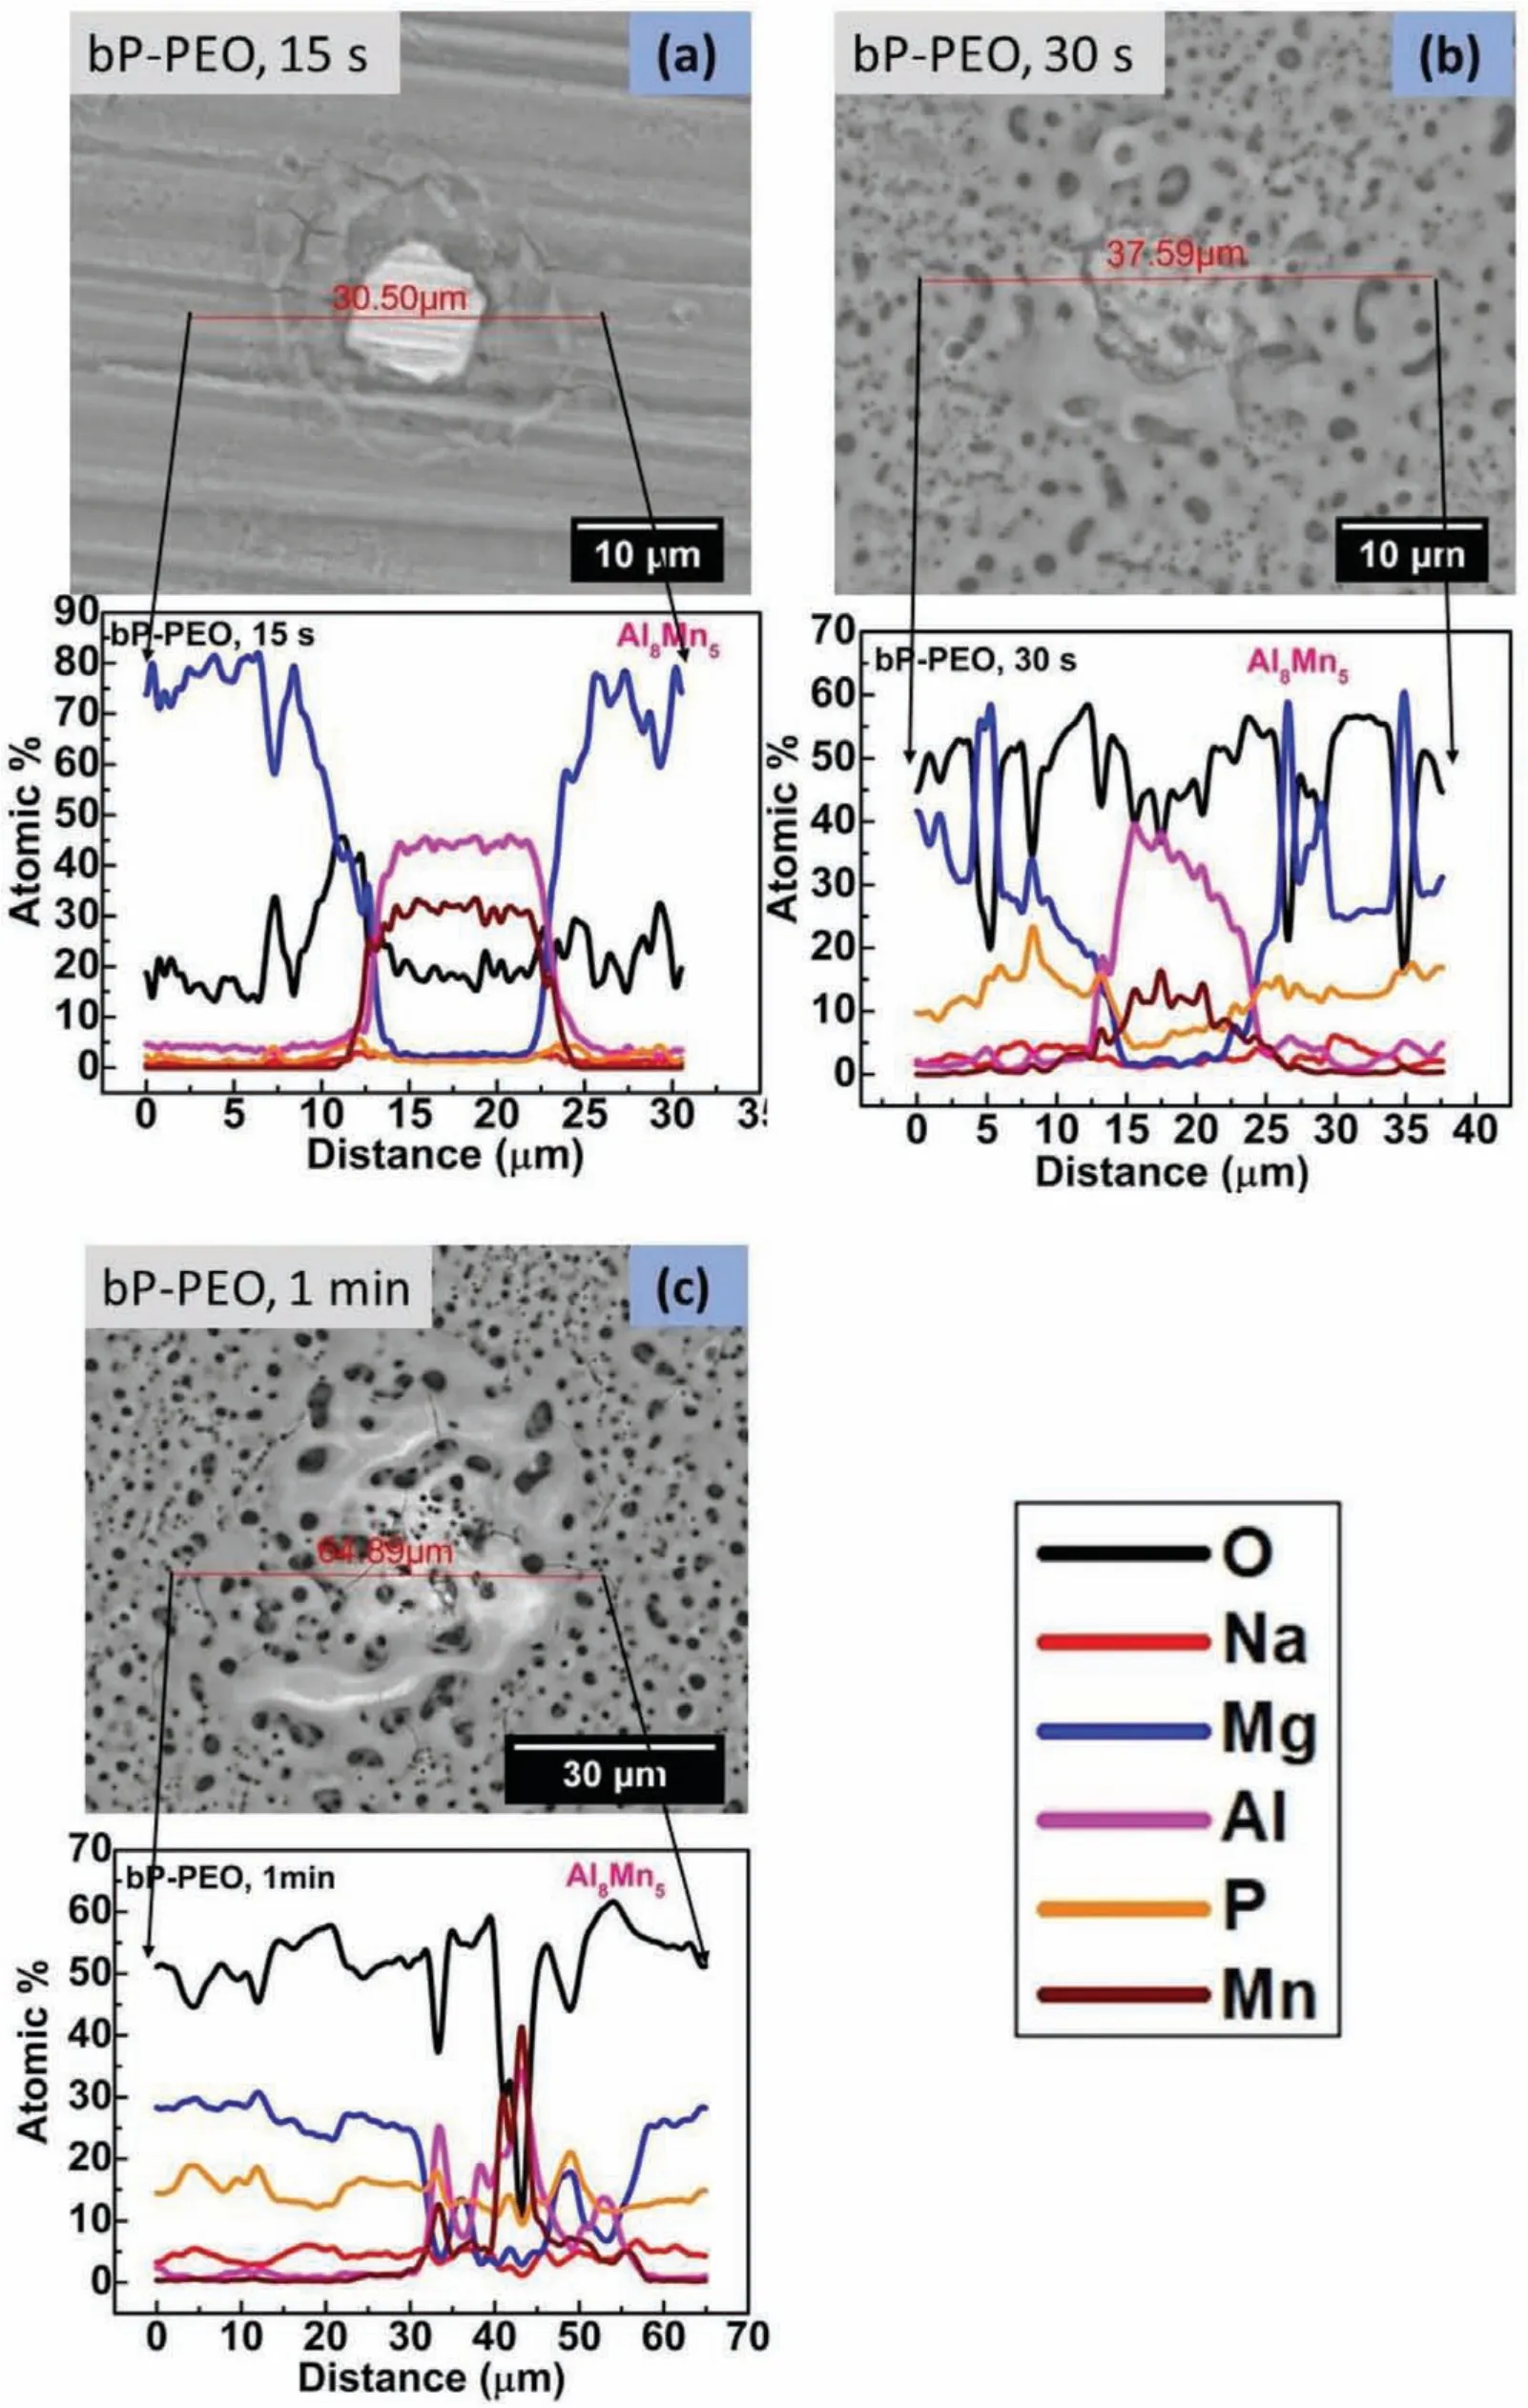
Fig.4.Backscattered SEM images showing microstructures around Al8Mn5 phase with composition profil across it for(a)15s,(b)30s,and(c)1min treated bP-PEO.
In the case of 15s treated gP-PEO the microstructure shown in Fig.5(a)revealed thatα-Mg matrix phase dissolution occurred at Al8Mn5/α-Mg interface along with someα-Mg matrix phase dissolution in the surrounding of the Al8Mn5phase.It is widely known that metal dissolution is the firs phenomena to occur during the PEO processing.Fig.5(b)for 30s treated gP-PEO depicted the progressingα-Mg matrix phase dissolution at Al8Mn5/α-Mg interface and around the Al8Mn5phase.However,the extent ofα-Mg matrix phase dissolution observed for 30s treated gP-PEO was higher compared to dissolution for 15s treated gP-PEO.Herein,the observance ofα-Mg matrix phase dissolution and absence of early micro-discharge for 15s and 30s treated gP-PEO indicated that the glycerol addition resulted in a more sluggishα-Mg matrix phase dissolution and henceforth no or very thin passive layer formed over the sample surface during the PEO processing.This also corroborated well with the voltagetime curves depicting lesser slope for gP-PEO(shown in Fig.1)and microstructures showing discrete particle deposition(shown in Fig.3 for both 15s and 30s treated gP-PEO).Moreover,the composition profil across Al8Mn5phase for 15s and 30s treated gP-PEO depicted no enrichment of O and P content at the Al8Mn5/α-Mg interface as observed in the case of corresponding bP-PEO.Interestingly,the higher O content over Al8Mn5phase compared to theα-Mg matrix phase suggested the formation of some localized and very thin passivating dielectric oxide layer over it.Fig.5(c)illustrates that larger pores were present over Al8Mn5phase compared to theα-Mg matrix phase for 1min treated gPPEO.This suggests that the localized micro-discharge plausibly started in the time intermediated between 30s and 1min PEO processing for gP-PEO around and over the Al8Mn5phase.There was an increase in O,Mg,and P content while both Al and Mn content decreased over Al8Mn5phase for 1min treated gP-PEO when compared to the same for 30s treated gP-PEO.Moreover,there was an increase in O and P content while Mg content decreased over theα-Mg matrix phase for 1min treated gP-PEO compared to the same for 30s treated gP-PEO.This indicates that a considerable passive layer had been formed over both the Al8Mn5andα-Mg matrix phases for 1min treated gP-PEO when compared to earlier PEO processing where no or very thin passive layer was observed.Noticeably for 1min treated gP-PEO,the elemental P content over both the Al8Mn5andα-Mg matrix phases were the same as observed for 1min tretaed bP-PEO.This is suggestive of equilibration of P content occurred at the same processing time for both bP-PEO and gP-PEO even though the coated layer formation started at different processing times.However,the elemental content of both O and P decreased while Mg content increased over both Al8Mn5andα-Mg matrix phases for 1min treated gP-PEO than for the corresponding bP-PEO.This suggests that the relatively thinner passive layer formed over Al8Mn5phase for 1 min treated gP-PEO compared to the corresponding bP-PEO.Thus,the observance of the localized early micro-discharge around and over Al8Mn5phase and the relatively thicker passive layer over it for both bP-PEO and gP-PEO suggests that the PEO discharges over Al8Mn5phase preceded overα-Mg matrix phase in the phosphate electrolyte.This is in line with the finding of our previous investigation[29].
Fig.6 depicted that the interface region of another intermetallic phase,Mg17Al12,present in AM50 substrate exhibited neither localized early micro-discharge and norα-Mg dissolution as observed at the Al8Mn5/α-Mg interface for 15s treated bP-PEO and both 15s and 30s treated gPPEO respectively.The pores observed over both Mg17Al12andα-Mg phases for 15s treated bP-PEO,shown in Fig.6(a),were of almost similar size while no pores were observed over both Mg17Al12andα-Mg matrix phases for both 15 sand 30s treated gP-PEO,shown in Fig.6(b)and 6(c)respectively.Moreover,the elemental content of both O and P contents were same over both Mg17Al12andα-Mg matrix phases for 15s treated bP-PEO and for both 15s and 30s treated gP-PEO.These all suggest that no localized early micro discharge occurred at Mg17Al12/α-Mg interface for both bP-PEO and gP-PEO.The higher O content,the lower Mg content,and the presence of pores over both Mg17Al12andα-Mg phases for 15s treated bP-PEO compared to that of both 15s and 30s treated gP-PEO further evidenced that no or relative thin passive layer has been formed in gP-PEO up to 30s processing time.Thus,the microstructures and composition profile are shown in Fig.6 illustrates that localized micro-discharges did not occur at the Mg17Al12/α-Mg interface as observed at Al8Mn5/α-Mg interface for both bP-PEO and gP-PEO.The plausible reason for this is the significan inhomogeneous electrochemical activity between Al8Mn5/α-Mg compared to that between Mg17Al12/α-Mg as the micro galvanic coupling between former was more severe compared to later and has been reported in our previous investigation[29].
3.2.2.Quantitative assessment of pores
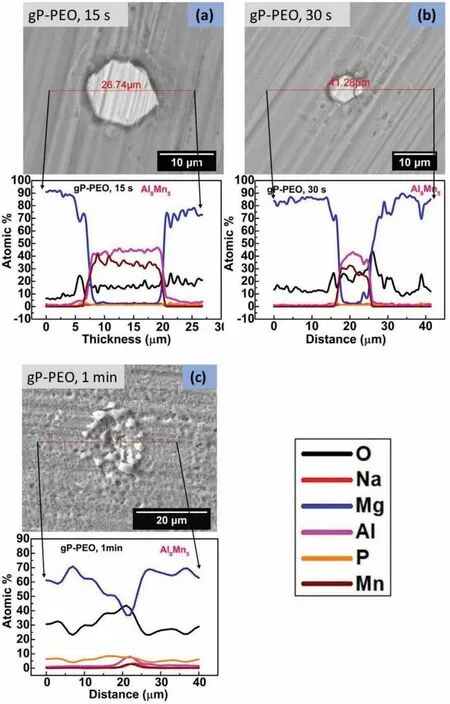
Fig.5.Backscattered SEM images showing microstructures around Al8Mn5 phase with composition profil across it for(a)15s,(b)30s,and(c)1min treated gP-PEO.
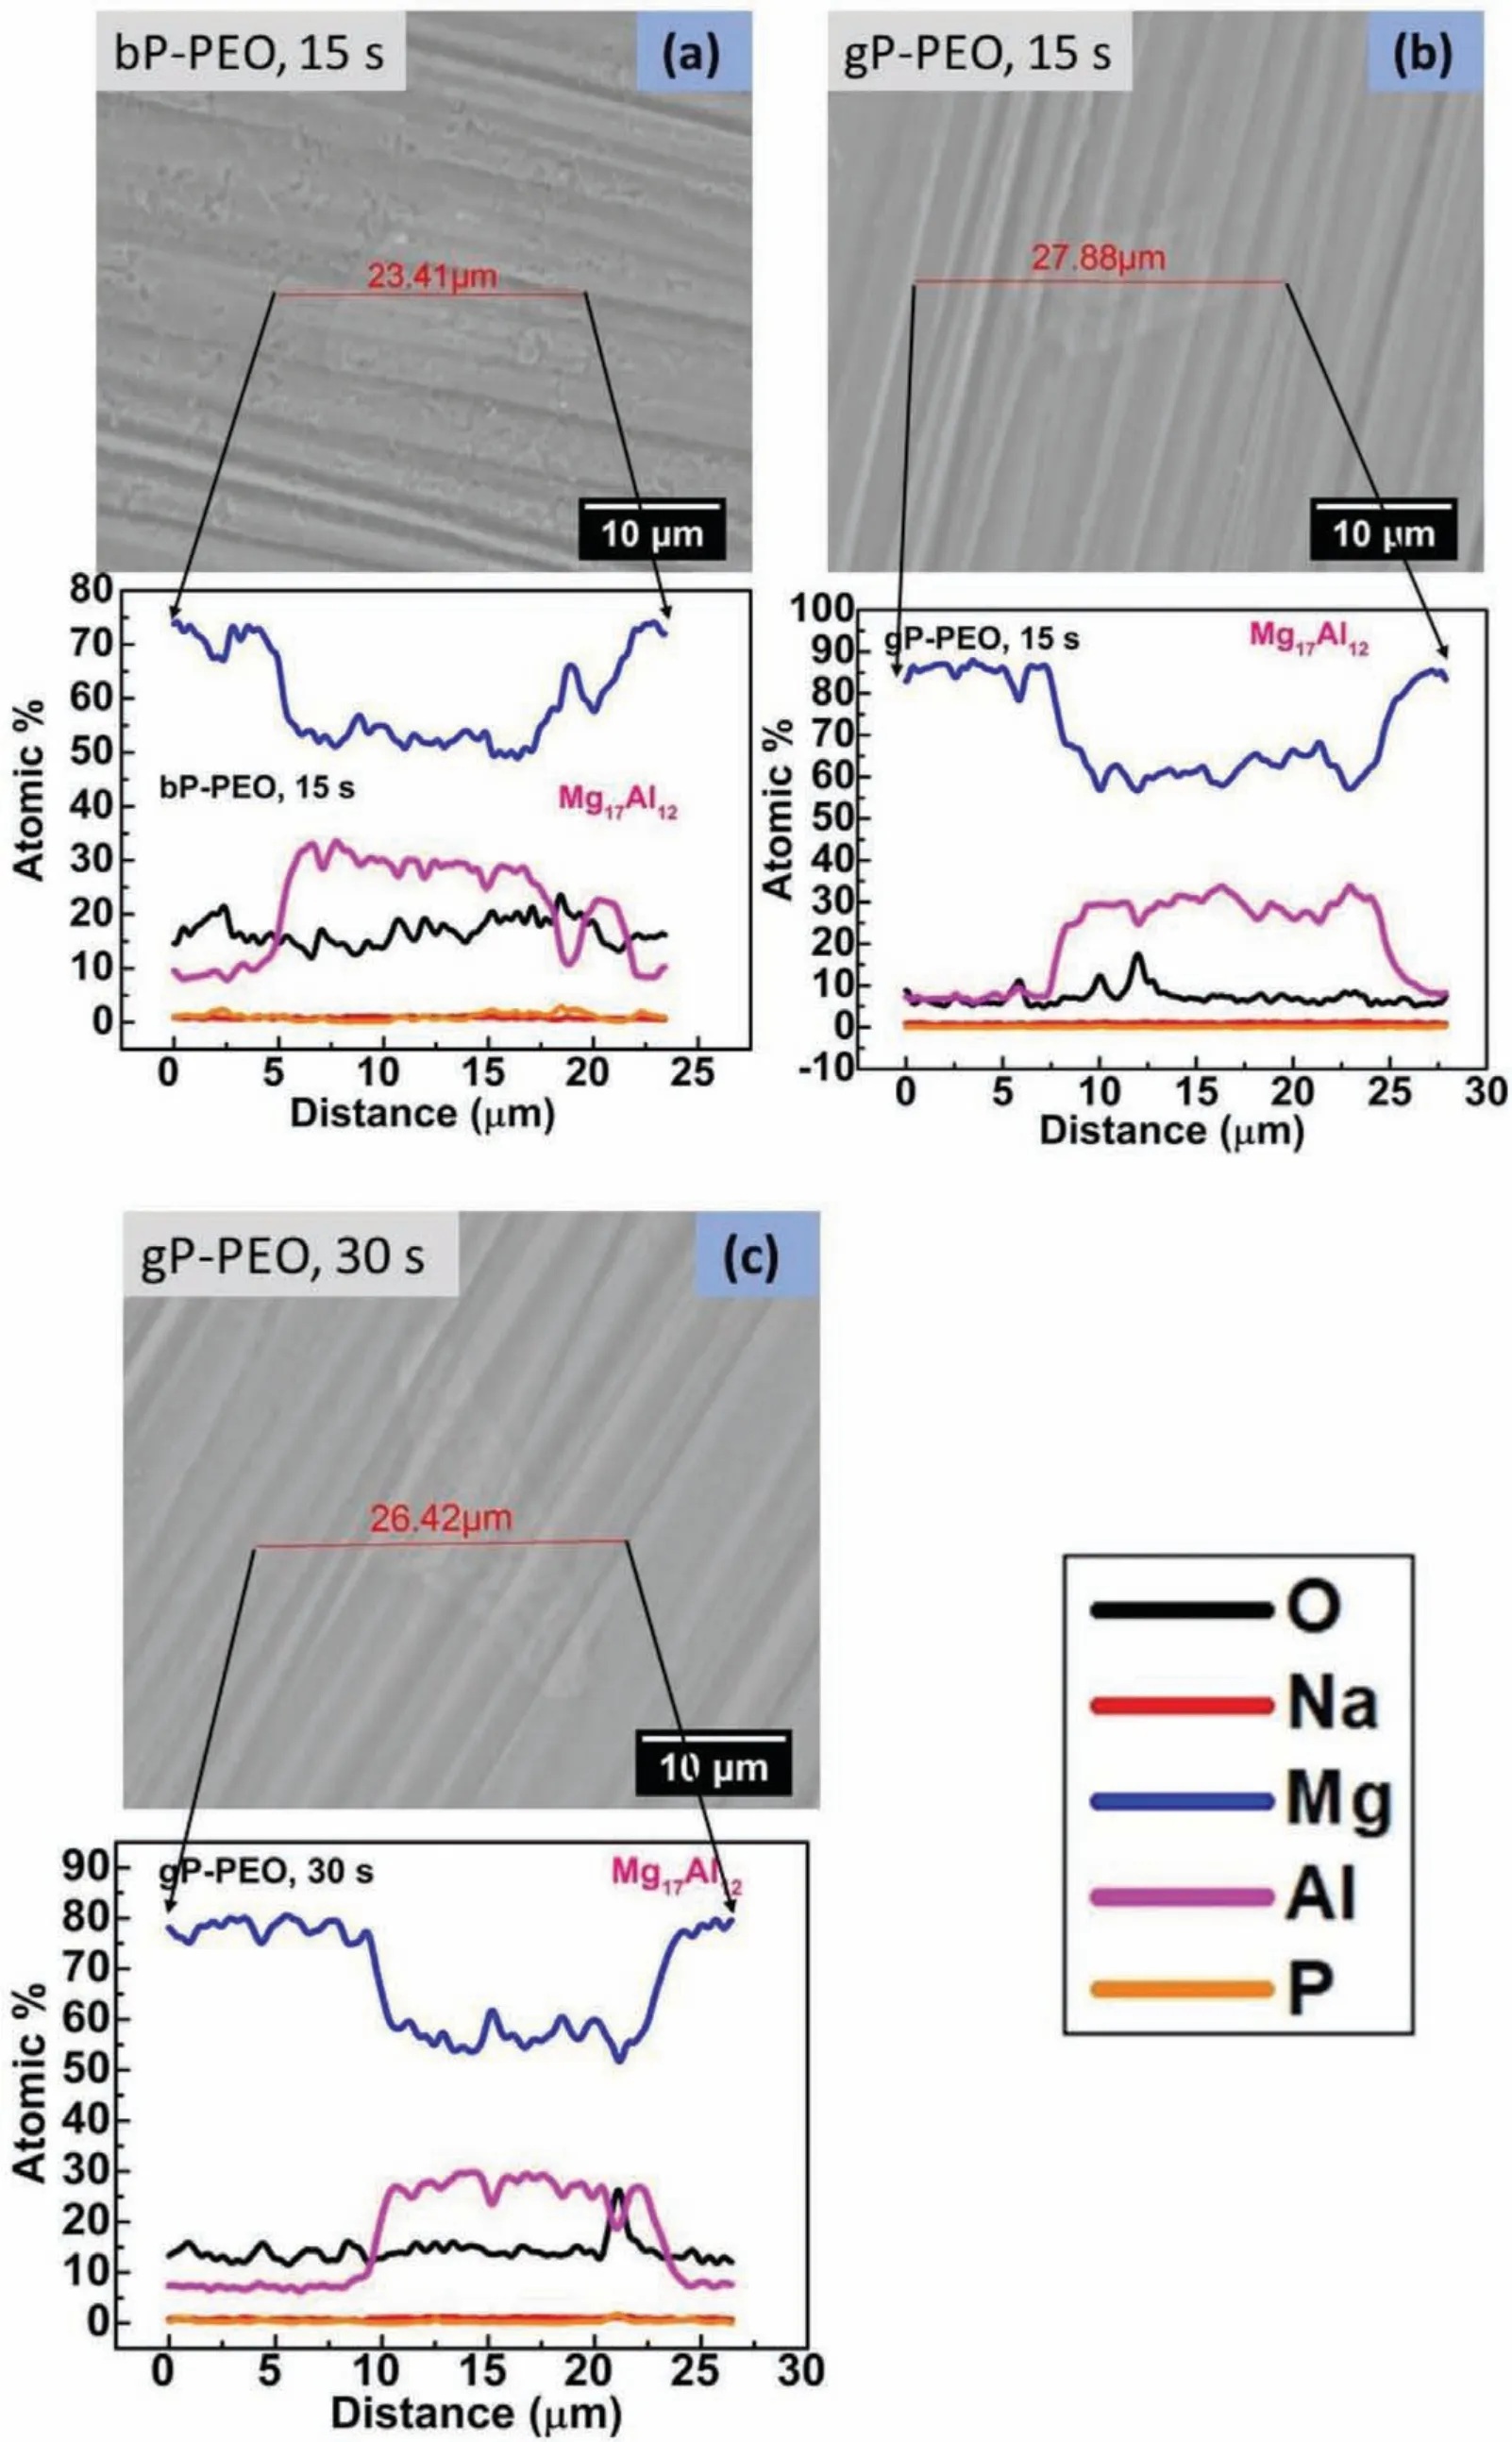
Fig.6.Backscattered SEM images showing microstructures around Mg17Al12 phase with composition profil across it for(a)15s treated bP-PEO,(b)15s treated gP-PEO,and(c)30 s treated gP-PEO.
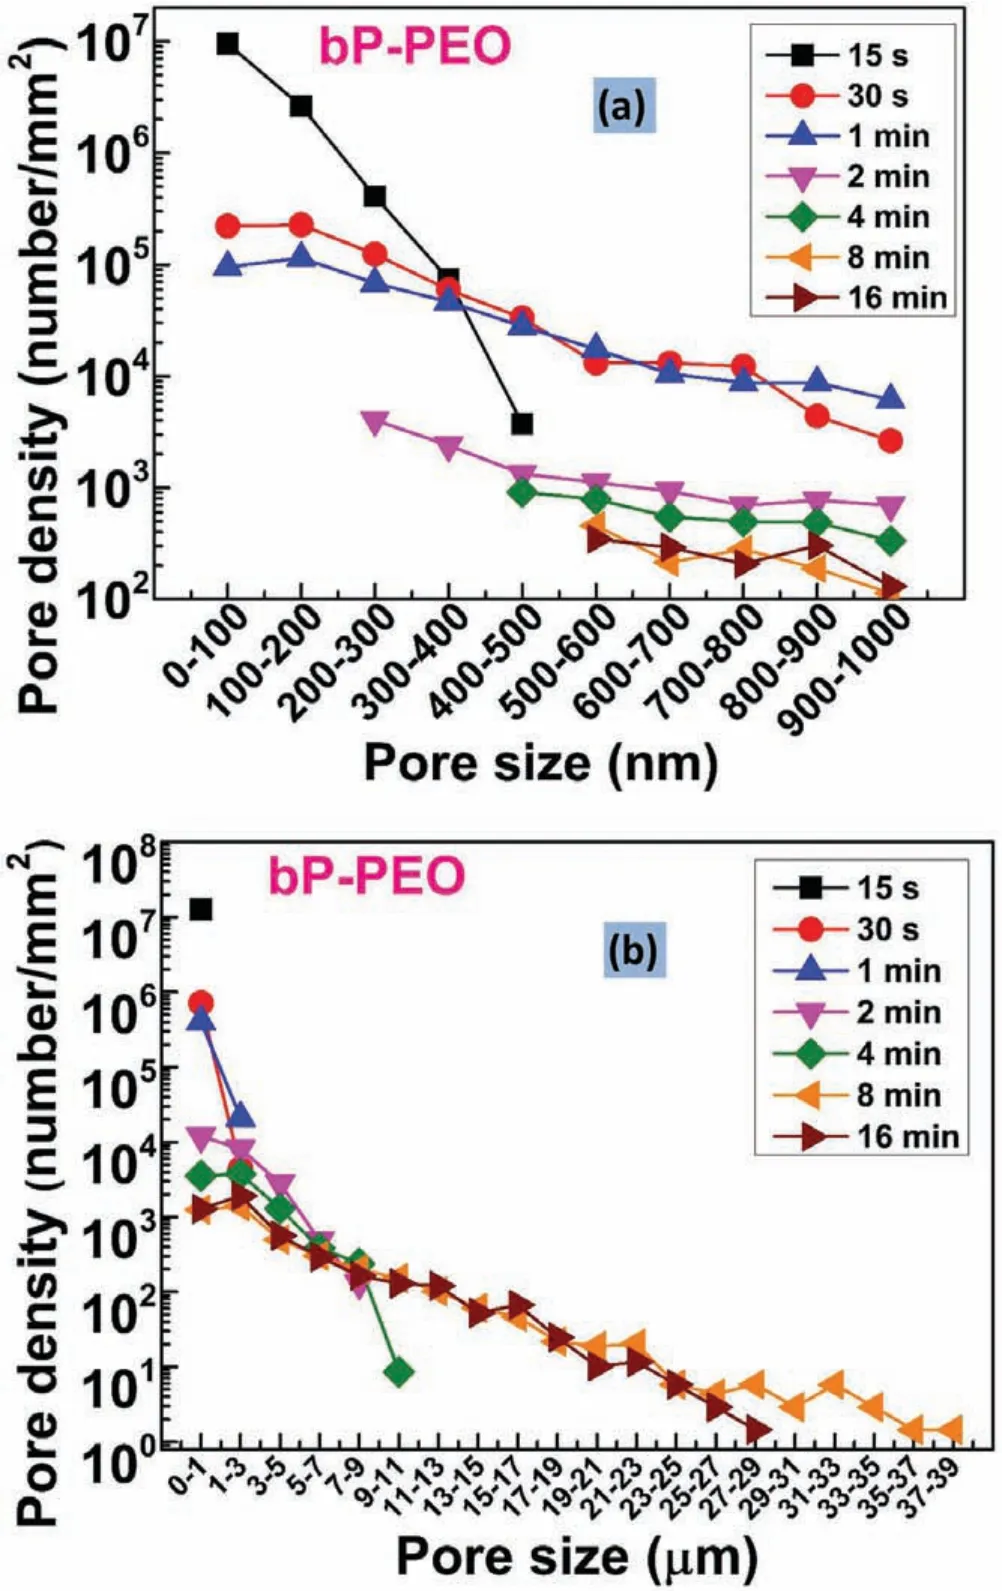
Fig.7.Pore density as a function of pore size(a)sub-micron pores and(b)micro pores for different PEO processing time for bP-PEO.
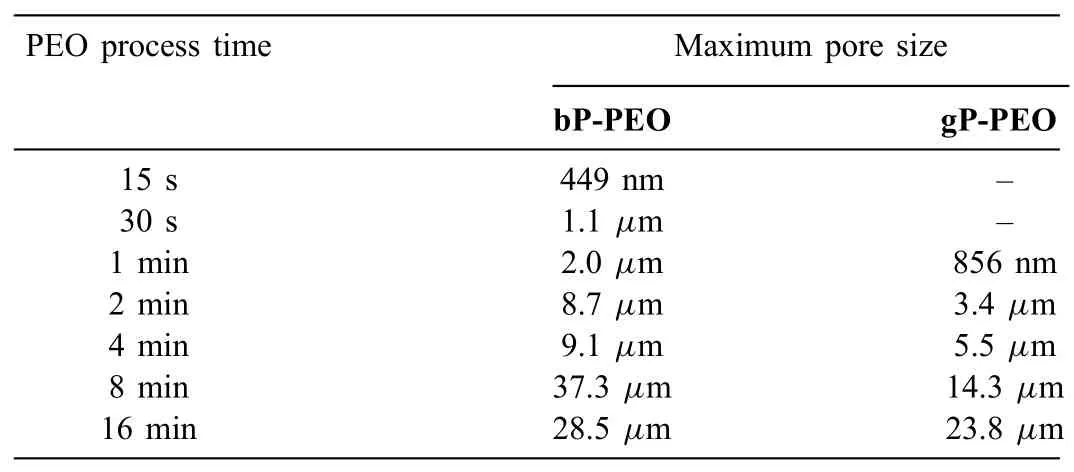
Table 1Maximum pore size as a function of PEO processing time for both bP-PEO and gP-PEO.
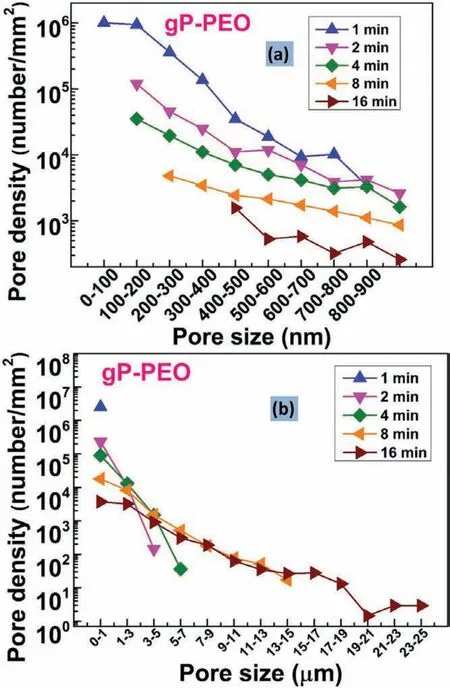
Fig.8.Pore density as a function of pore size(a)sub-micron pores and(b)micro pores for different PEO processing time for gP-PEO.
Fig.7 and 8.shows the pore density for sub-micron pores and micro-pores as a function of pore size for bP-PEO and gP-PEO respectively for all the PEO processing times studied.Both Fig.7 and 8.,in general,depicted that the pore density for both the sub-micron pores and micro-pores decreased with an increase in their size for both bP-PEO and gP-PEO.Interestingly,for the given pore size range,in general,the pore density decreased with the PEO processing time for both bPPEO and gP-PEO.Furthermore,for bP-PEO,the maximum pore size increased up to 8min PEO processing time and then decreased for 16min treated bP-PEO while for gP-PEO the maximum pore size monotonically increased with PEO processing time as shown in Table 1.The observed decreasing pore density for a given pore size range and increasing maximum pore size corroborated quite well with the microdischarge characteristics of increasing intensity and decreasing number density with processing time.However,noticeably the maximum pore size for gP-PEO was smaller when compared to bP-PEO for all the PEO processing times studied.This indicates that the glycerol addition to the phosphatebased electrolyte resulted in reduced micro-discharge intensities.Fig.9 showed the total pore density(sum of sub-micron pore density and micropore density)for both bP-PEO and gP-PEO as a function of PEO processing time.The higher total pore density for gP-PEO than for bP-PEO was discerned from Fig.9.It appeared that the decrease in pore size due to glycerol addition to the phosphate-based electrolyte had been compensated by an increase in total pore density.The smaller pore size and higher pore density resulted in the PEO coatings by the glycerol addition in the phosphate-based electrolyte are in line with the finding of our previous investigation[29].However,herein,the maximum pore size observed in the coatings resulting from phosphate-based electrolyte with and without glycerol addition was larger compared to coatings obtained from the silicate-based electrolyte with and without glycerol additive respectively as reported in our previous article[29].Interestingly,herein,the major contribution of total pore density for gP-PEO came from the sub-micron pores and lower size range of the micro-pores.Fig.10(a)and(b)shows the total surface pore area,%,for both bP-PEO and gP-PEO respectively as a function of PEO processing time.The total surface pore area for bP-PEO and gP-PEO did not show clear trends as a function of PEO processing time.The maximum total surface pore area was observed for 8min treated sample for both bP-PEO and gP-PEO.However,the contribution of sub-micron pores to the total surface pore area decreased with the PEO processing time for both bP-PEO and gP-PEO.Noticeably,the gP-PEO showed lower total surface pore area when compared to the bP-PEO and was attributed to their lower pore size despite its higher total pore density than that for bP-PEO.This suggests that the pore size,herein,predominate the pore density in total surface pore area measurements for both the bP-PEO and gP-PEO.
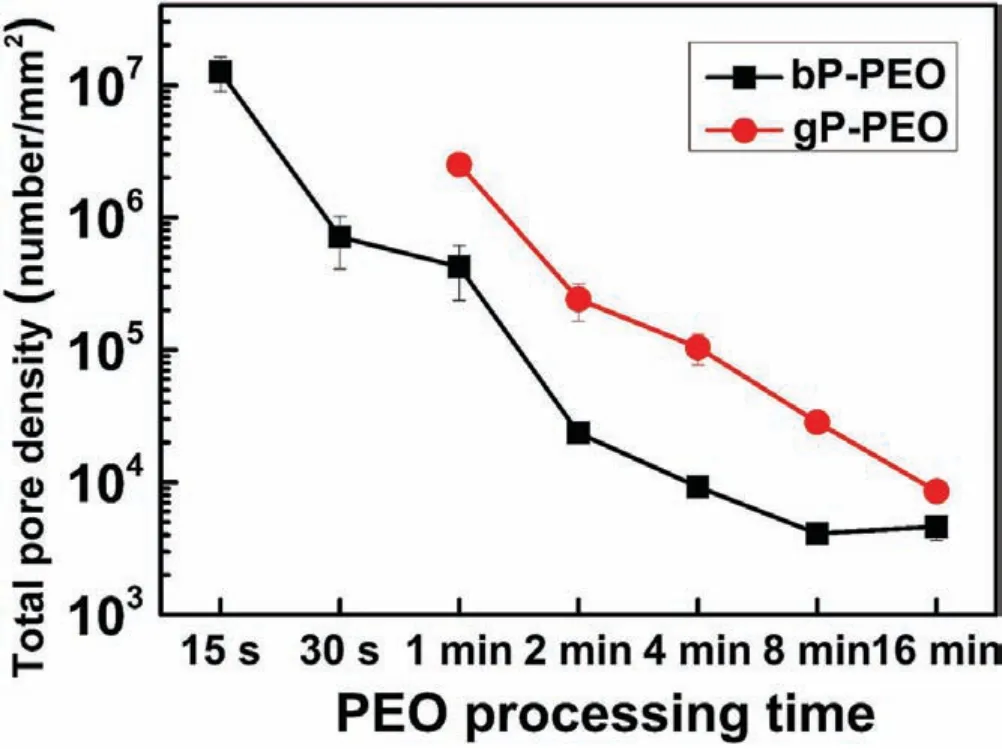
Fig.9.Total pore density as a function of PEO processing time for both bP-PEO and gP-PEO.
3.2.3.Coating cross-section thickness
Fig.11 illustrates the PEO average coating thickness as a function of PEO processing time for both bP-PEO and gPPEO.It was observed that the average coating thickness linearly increased with the PEO processing time for both the bP-PEO and gP-PEO.This linear deposition kinetic for both bP-PEO and gP-PEO is in line with the Faraday's laws of electrolysis.Such validation of Faraday's laws for the linear PEO coating thickness increase with time has been reported by Hussein et al.[38].However,the average coating thickness for gP-PEO was always lower when compared to bP-PEO throughout the PEO processing time.The reduced coating thickness of gP-PEO could be due to the increased viscosity of glycerol added phosphate electrolyte which might slightly retard the electrolytic charged species movement towards the anode surface.Reduced PEO coating thickness with glycerol addition has been reported earlier in other investigations[29,30].The maximum coating thickness for 16min PEO processing time was 50.3±10.4μm and 42.8±8.6μm for bP-PEO and gP-PEO respectively.The coating growth rate calculated from the slopes of thickness-PEO processing time profil revealed a higher growth rate of 3.1±0.04μm/min for bP-PEO compared to 2.6±0.06μm/min for gP-PEO.Herein,the growth rate for coatings obtained from phosphate-based electrolyte with and without glycerol additive was higher than those obtained from the silicate-based electrolyte with and without glycerol additive respectively as reported in our previous article[29].
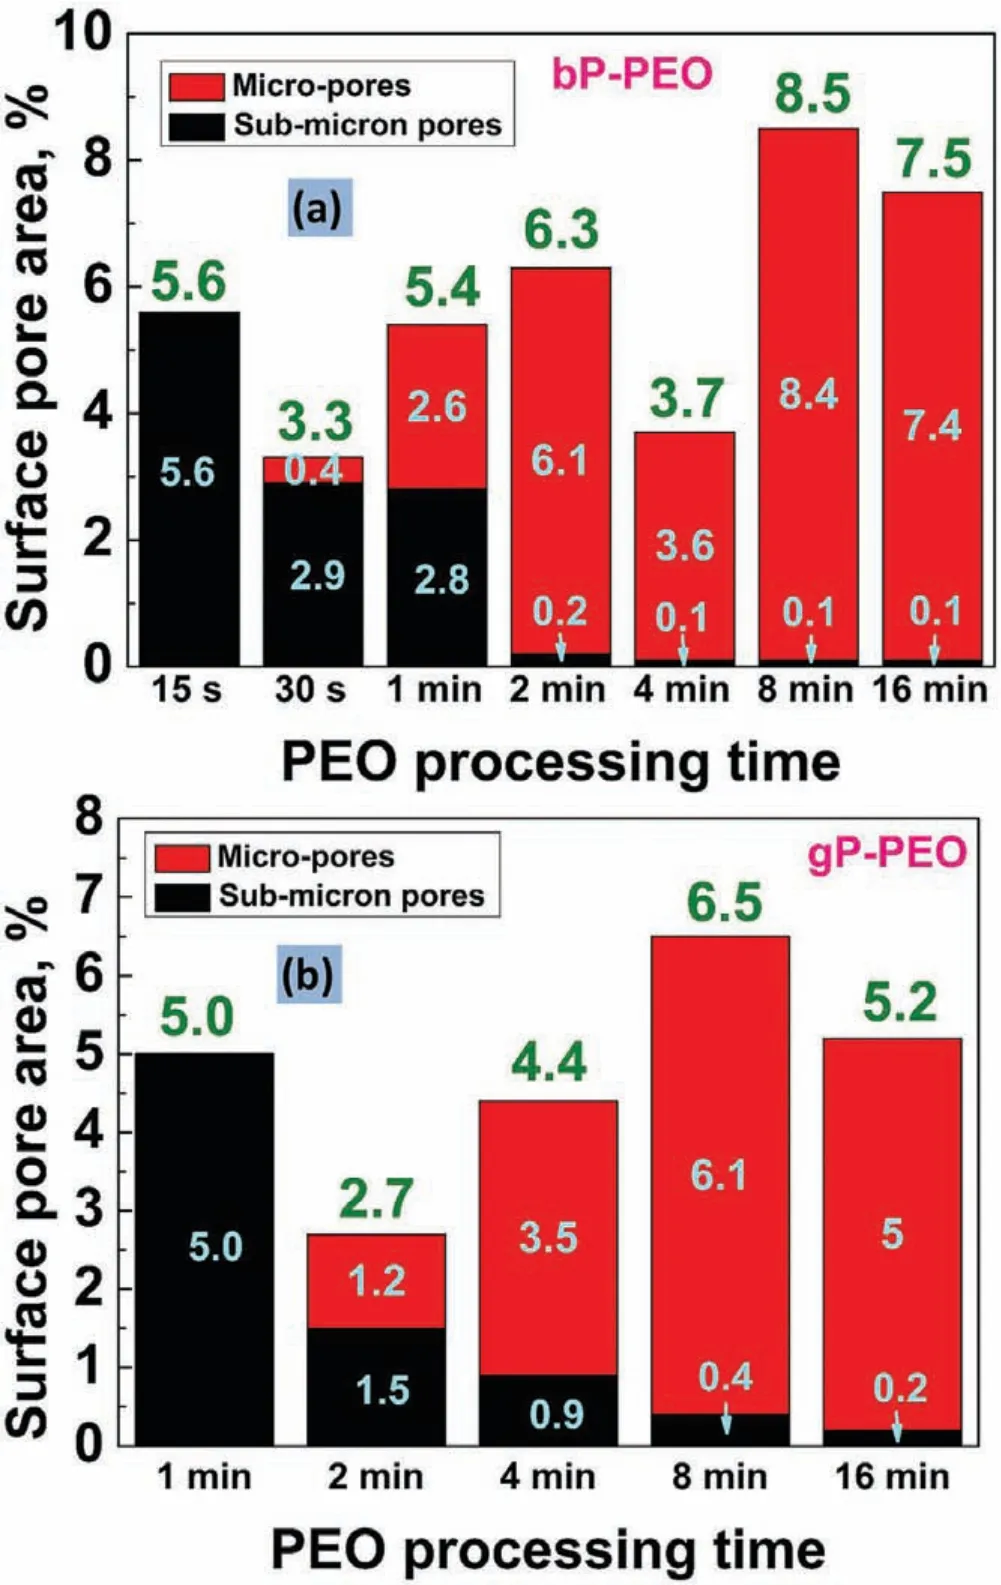
Fig.10.Surface pore area as a function of PEO processing time for(a)bP-PEO and(b)gP-PEO.
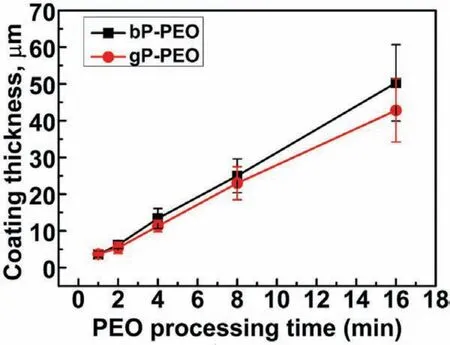
Fig.11.Average coating thickness as a function of PEO processing time for both bP-PEO and gP-PEO.
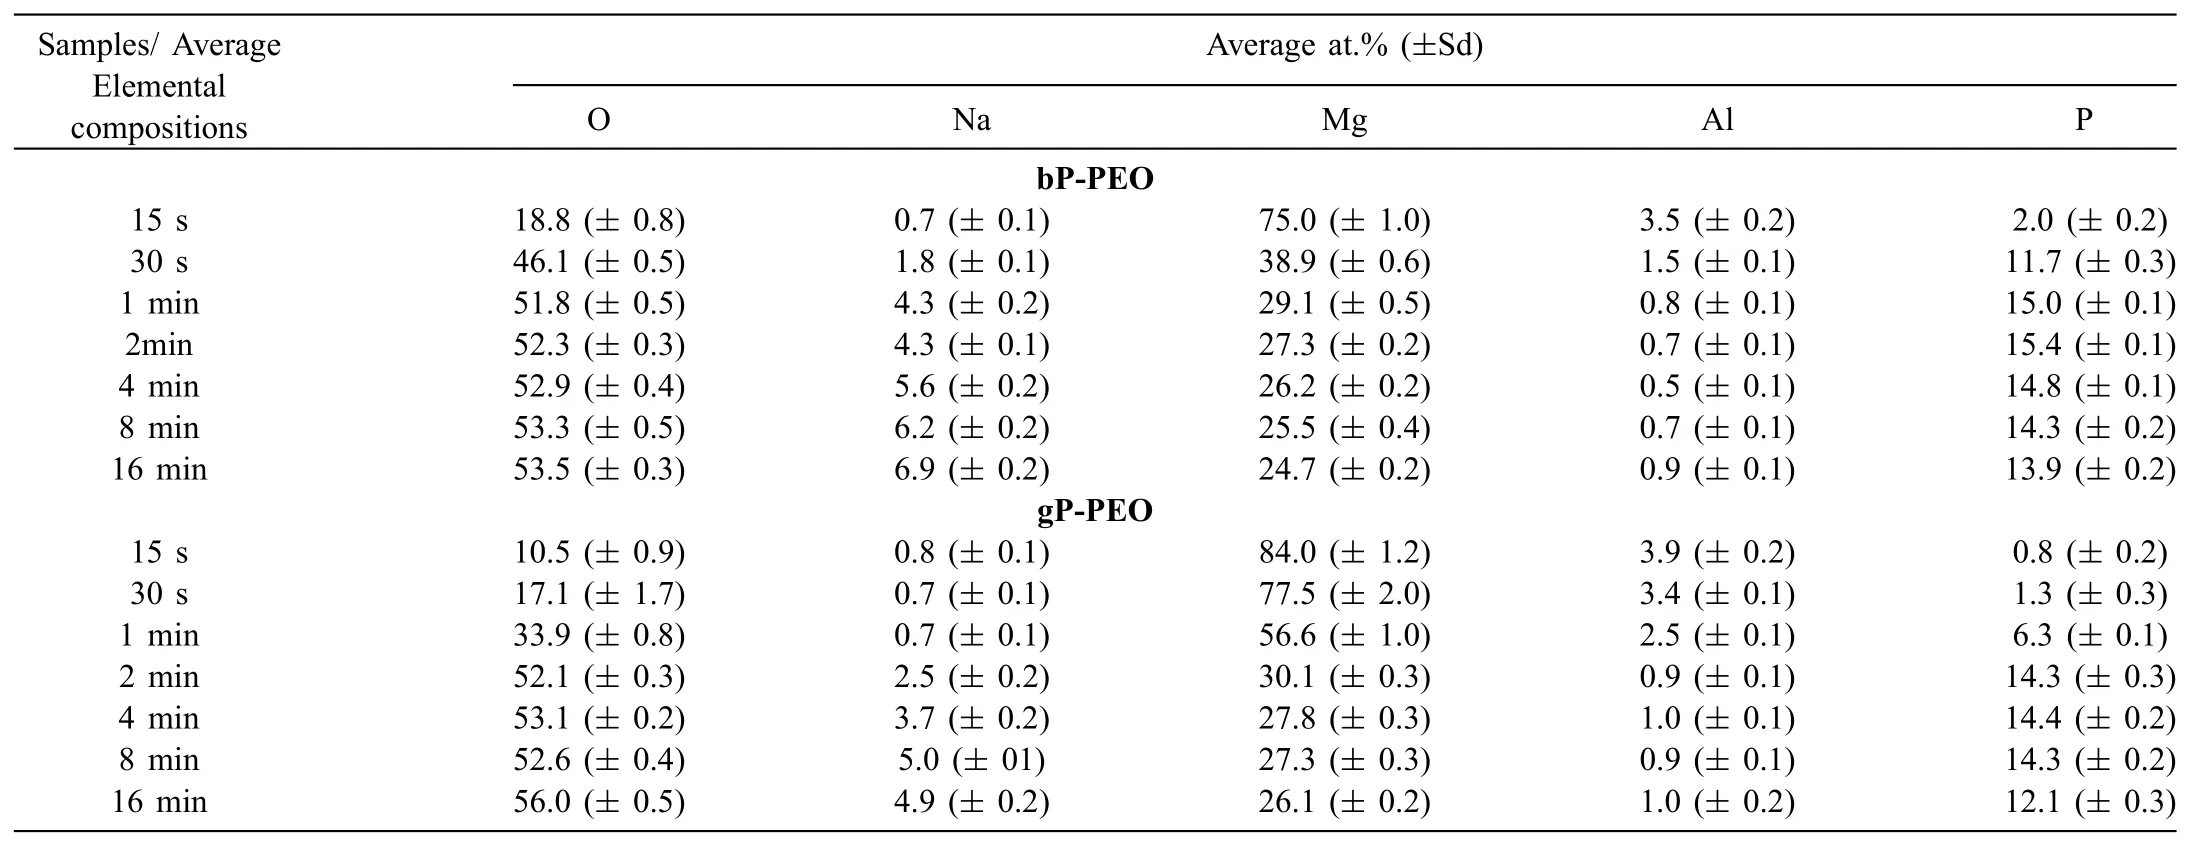
Table 2Elemental composition(at.%)of coatings'top surface as a function of PEO processing time for both bP-PEO and gP-PEO.
3.3.Elemental compositions of PEO coatings
The elemental composition,in atomic percentage,obtained by EDS of the coating top surface for bP-PEO and gP-PEO as a function of PEO processing time are given in Table 2.The coatings are of almost constant composition for both bPPEO and gP-PEO irrespective of PEO processing time.This indicates that both the PEO processing time and glycerol addition to base phosphate electrolyte have no major influenc on the PEO coating composition.However,during the initial PEO processing time(15s and 30s for bP-PEO and 1min for gP-PEO)when the formed coatings were thin enough that the EDS signals were generated from the substrate affecting the coating composition and hence were not representative of actual coatings.The elemental content of O,Mg,and P in both bP-PEO and gP-PEO was around 53 at.%,26 at.%,and 14 at.% respectively.
The through-thickness elemental composition profile as a function of PEO processing time for both bP-PEO and gPPEO are shown in Fig.S1 and S2(in the supplementary file respectively.For thinly coated samples such as 1min treated bP-PEO and gP-PEO and near substrate/coating interface for other samples,the composition profil was transient which was probably due to varying substrate/coating interface at a different location and unwanted EDS signals generated from the substrates.Thus,neglecting the artefacts near substrate/coating interface regions the composition profil illustrates that coatings of almost constant composition were formed irrespective of both PEO processing time and glycerol addition to base phosphate electrolyte.Furthermore,both bPPEO and gP-PEO showed almost the same through-thickness composition for all the PEO processing time.Herein,for bPPEO and gP-PEO,the constant elemental compositions for both the coatings'top surface and their through-thickness profil is in line with the finding of our previous investigations[29]with the silicate-based electrolytes with and without glycerol addition.
3.4.PEO coatings phase analysis by xrd
The XRD patterns for bP-PEO and gP-PEO as a function of PEO processing time are shown in Fig.12 and 13.respectively.Theα-Mg phase diffraction peak from the substrate was observed for all the samples of both bP-PEO and gP-PEO since the characteristic porous structure of PEO coatings allowed the X-rays to penetrate it and reach to the substrate.Such observation of diffraction peak from the substrate in PEO coated samples were reported in other investigations.The crystalline MgO phase was observed to be formed from 15s and 1min PEO processing time onwards for bP-PEO and gP-PEO respectively.The intensity of the MgO phase increased with the PEO processing time for both bP-PEO and gP-PEO as shown in Fig.12(b)and 13(b)respectively.However,the gP-PEO showed significantl higher MgO peak intensity when compared to bP-PEO.This suggests higher MgO phase content for gP-PEO compared to that for bP-PEO.Thus,glycerol addition to the phosphate-based electrolyte fostered MgO formation during PEO processing.The promotion of MgO formation by glycerol addition has been reported in other investigations[29,30].An amorphous hump possibly of Mg3(PO4)2phase was observed in the 2θrange of 20° to 37°(degree)from 4min PEO processing time onwards for both bP-PEO and gP-PEO as shown in Fig.12(c)and 13(c)respectively.Some crystalline Mg3(PO4)2phase peaks were superimposed on Mg3(PO4)2amorphous hump for both 8 and 16min treated bP-PEO as shown in Fig.12(c).However,no such crystalline Mg3(PO4)2phase peaks were observed for any of the gP-PEO specimens as shown in Fig.13(c).This indicated that the glycerol addition to base phosphate electrolyte promoted the Mg3(PO4)2phase amorphization.This is in contrast to our finding in the investigation[29],where the glycerol addition resulted in complete suppression of amorphous(Mg2SiO4)phase formation.
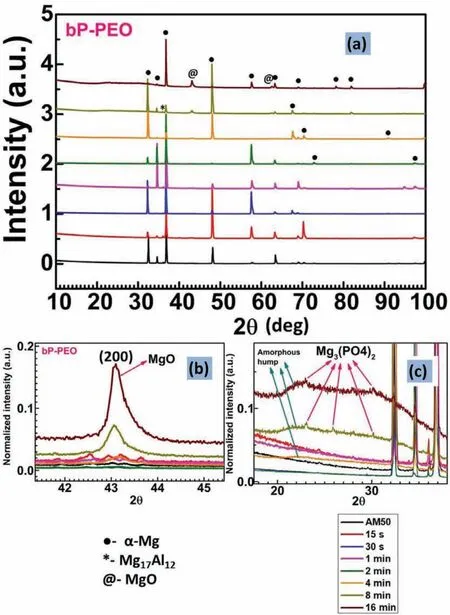
Fig.12.XRD:(a)Overall profile(b)MgO diffraction peak;and(c)Mg3(PO4)2 amorphous hump with few of its crystalline diffraction peak as a function of PEO processing time for bP-PEO.
3.5.Corrosion behaviour of PEO coatings
3.5.1.Open circuits potential
Fig.14(a)and(b)shows the open circuit potential(OCP)evolution as a function of immersion time in 0.5wt.% NaCl for bP-PEO and gP-PEO respectively.With the increase in immersion time,the OCP moved rapidly towards more noble potentials during the very initial immersion time and later onwards became nearly constant for both the bP-PEO and gPPEO coatings.It has been reported that the OCP stabilization signifie a stable corrosion process[39].Thus,the OCP evolution depicted that the corrosion processes were not stable during very early immersion and then after 25h immersion time the corrosion process stabilized for both bP-PEO and gPPEO.No trends in OCP evolution was observed as a function of PEO processing time for both bp-PEO and gP-PEO.However,comparatively more fluctuation in OCP were noticed for bP-PEO than for gP-PEO suggestive of a more stabilized corrosion process for the later.Herein,our finding of a more stabilized corrosion process resulted from glycerol addition corroborated well with our previous investigation[29].
3.5.2.Electrochemical impedance spectroscopy study
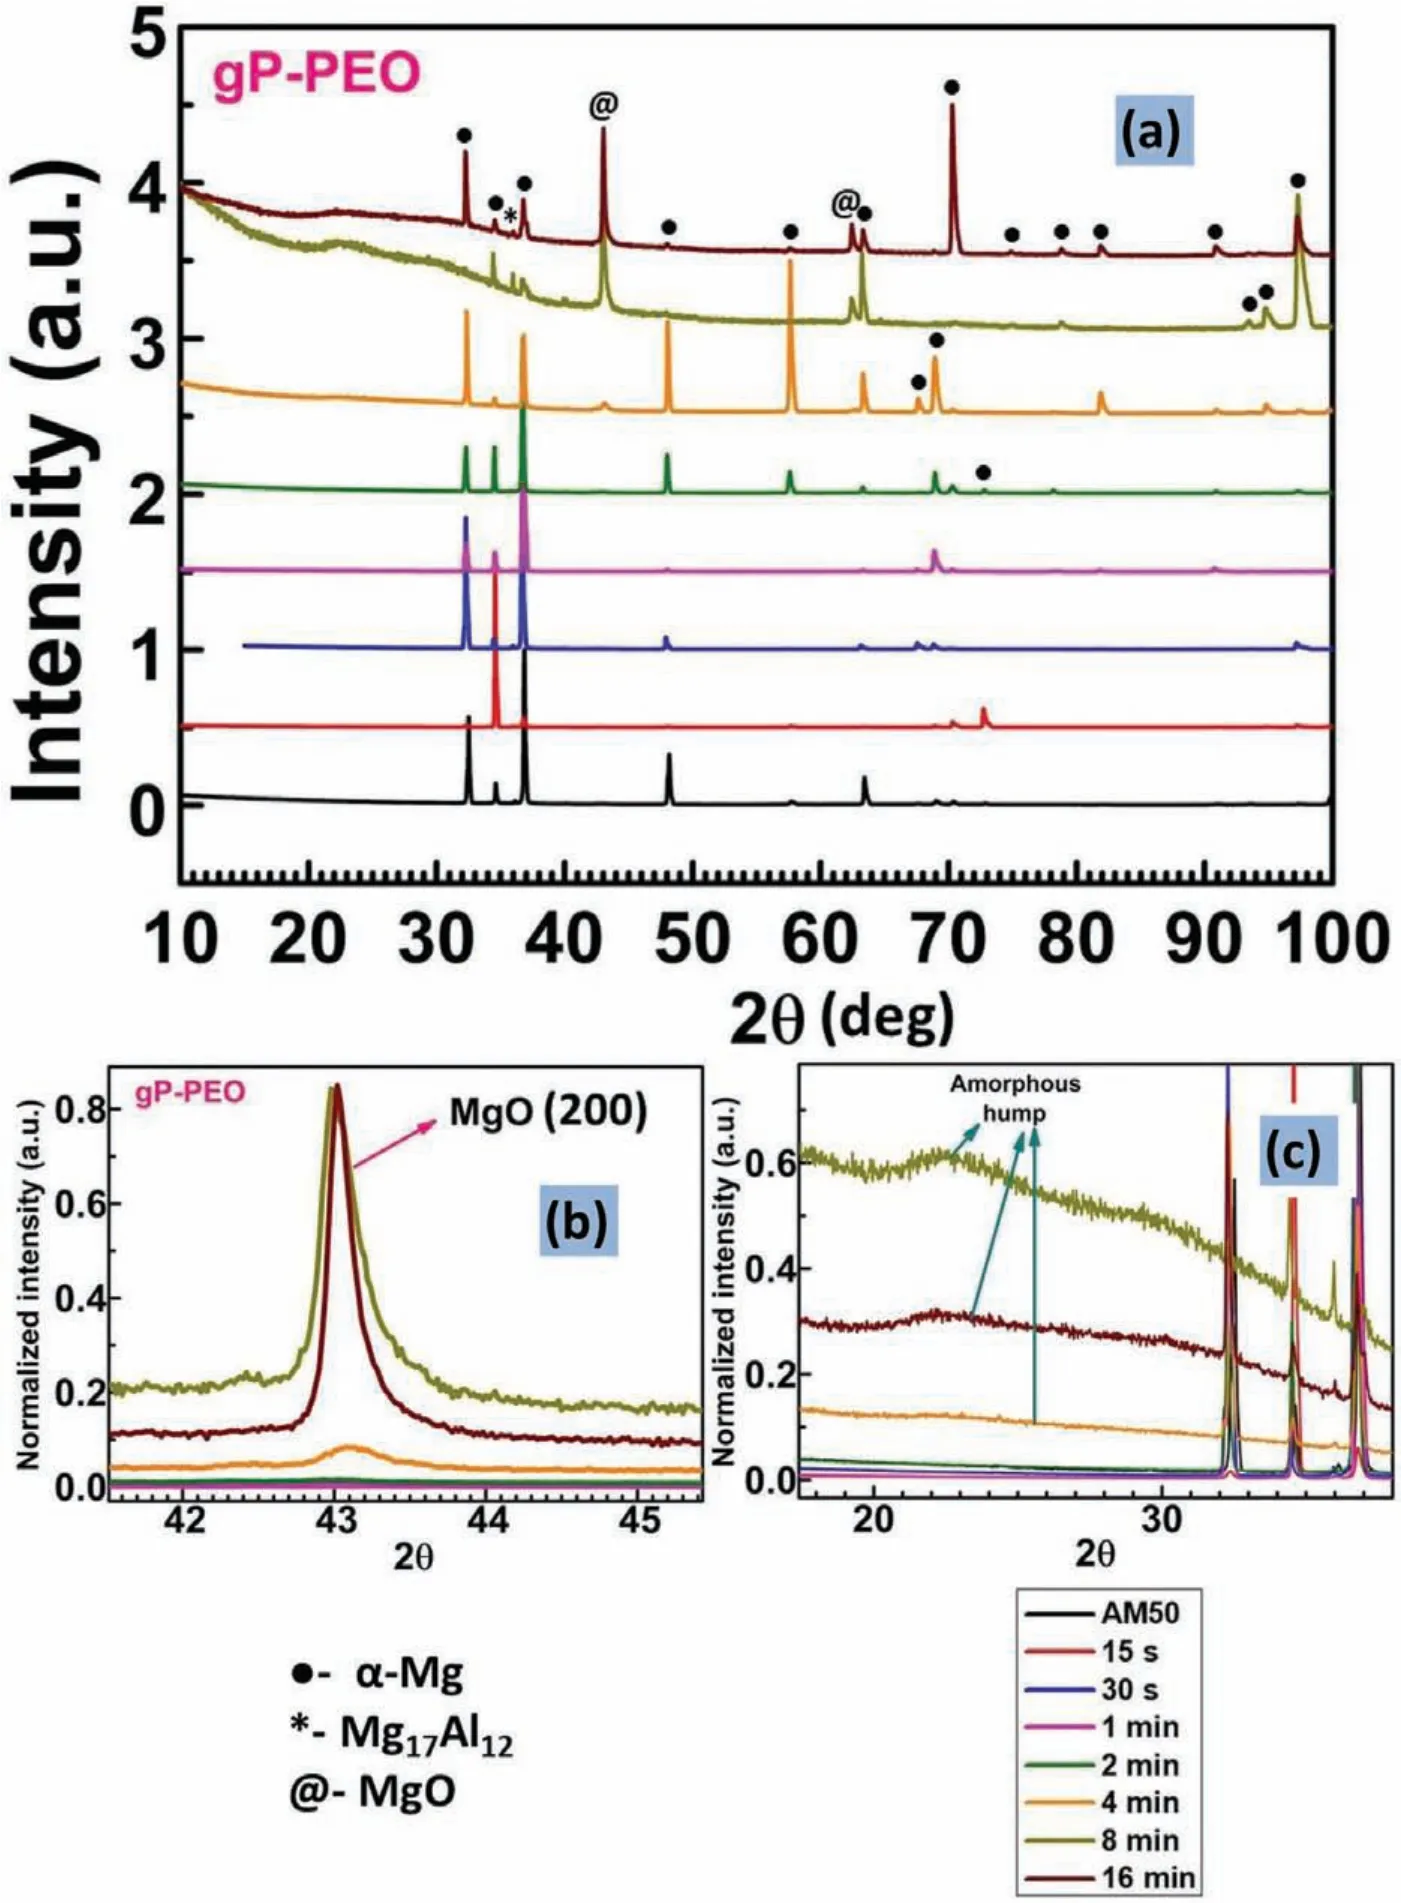
Fig.13.XRD:(a)Overall profile(b)MgO diffraction peak;and(c)Mg3(PO4)2 amorphous hump as a function of PEO processing time for gP-PEO.
To elucidate long term corrosion behaviour for both bPPEO and gP-PEO electrochemical impedance spectroscopy was carried out as a function of various immersion time between initial 0.5h and fina 201h immersion time.The Nyquist plots as a function of immersion time are shown in Fig.15 and 16.for bP-PEO and gP-PEO respectively.It is widely known that low-frequency inductive loop manifests the relaxation of corrosion products and thus indicates the presence of localized corrosion.Thus,herein,localized coating failure was observed for 15s,30s,and 4min treated bPPEO at 50h,176h,and 75h of immersion time respectively.However,no localized coating failure was noticed for 1min,2min,8min,and 16min treated bP-PEO.While for gP-PEO only 1min treated sample showed localized coating failure at 25hrs of immersion time.This indicated improved corrosion behaviour of gP-PEO than for bP-PEO in terms of localized PEO coating failure and thus localized corrosion occurrence.The Bode impedance plot for all the bP-PEO and gP-PEO studied herein are shown in Fig.S3 and S4(supplementary file respectively.Similarly,the Bode phase angle plot for all the bP-PEO and gP-PEO studied herein are shown in Fig.S5 and S6(supplementary f le)respectively.
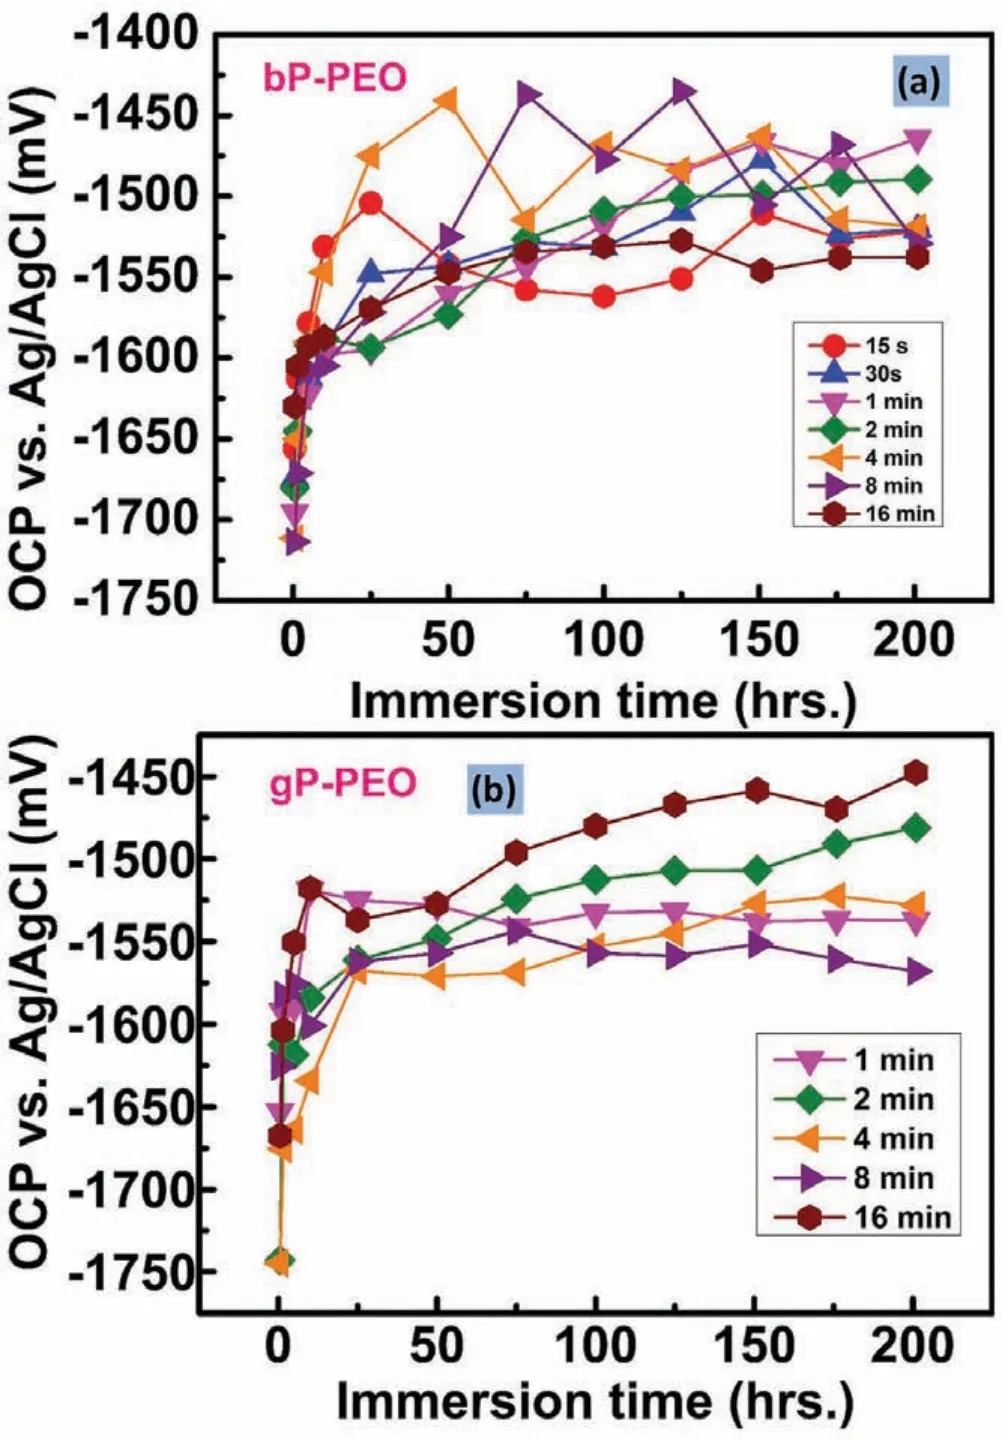
Fig.14.Evolution of open-circuit potentials(OCPs)with the electrolyte immersion time as a function of PEO processing time for(a)bP-PEO and(b)gP-PEO.
Fig.17(a)and(b)shows the variation of impedance modulus at the lowest frequency(100 mHz employed for EIS)with the immersion time for bP-PEO and gP-PEO respectively.The impedance modulus for 15s and 30s treated bPPEO remained to a nearly constant value having an order of magnitude of 104ohm.cm2for up to 25h and 150h immersion time respectively and then onwards it progressively decreased to the order of 103ohm.cm2with the immersion time.The impedance modulus for bP-PEO samples treated for both 1min and 2min PEO processing time exhibited approximately the same impedance modulus of the order of 104ohm.cm2throughout the immersion time.The 4min treated bP-PEO showed a sudden fall in impedance modulus from its initial value of the order of 104ohm.cm2as its value suddenly decreased to the order of 103ohm.cm2at 25h and then onwards again increased and then decreased with the immersion time.The initial impedance modulus for 8min and 16min treated bP-PEO were in the order of 105ohm.cm2and 106ohm.cm2respectively which was quite higher than earlier(15 s to 4 min)treated PEO samples.With the immersion time,the impedance modulus values for 8min and 16min treated bP-PEO dropped to order of 104ohm.cm2and 105ohm.cm2respectively at 1.5h and 5h immersion time and then onwards remained almost constant.The impedance modulus values for 1min treated gP-PEO during initial immersion were in the order of 104ohm.cm2which then progressively decreased to the order of 103ohm.cm2with the immersion time.The impedance modulus for 15s treated bP-PEO and 1min treated gP-PEO almost varied in a similar fashion.For both 2min and 4min treated gP-PEO,the impedance modulus fluctuate with the immersion time and remained in order of 104ohm.cm2and never decreased to order 103ohm.cm2as observed for the case of their corresponding bP-PEO.For 8min treated gP-PEO the impedance modulus was not varied much with the immersion time and interestingly was slightly higher than for corresponding bP-PEO.However,although impedance modulus was not varied much for 16min treated gP-PEO with the immersion time,their values were signifi cantly lower than for both 8min treated gP-PEO and 16min treated bP-PEO.Thus,the impedance modulus variations with the immersion time suggested that the corrosion resistance of gP-PEO coatings,particularly for 2 to 8min treated samples,were better than for corresponding bP-PEO.However,16min bP-PEO exhibited better corrosion resistance than for corresponding gP-PEO.Herein,for both bP-PEO and gP-PEO,the impedance modulus for the initial and fina immersion is in the line with the finding of our previous article[29].More insights on why for the gP-PEO the initial impedance and fina impedance were,in general,lower and higher respectively compared to bP-PEO can be obtained by modelling the EIS spectra with electrochemical equivalent circuits.For the comparison,the electrochemical behaviour(OCP evolution vs.immersion time curve,Nyquist plot,Bode impedance plot,Bode phase angle plot,electrochemical equivalent circuit,and its element value)of bare AM50 magnesium alloy substrate can be obtained from our previous investigation[29].
3.5.3.Electrochemical equivalent circuit modelling
The measured electrochemical impedance spectroscopy spectra were modelled with the electrochemical equivalent circuits shown in Fig.18 using complex non-linear least square methods.It has been earlier reported that the two distinct layers constituted the PEO coating on Mg and its alloy system[39-41].Thus,herein,the two-layered structure i.e.outer porous layer and inner barrier layer were employed for the electrochemical equivalent circuit modelling.The various elements used in the electrochemical equivalent circuit shown in Fig.18 are described as Rsrepresents the electrolyte solution resistance;CPE(OL)and CPE(IL)represents the constant phase element of the outer porous layer and inner barrier layer respectively;R(OL)and R(IL)represents the resistance of the outer porous layer and inner barrier layer respectively;Wsrepresents Warburg impedance-short circuit terminus;CPE(dl)represents a constant phase element of the electrical double layer;Rctrepresents the charge transfer resistance;L represents the inductance associated localized failure and Rlrepresents the local environmental change.The details regarding CPE and Wswere described in short elsewhere[29].Tables 3 and 4 listed the circuits elements values extracted from the electrochemical equivalent circuit modelling for both bPPEO and gP-PEO after initial immersion time(0.5h)and fi nal immersion time(201h)respectively.Theχ2values obtained herein suggested the goodness of f ts was quite well between measured electrochemical impedance spectroscopy spectra and electrochemical equivalent circuit modelled spectra.
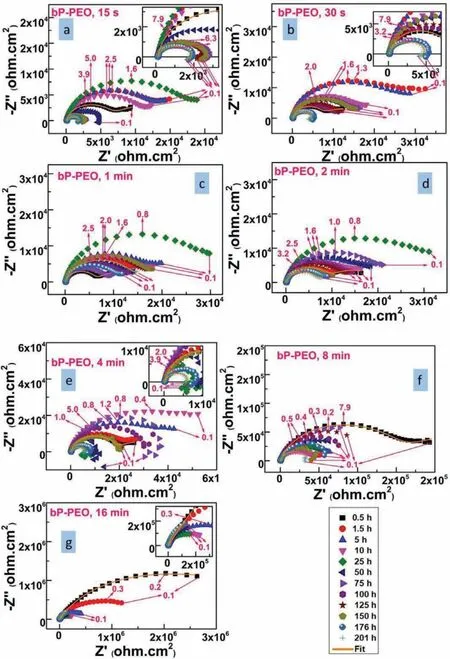
Fig.15.The Nyquist plot as a function of electrolyte immersion time for bP-PEO treated with(a)15s,(b)30s,(c)1min,(d)2min,(e)4min,(f)8min,and(g)16min PEO processing time.
The Cl¯ion concentration gradient existed as the Cl¯ions diffused towards the inner barrier layer from the outer porous layer and thereby led to the presence of Warburg diffusion impedance(Ws)during initial immersion time for all bP-PEO and gP-PEO.The presence of Wselement in the electrochemical equivalent circuit has been reported in several articles[42-44]related to PEO coatings on the Mg alloy system.During initial immersion time,the magnitude of Warburg Pseudoresistance,RW,for both bP-PEO and gP-PEO was higher in later PEO processing time when compared to earlier PEO processing time.This could be due to an increased difficult for chloride diffusion towards the barrier layer with the PEO processing time as the outer porous layer became thicker.However,it was observed that the magnitude of RWwas higher(varied in the range of 103-106ohm.cm2with PEO processing time)for bP-PEO when compared to gP-PEO(varied in the range of 103-104ohm.cm2with PEO processing time)during initial immersion.This suggested that the corrosive chloride diffuses much easier towards the barrier layer for gP-PEO than for bP-PEO during the initial immersion time.This could be due to the relatively higher outer porous layer thickness for bP-PEO than for gP-PEO.However,during the fina immersion,only the 1min and 2min treated bP-PEO exhibited the presence of Wswhile for gP-PEO all the studied samples except 1min treated PEO exhibited the same.This indicates Cl¯ions were still diffusing into the inner barrier layer and not fully ingressed the inner barrier layer for the samples which exhibited the presence of Wsduring fnal immersion.This exhibition of Wsduring fina immersion also indicated the protectiveness of the inner barrier layer was quite good for 2 to 16min treated gP-PEO when compared to all bP-PEO except for 1min & 2min PEO treated.
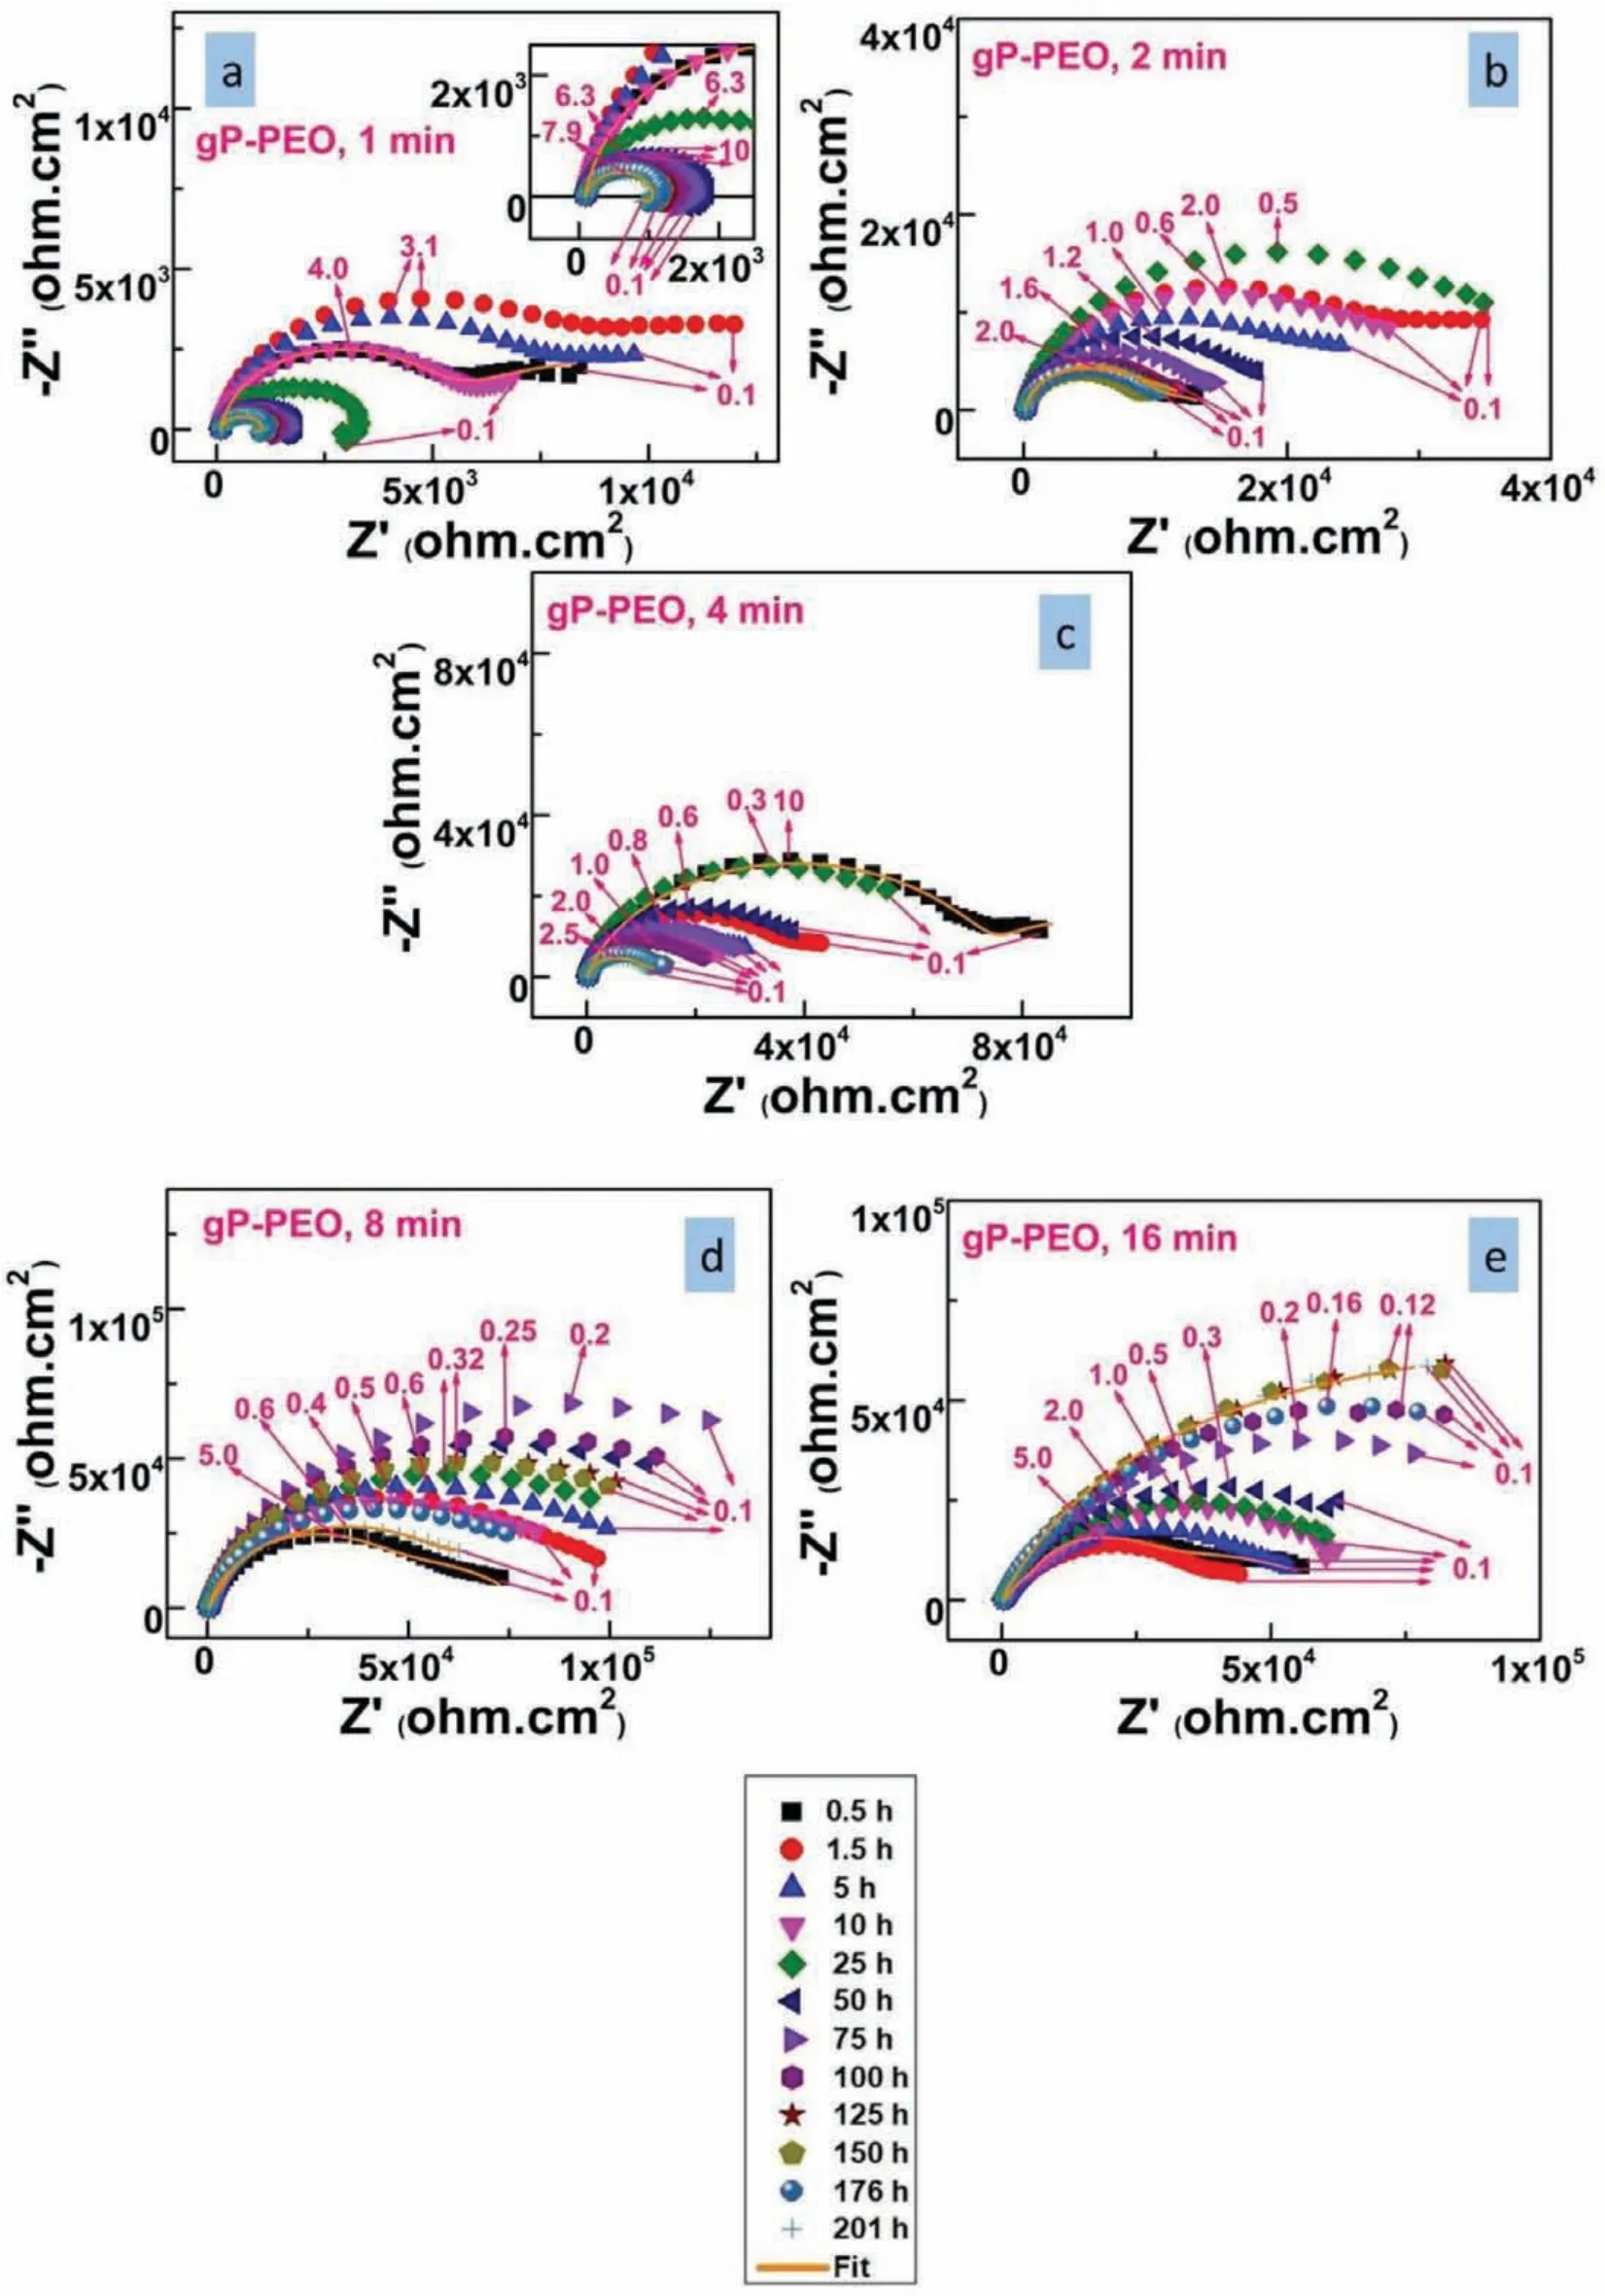
Fig.16.The Nyquist plot as a function of electrolyte immersion time for gP-PEO treated with(a)1min,(b)2min,(c)4min,(d)8min,and(e)16min PEO processing time.
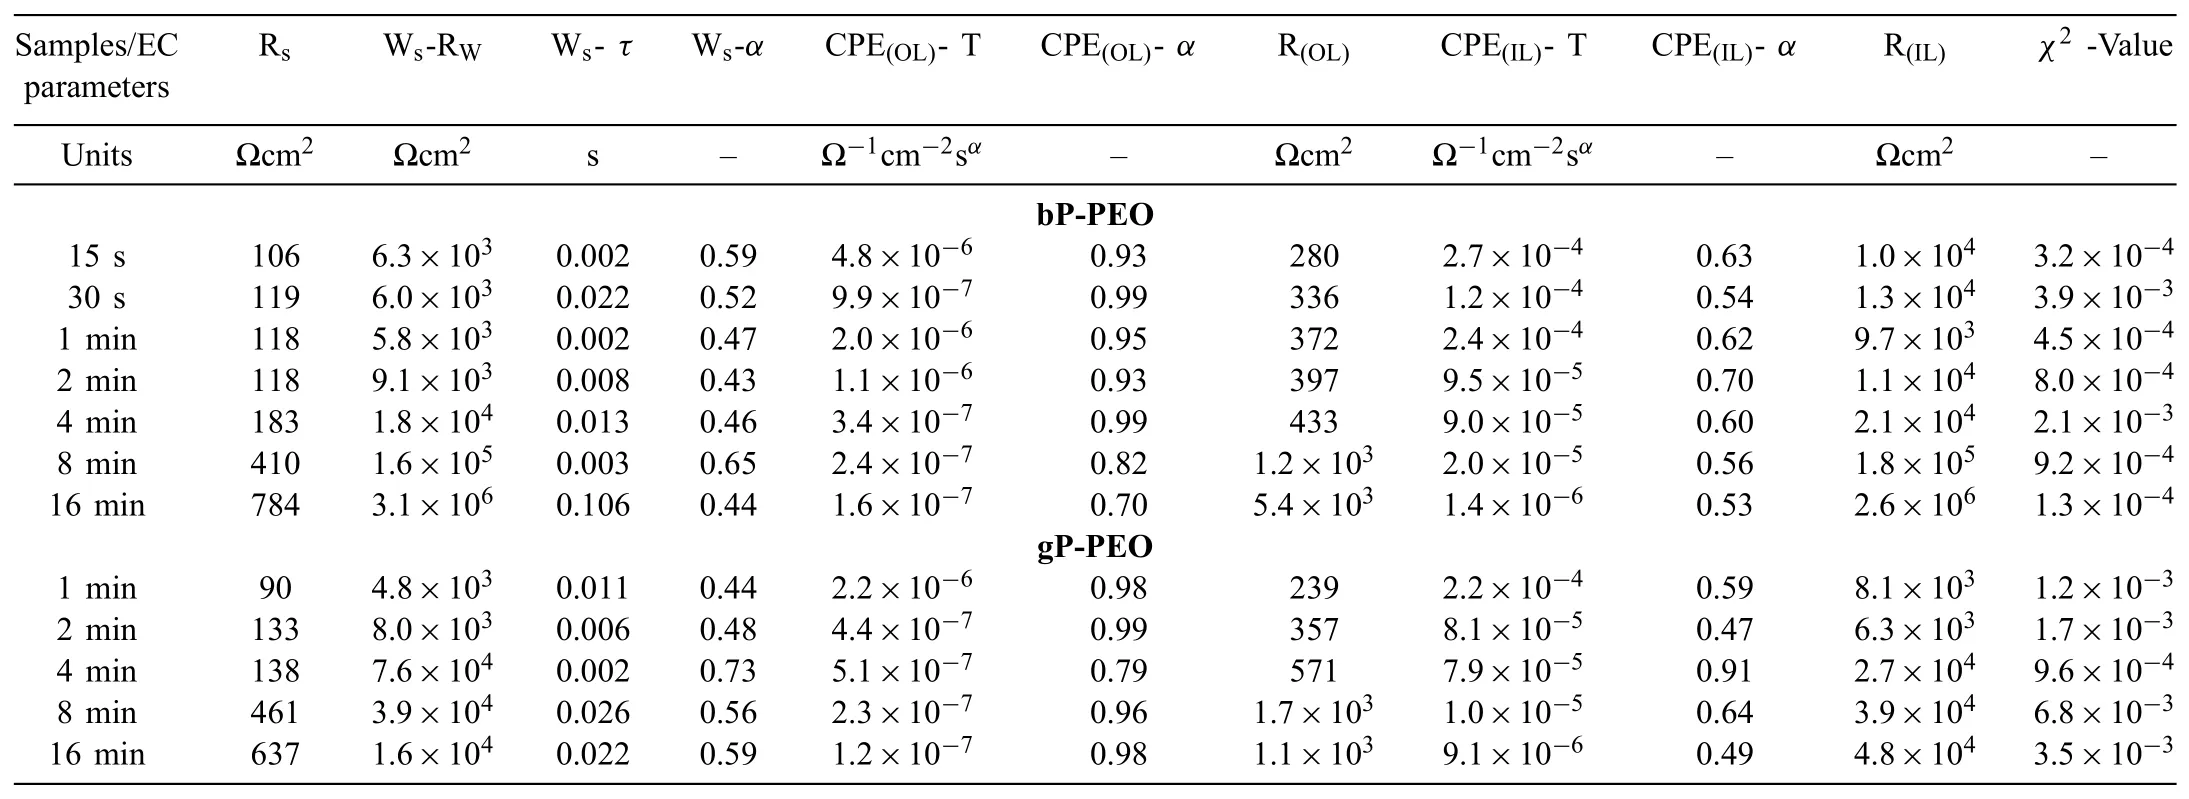
Table 3Parameters extracted from the electrochemical equivalent circuit fitting of the EIS spectra of both the bP-PEO and gP-PEO coatings for the initial immersion of 0.5h in 0.5wt.% NaCl solution.
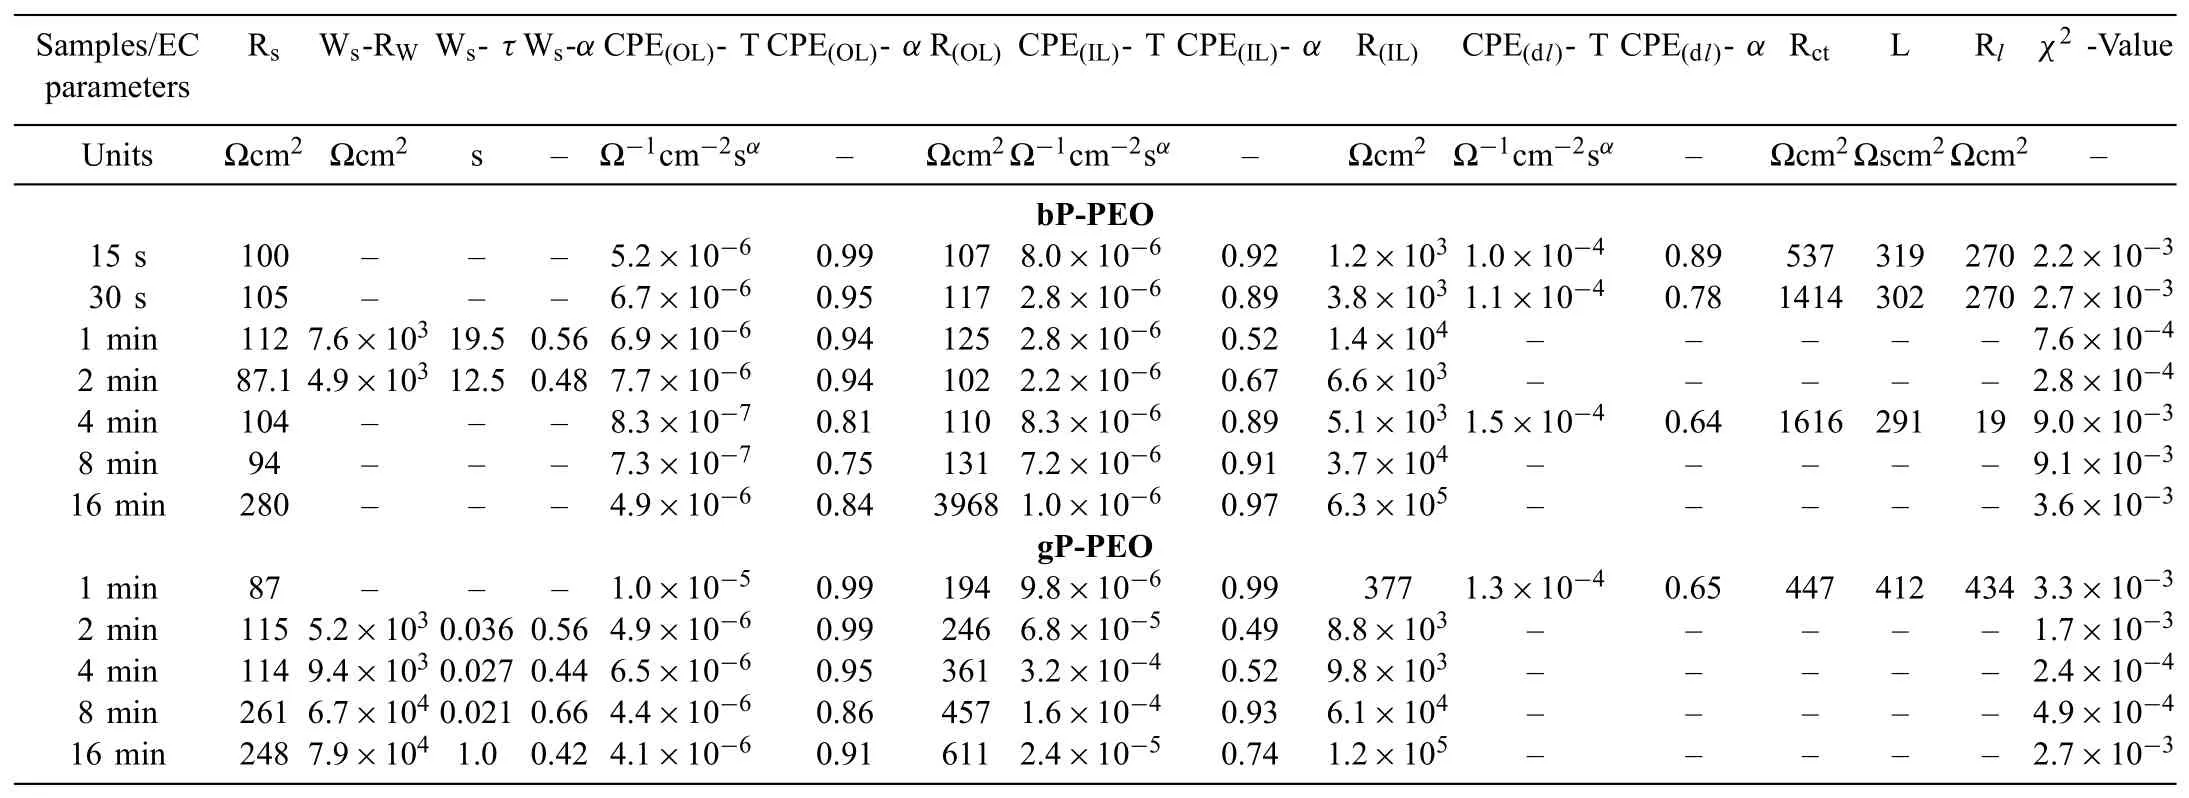
Table 4Parameters extracted from the electrochemical equivalent circuit fitting of the EIS spectra of both the bP-PEO and gP-PEO coatings for the fina immersion of 201h in 0.5wt.% NaCl solution.
It has been reported that the constant phase elementcoefficient CPE-T,is related to interfacial capacitance[45].Therefore,the CPE-T is directly proportional to the dielectric constant and surface area and inversely proportional to the thickness of medium as in the case of capacitance.Thus,the CPE-T values can be used to evaluate the conditions of PEO coatings during immersion in a corrosive electrolyte.The evolution of the outer porous layer CPE-T values for both bPPEO and gP-PEO were shown in Fig.19(a).The value of CPE(OL)-T for bP-PEO during initial immersion exhibited a decreasing trend with the PEO processing time except for 30s treated bP-PEO.Similarly,the CPE(OL)-T for gP-PEO exhibited a decreasing trend with the PEO processing time during initial immersion except for 2min treated gP-PEO.The evolution of CPE(OL)-T for both bP-PEO and gP-PEO as a function of PEO processing time during the initial immersion is in line with their coating thickness and surface pore area profil discussed earlier.However,the CPE(OL)-T values during the initial immersion for both bP-PEO and gP-PEO were almost similar except for 2min PEO treated sample for which the difference in their corresponding surface pore area was quite high.During the fina immersion,the CPE(OL)-T for both bP-PEO and gP-PEO were higher from their respective initial immersion values.This could be due to the increased electrolyte penetration in the direction lateral to coating thickness with the immersion time in the outer porous layer for both bP-PEO and gP-PEO.However,the CPE(OL)-T values for both bP-PEO and gP-PEO during fina immersion were almost similar except for both 4min and 8min treated which showed higher values and could be due to comparatively more lateral electrolyte penetration.
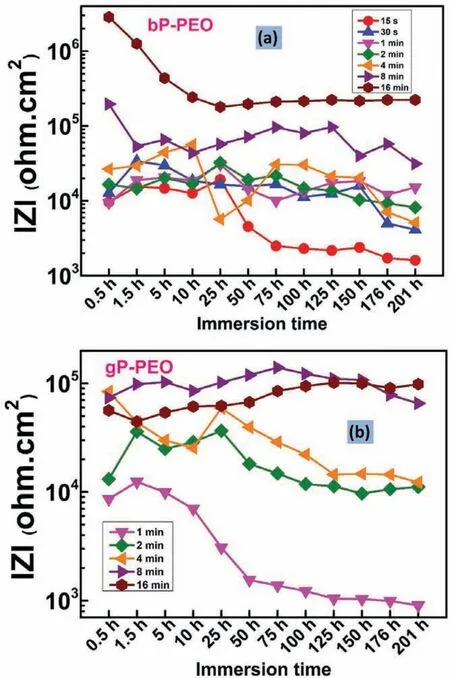
Fig.17.The variation of impedance modulus at the lowest frequency(100 mHz)for(a)bP-PEO and(b)gP-PEO as a function of immersion time.
Fig.19(b)shows the evolution of constant phase elementcoefficien for the inner barrier layer,CPE(IL)-T,for bP-PEO and gP-PEO.The values of CPE(IL)-T during initial immersion decreased with the PEO processing time plausibly due to the increase in the inner barrier layer thickness for both bP-PEO and gP-PEO.The values for CPE(IL)-T for gP-PEO were almost the same(for 1min to 8min)and slightly higher(for 16min)when compared to bP-PEO.This plausibly could be due to the relatively defective barrier layer for gP-PEO despite its thicker barrier layer when compared to bP-PEO.The relatively defective barrier layer for gP-PEO was also rationalized by the fact that gP-PEO exhibited lower impedance modulus during initial immersion compared to bP-PEO as shown in Fig.17(a).With the immersion time the following two processes come into the picture:(a)The inner barrier layer which mainly comprises of MgO gets dissolved by the hydration process in which MgO reacts with H2O and forms Mg(OH)2which subsequently dissolves in relatively low pH surrounding into their respective ions namely Mg2+and OH¯.(b)The Cl¯ingresses more and more into the barrier layer under the influenc of potential perturbation and thereby results in increasing its ionic conductivity and thus deteriorating its dielectric properties.During the fina immersion,the CPE(IL)-T for bP-PEO exhibited lower values compared to its initial immersion values.This indicates the decrease in dielectric property of the barrier layer eclipsed its thickness reduction.The MgO content in PEO coatings was relatively higher for gP-PEO compared to bP-PEO as discussed earlier and was evident from the XRD pattern shown in Figs.12(b)and 13(b).This higher MgO content in gP-PEO resulted in the limited dissolution of its barrier layer by hydration process as the higher MgO content helps in promoting higher pH surrounding(pH>11.46)formation quite easily and thus stabilizes the subsequent dissolution of Mg(OH)2which in turn limits the barrier layer thickness loss.The inherent thicker barrier layer and its limited thickness loss for gP-PEO resulted in its abated dielectric deterioration due to Cl¯ingress.Thus,the CPE(IL)-T for gP-PEO during fina immersion exhibited higher values compared to its initial immersion for later PEO processing time.
Tables 3 and 4 illustrated that the corrosion resistance offered by the outer porous layer,R(OL),was much less compared to that of the inner barrier layer,R(IL),during both the initial and fina immersion.The higher corrosion resistance offered by the inner barrier layer compared to the outer porous layer has been reported earlier[46-48].Fig.20 depicted the evolution of R(IL)as a function of PEO processing time for both bP-PEO and gP-PEO.The magnitude of R(IL)for bP-PEO remained to nearly a constant value in the order of 104ohm.cm2for up to 4min PEO treated sample and then continuously increased to 105and 106ohm.cm2for 8min and 16min PEO treated sample respectively.During the fina immersion,the R(IL)for bP-PEO exhibited lower resistance compared to its corresponding initial immersion values except for 1min PEO treated sample.This could be attributed to the deterioration of the inner barrier layer by both its dissolution due to hydration and Cl¯ingressed into it.The magnitude of R(IL)for gP-PEO during the initial immersion was in the order of 103ohm.cm2for up to 2min PEO treated sample and then increased to order of 104ohm.cm2for 4min PEO treated sample onwards.The R(IL)of values were almost similar during the earlier PEO processing time(up to 4min)and then lowered for later PEO processing time(8min and onwards)compared to its corresponding bP-PEO values during the initial immersion time.This could plausibly be due to the relatively more defective(with fin pores and cracks)inner barrier layer for gP-PEO compared to bP-PEO.During the fina immersion the R(IL)values for gP-PEO were lowered or similar for up to 4min PEO treated sample and interestingly higher for 8min and 16min PEO treated samples compared to its initial values.Noticeably,the R(IL)values for gP-PEO were slightly higher for 2min to 8min PEO treated samples compared to corresponding bP-PEO values during the fina immersion.The inner barrier layer of gP-PEO could plausibly get sealed by the MgO hydration with immersion time.This defect sealing was more prominent in gP-PEO when compared to bP-PEO and in later PEO treated gP-PEO samples when compared to earlier treated gP-PEO due to their high MgO content which helped in creating high pH surrounding and thereby stabilizing Mg(OH)2resulting by MgO hydration.
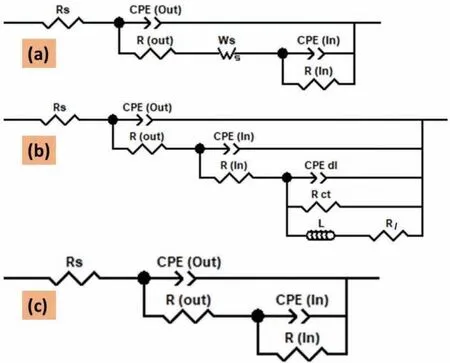
Fig.18.Electrochemical equivalent circuits employed for EIS spectra f tting for(a)all bP-PEO and gP-PEO during initial immersion time;both 1min and 2min treated bP-PEO,and all gP-PEO except 1min PEO treated samples during f nal immersion time,(b)15s,30s,and 4min treated bP-PEO and 1min treated gP-PEO during f nal immersion time,and(c)both 8min and 16min treated bP-PEO for f nal immersion time.
3.5.3.Potentiodynamic polarizations
Potentiodynamic polarization tests were carried out after two different immersion time namely 0.5h and 201h to understand corrosion thermodynamics and kinetics behaviour and how these behaviour changes with the conditioning time(long immersion in the electrolyte)for both bP-PEO and gP-PEO.The potentiodynamic polarization curves for both bP-PEO and gP-PEO after conditioning(in the corrosive electrolyte)of 0.5h and 201h are shown in Figs.21 and 22 respectively.The parameters such as equilibrium corrosion potential,Ecorr;equilibrium exchange current density(corrosion),icorr;and the passivation breakdown potential,Ebdextracted from the potentiodynamic polarization curves obtained after 0.5h and 201h of immersion time were summarized in Tables 5 and 6 respectively.
After 0.5h immersion time,the cathodic region of the polarization curves was shifted towards lower current density with an increase in PEO processing time for bP-PEO as depicted in Fig.21(a).Thus,suggesting the progressively reduced cathodic kinetics(hydrogen evolution)for bP-PEO with the PEO processing time.For gP-PEO too,as shown in Fig.21(b),the reduced cathodic kinetics were observed as a function of PEO processing time except for 8min treated gP-PEO.No trends were observed for both in the evoution of Ecorrand the anodic region of the polarization curves as a function of PEO processing time for both bP-PEO and gP-PEO.However,for both bP-PEO and gP-PEO,at some nobler potential than the Ecorr,the breakdown of the protective barrier layer was observed.In general,for both bP-PEO and gP-PEO the Ebdwere observed to shift towards the nobler values with an increase in PEO processing time.However,glycerol addition resulted in no significan change in Ebdvalues when compared to the without glycerol ones.The magnitude oficorrvalues was in the order of 10−3mA/cm2for 15s to 4min treated bP-PEO and then its magnitude decreased progressively to the order of 10−4and 10−5mA/cm2for 8min and 16min treated bP-PEO respectively.For gP-PEO,the magnitude oficorrwas of the order of 10−3mA/cm2for both 1min and 2min treated samples and then its magnitude decreased to 10−4mA/cm2for both 4min and 8min treated sample and then again decreased to the order of 10−5mA/cm2for 16min treated sample.Noticeably theicorrtransition from 10−3mA/cm2to 10−4mA/cm2occurred much earlier at 4min for gP-PEO compared to bPPEO where the same transition occurred at 8min treated samples.
Fig.22(a)and(b)illustrated that after 201h immersion time,the cathodic region of polarization curve,in general,shifted towards lower current density for both bP-PEO and gP-PEO respectively with the increase in PEO processing time.This indicated reduced cathodic kinetics(hydrogen evolution)with an increase in PEO process time for both bP-PEO and gP-PEO even after 201h of immersion time.With the PEO processing time,the Ecorrand anodic region of the polarization curves did not follow any trends which is in line with the observation for the polarization curves obtained after 0.5h immersion time.The anodic region of polarization curves showed passivity breakdown at potential slightly nobler than the corrosion potential,Ecorr,for both 15s treated bP-PEO and 1min treated gP-PEO.However,for the other samples,such passivity breakdown was observed at breakdown potentials(Ebd)much nobler than Ecorrsuggesting the presence of a protective layer even after 201hrs of immersion time.For both bP-PEO and gP-PEO,Ebddid not show any trend as a function of PEO processing time.However,interestingly both the Ecorrand Ebdvalues were significantl nobler for the polarization curves obtained after 201h immersion time than compared to the polarization curves obtained after 0.5h immersion time for both bP-PEO and gP-PEO.This suggested that both the corrosion process and a barrier layer(passivity)became more thermodynamically stable with the conditioning time for both bP-PEO and gP-PEO.This also corroborated well with the OCP stabilization(at more noble potential)with the immersion time for both bP-PEO and gP-PEO.For bP-PEO,theicorrshowed decreased in magnitude from 10−2mA/cm2for both 15s and 30s treated samples to 10−3mA/cm2for 1min to 4min treated samples and then again decreased to 10−4mA/cm2for 8min and 16min treated samples.While for the case of gP-PEO theicorrdecreased from the magnitude of 10−2mA/cm2for 1min treated sample to 10−3mA/cm2for both 2min and 4min treated samples and then decreased to 10−4mA/cm2for both 8min and 16min treated samples.Thus,both bP-PEO and gP-PEO showed almost similar polarization behaviour after 201h immersion time.
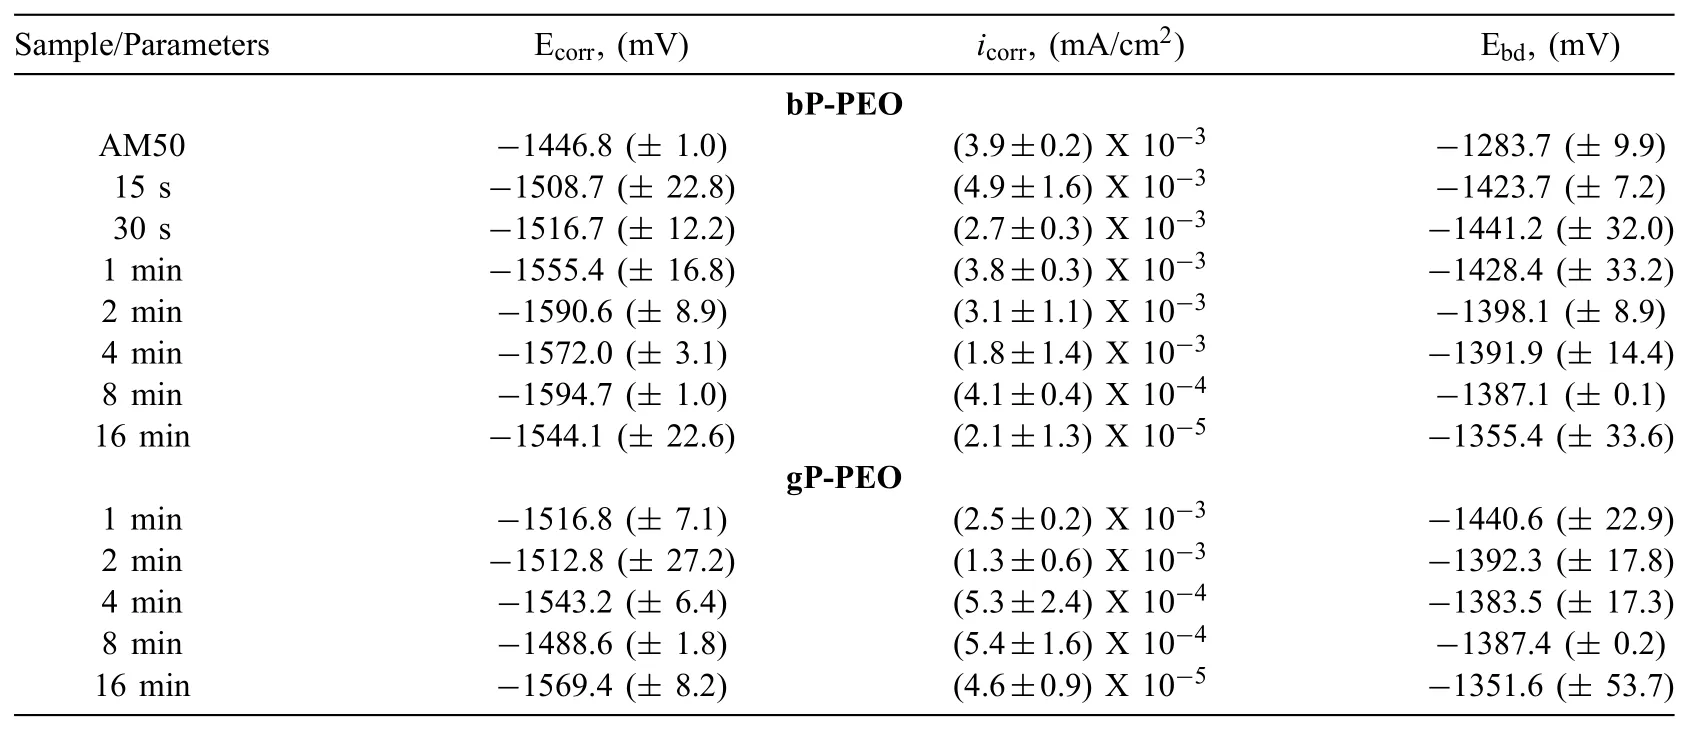
Table 5The parameters extracted from potentiodynamic polarization curves obtained after 0.5h immersion time for both bP-PEO and gP-PEO as a function of PEO processing time.
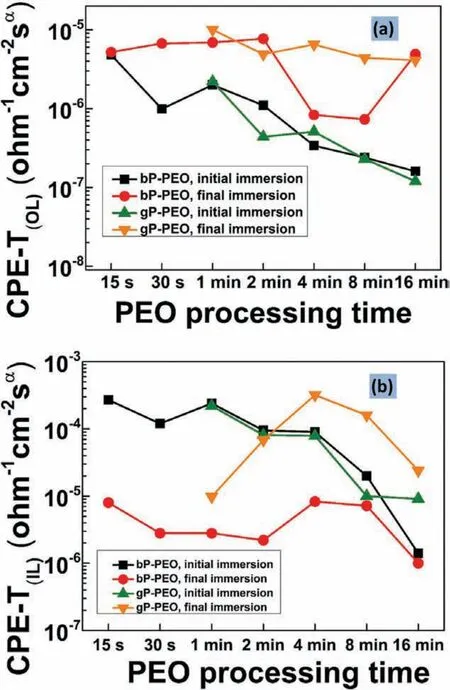
Fig.19.Evolution of constant phase element-coefficien for(a)outer porous layer and(b)inner barrier layer as a function of PEO processing time for both bP-PEO and gP-PEO.
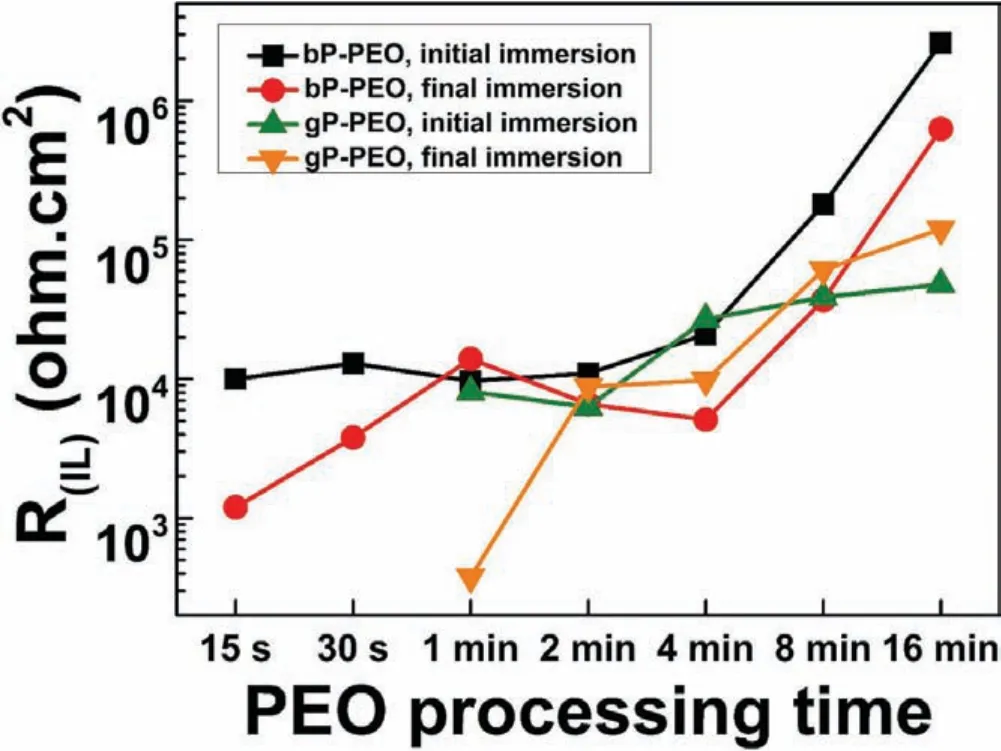
Fig.20.Evolution of inner barrier layer resistance as a function of PEO processing time for both bP-PEO and gP-PEO for initial and f nal immersion time.
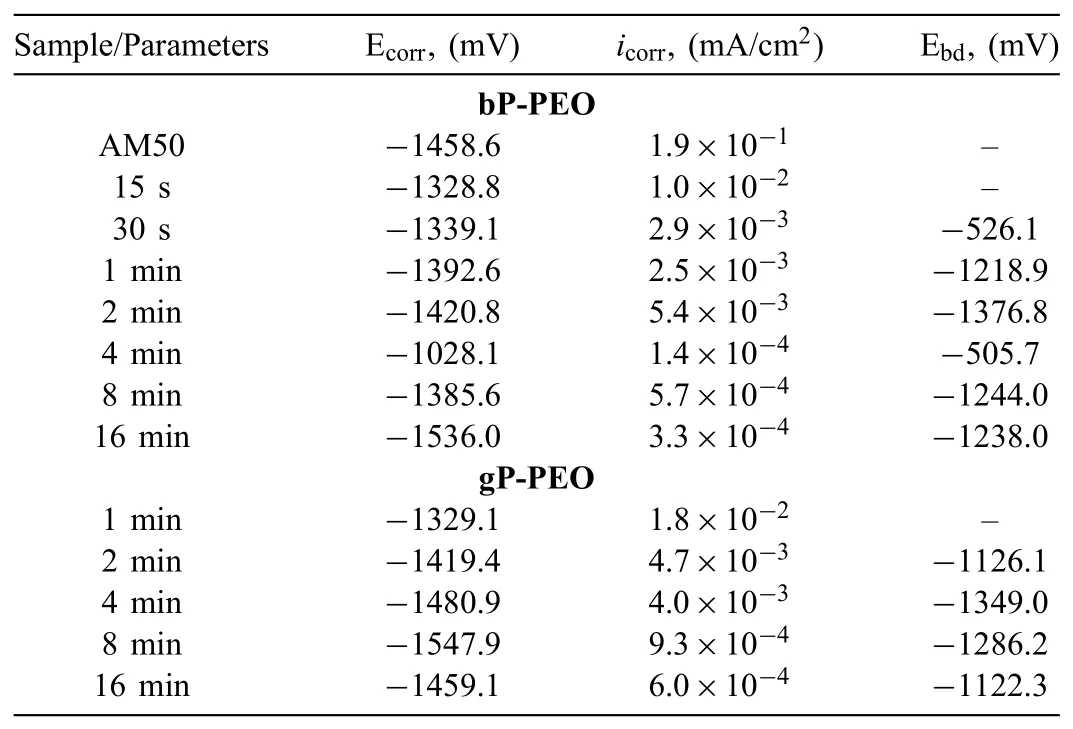
Table 6The parameters extracted from potentiodynamic polarization curves obtained after 201h immersion time for both bP-PEO and gP-PEO as a function of PEO processing time.
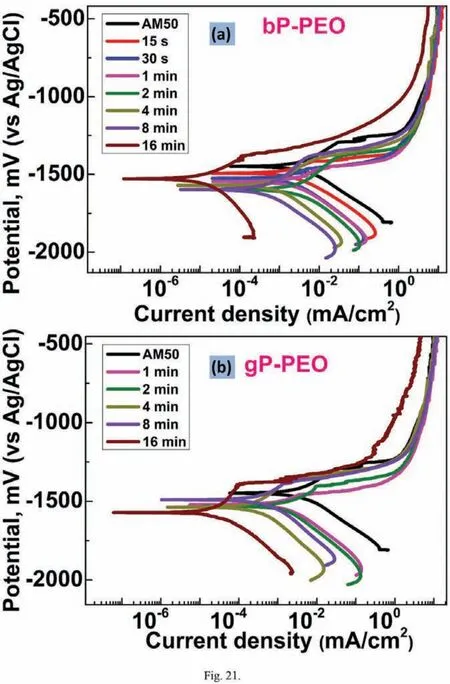
Fig.21.Potentiodynamic polarization curves obtained after 0.5h immersion time for(a)bP-PEO and(b)gP-PEO as a function of PEO processing time.
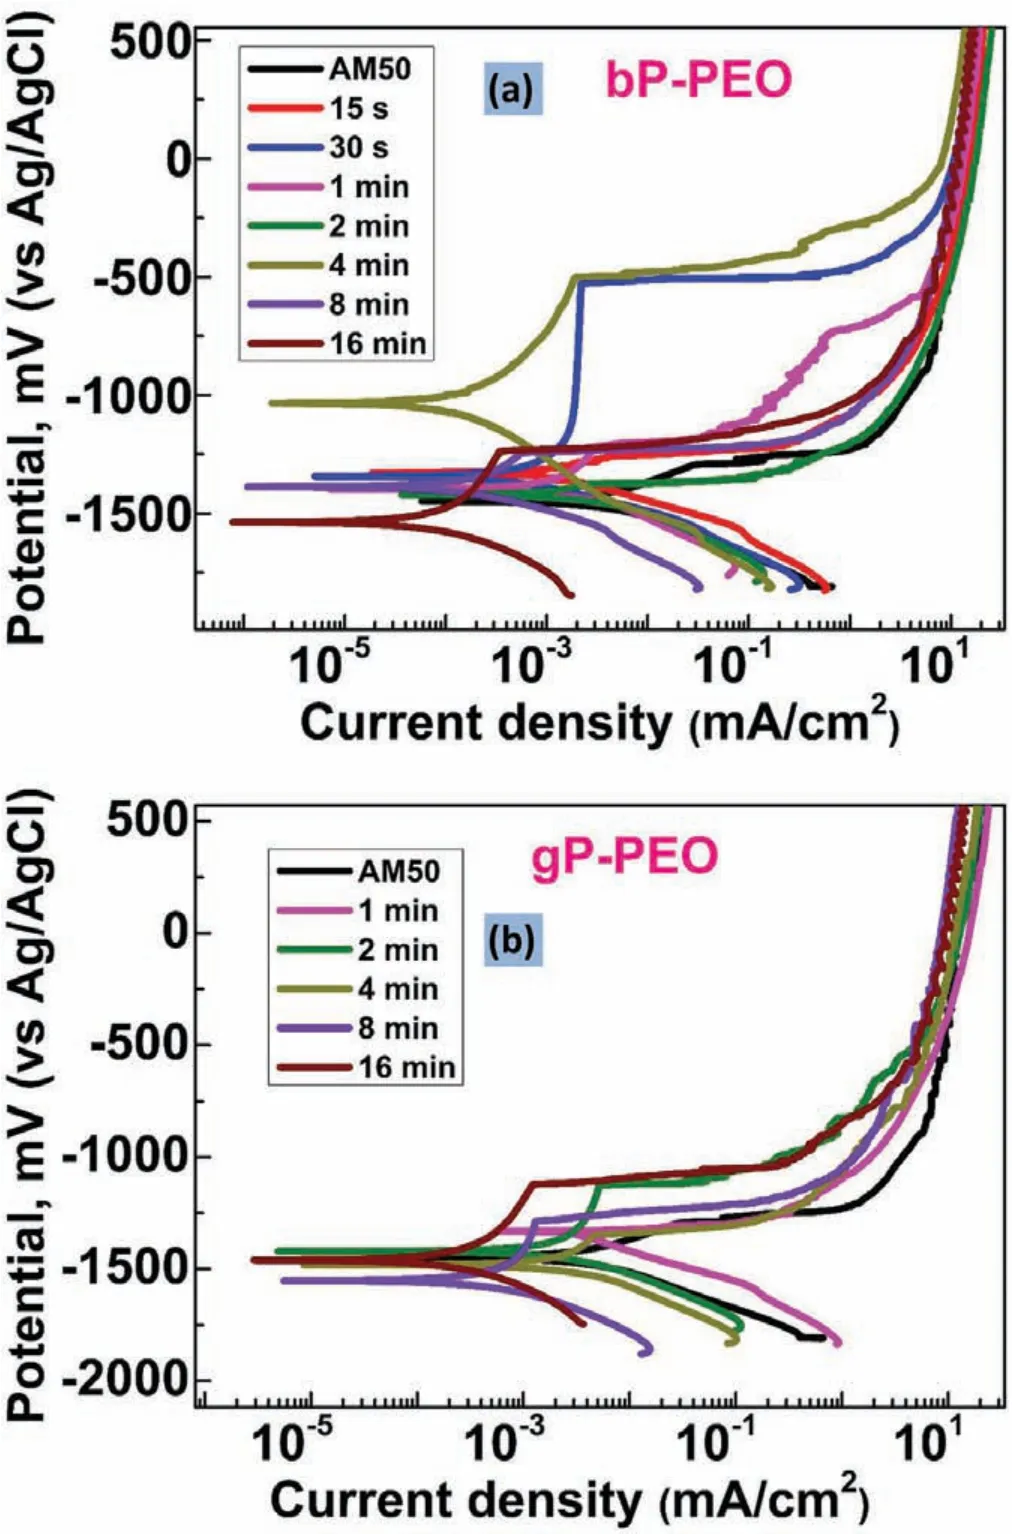
Fig.22.Potentiodynamic polarization curves obtained after 201h immersion time for(a)bP-PEO and(b)gP-PEO as a function of PEO processing time.
4.Conclusions
·Relatively smaller pore size,higher total pore density,lower surface pore area,and slightly reduced coating thickness were obtained for gP-PEO than that for bP-PEO.
·bP-PEO exhibited the coated layer at the shortest 15s processing time whereas for gP-PEO the coated layer was observed after 1min as glycerol addition to alkaline phosphate-based electrolytes retardedα-Mg phase dissolution during initial PEO processing and thus delayed the subsequent layer formation.
·Both MgO(periclase)formation and Mg3(PO4)2(farringtonite)amorphization were promoted by the glycerol addition in the alkaline phosphate-based electrolyte.
·Theicorr,in general,progressively shifted to lower-order magnitude for both bP-PEO and gP-PEO with the PEO processing time after an immersion time of both 0.5h and 201h.The magnitude oficorrafter 201h immersion time was higher than its values after 0.5h immersion time for both bP-PEO and gP-PEO.Thus,with the increase in the conditioning time(electrolyte immersion time),for both bP-PEO and gP-PEO,the corrosion process was more kinetically active.
·The Ecorrand Ebdfor both bP-PEO and gP-PEO,in general,exhibited more noble values for 201h immersion time than for 0.5h immersion time.Thus,with the increase in the conditioning time(electrolyte immersion time)the corrosion process and passivity due to barrier layer for both bP-PEO and gP-PEO were becoming more thermodynamically stable.
·In general,gP-PEO showed improved corrosion behaviour compared to bP-PEO up to 8min PEO processing time.The coatings were not even failed locally(evident from the absence of inductive loop in the Nyquist plot)up to the fina 201h immersion time for 2min PEO processing time and onwards for gP-PEO,whereas the absence of such inductive loop was exhibited for 8min processing time and onwards for bP-PEO.Additionally,gP-PEO registered higher fina immersion impedance for 2min to 8min PEO treated sample compared to the corresponding bPPEO.However,the bP-PEO exhibited better corrosion resistance than for gP-PEO for 16min PEO processing time.
·The better corrosion behaviour(except for 16min PEO processing time)of gP-PEO compared to bP-PEO is possibly due to a relatively thicker inner barrier layer along with higher MgO phase content in the coatings for gP-PEO than that for bP-PEO.
Declaration of Competing Interest
None.
Acknowledgement
AJ acknowledges the Department of Materials Engineering,Indian Institute of Science(IISc),AFMM-IISc,and CENSE-IISc for providing the characterizing facilities needed for this research work.Additionally,AJ also acknowledges Helmholtz-Zentrum Geesthacht(HZG),Germany for providing facilities to synthesize the PEO samples.All the authors acknowledge the DST-DAAD(Indo-German)Joint Research Collaboration project.
Supplementary materials
Supplementary material associated with this article can be found,in the online version,at doi:10.1016/j.jma.2020.05.002.
杂志排行
Journal of Magnesium and Alloys的其它文章
- Microstructural evolution of Mg-Al-Re alloy reinforced with alumina fiber
- Predicting and controlling interfacial microstructure of magnesium/aluminum bimetallic structures for improved interfacial bonding
- Plasma electrolytic oxidation of AZ31 and AZ91 magnesium alloys:Comparison of coatings formation mechanism
- Effects of annealing treatment on microstructure and tensile behavior of the Mg-Zn-Y-Nd alloy
- Microstructure and performance of biodegradable magnesium alloy tubes fabricated by local-heating-assisted dieless drawing
- Comparisons of microstructure homogeneity,texture and mechanical properties of AZ80 magnesium alloy fabricated by annular channel angular extrusion and backward extrusion
