Estimation of the turbulent viscous shear stress in a centrifugal rotary blood pump by the large eddy particle image velocimetry method *
2020-12-02JingjingJiHaoyuanLiQingyuWuYuZhangXianwuLuo
Jing-jing Ji , Hao-yuan Li , Qing-yu Wu Yu Zhang Xian-wu Luo
1. School of Clinical Medicine, Tsinghua University, Beijing 100084, China
2.State Key Laboratory of Hydroscience and Engineering, Department of Energy and Power Engineering,Tsinghua University, Beijing 100084, China
Abstract: The non-physiologic turbulent flows in centrifugal rotary blood pumps (RBPs) may result in complications such as the hemolysis and the platelet activation.Recent researches suggest that the turbulent viscous dissipation in the smallest eddies is the main factor of the blood trauma caused by the turbulent flow.The turbulent viscous shear stress (TVSS) was taken as the realistic physical force acting on the cells.However, limited by the temporal and spatial resolutions of the instrumentation currently available, very limited studies are available for the TVSS in the RBPs.In this paper, the large eddy particle image velocimetry (PIV) method is used to estimate the turbulent dissipation rate in the sub-grid scale, to investigate the effect of the TVSS on the blood trauma.Detailed flow characteristics, such as the relative velocity vectors, the estimated TVSS levels and the Kolmogorov length scales, are analyzed in three impeller phases at three constant flow rates (3 L/min, 5 L/min and 7 L/min).Over the measures range in this study, the maximum TVSS in the investigated RBP is lower than the reported critical value of stress.This study demonstrates that the large eddy PIV method is effective to evaluate the flow-dependent force on the cells.On the other hand, it is found that the TVSS is highly dependent on the flow behavior.Under severe off-design conditions, the complex flow characteristics, such as the flow separation and the vortical structures,will increase the TVSS.Thus, in order to reduce the hemolysis in the RBPs, the flow disturbance, induced by the departure of the incidence angle, should be avoided during the design of the RBPs.
Key words: Rotary blood pump, turbulent flow, turbulent viscous shear stress, large eddy particle image velocimetry, flow separation
Introduction
As a bridge to the transplantation or destination therapies, the continuous-flow left ventricular assist devices (LVADs) in the form of rotary blood pumps(RBPs) have been successfully used to provide the mechanical circulatory support for advanced heart failure patients[1-2].However, with the turbulent flows,such as the flow separation and the vortex shedding,the local high shear stress, the significant velocity and pressure fluctuations may occur around the blood cells.These non-physiological flow conditions may have adverse effects causing the hemolysis, the thrombosis,and the secondary shear effects of immune suppression[3].If these problems concerning the blood element damage, can be solved, the RBPs can help more patients.To do so, it is necessary to comprehensively understand the flow-dependent loading on the blood cells in the RBPs and to further reduce the mechanical damage.
Significant efforts were made in investigating the flow-dependent cell damage, (mainly the hemolysis as the break-down of the red blood cells (RBCs) and the release of free hemoglobin into the plasma).Earlier research mainly focused on thein-vitroblood testing in simple laminar shear flows generated by the rotational viscometers or the submerged jets[4-6].It was found that the degree of the RBC damage was a function of the shear stress and the exposure time.
Thus, in the development of blood-contacting devices, it is essential to investigate the shear stress profiles to evaluate the potential biocompatibility of the prototypes.The particle image velocimetry (PIV),an optical method of flow visualization, is often used to measure the velocities and to calculate the shear stresses.Ge et al.[7]analyzed the results of 2-D PIV measurements in a bi-leaflet prosthetic valve to investigate the mechanical environment of the blood elements, and it was shown that the maximum instantaneous viscous shear stress observed was less than 15 Pa.Yamane et al.[8]measured the levels of viscous and Reynolds shear stresses by the PIV under different flow conditions to verify the biocompatibility of the implantable ventricular assist device,EVAHEART®.
The main mechanical shear stresses used to quantify the hemolysis include the viscous shear stress and the Reynolds shear stress (RSS).The viscous shear stress represents the laminar viscous molecular force on the RBCs induced due to the viscosity of the blood plasma, the cell-to-cell interactions and the velocity gradient.However, the RSS is not a real physical force but just a term in the dimension of stress[9], a mathematical artifact to enclose the turbulent governing equations.This important point was first recognized by Jones[10]and discussed recently in Refs.[11-13]
Alternatively, the viscous dissipation around the cells is being gradually noticed in its role of inducing the hemolysis.Morshed et al.[12]theoretically built an energy equilibrium between the energy dissipation of the turbulent flows and the damage of the cells in cases of the physiological turbulent blood flow.Jones[10]introduced the turbulent viscous shear stress(TVSS) term, as the viscous stress exerted by the turbulent velocity fluctuations and the turbulent dissipation in small eddies around the RBCs.
According to Jones[10], the TVSS,τT=(1/2ρμε)1/2, is linked with the turbulent dissipation rate, whose estimation requires the high resolution turbulence fluctuating strain rate fields in the Kolmogorov length scale.This is only possible by the Direct Numerical Simulation or a very high resolution PIV with micrometer checking windows, which are both impractical.Sheng et al.[14]proposed a large eddy PIV method for the accurate estimation of the turbulence dissipation rate in a stirred vessel.Based on the dynamic-equilibrium assumption between the resolved and the sub-grid scales (SGSs), this method is used to measure the SGS energy flux, and thus to estimate the turbulence dissipation rate.The SGS flux is obtained from the strain-rate tensors, and from the measured velocity fields by the PIV and from the modeled SGS stress in the large eddy simulation(LES).
Li et al.[15]adopted this large eddy PIV method to estimate the turbulent viscous dissipative stress downstream a prosthetic valve.It was found that the TVSS has the same order of magnitude as the laminar viscous shear stress.Ha et al.[16]assessed the turbulent viscous shear stress using the flow magnetic resonance imaging (MRI) for the prediction of the hemodynamic blood damage in the turbulent blood flow through a stenosis.Yen et al.[17]employed the large eddy PIV to estimate the TVSS levels in the free-submerged axisymmetric jet turbulent flow.They also conducted hemolysis experiments and found that the hemolytic threshold of the TVSS took the value of 60 Pa.
Limited by temporal and spatial resolutions of the currently available instrumentation, the detailed study of the TVSS in the turbulent flows of the RBPs would be very difficult.In this study, in order to investigate the shear stress caused by the turbulent dissipation, the large eddy PIV method is adopted to estimate the TVSS profiles in our centrifugal blood pump prototype.That will help better reveal the dangerous regions in the pump passage and further guide the optimization of the prototypes.
1.Centrifugal rotary blood pump
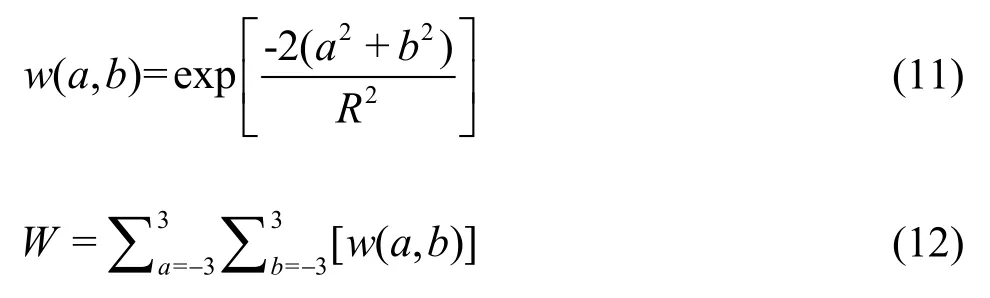
In this study, an in-house centrifugal RBP is investigated.It is being developed as a Left Ventricular Assist Device in our lab[18-19].Figure 1 shows the meridian configuration of the impeller and the geometry of the spiral volute.The dimensional parameters of the pump are listed in Table 1.
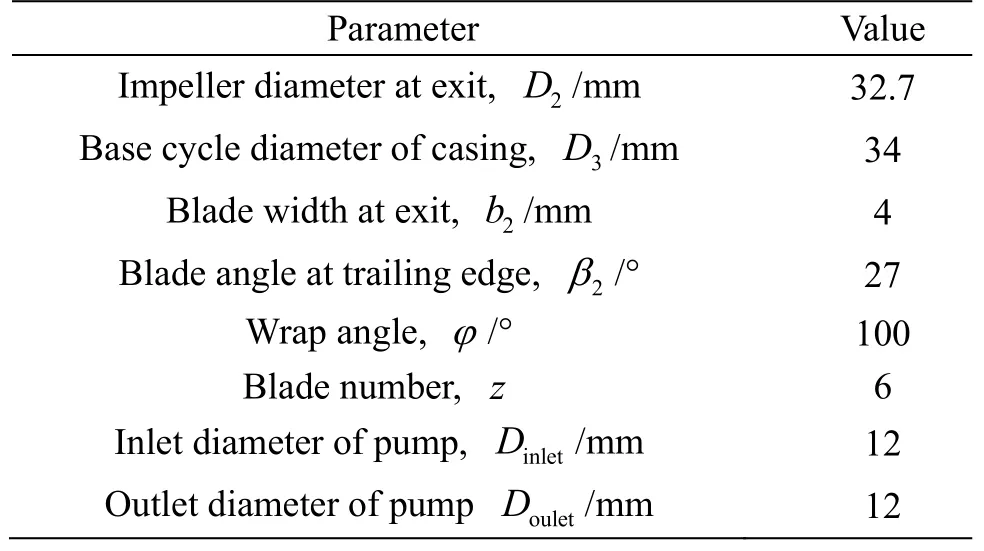
Table 1 Dimensional parameters of the investigated pump
2.Large eddy PIV method
2.1 Governing equations
According to Jones[10], the TVSS is theoretically defined as follows

whereμis the dynamic viscosity,Sijis the strain rate tensor of the velocity fluctuations, andεis the turbulent energy dissipative rate.The definition ofεis as follows
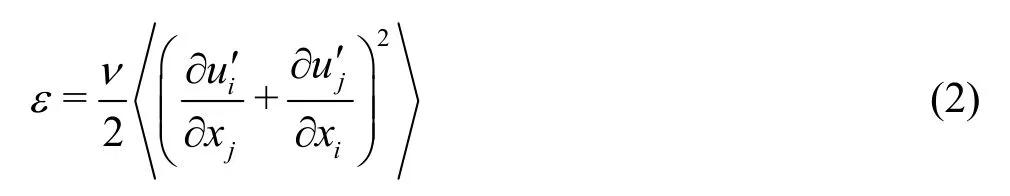
whereνis the kinematic viscosity and ∂ui′/∂xjis the spatial gradients of the velocity fluctuation components.For the direct measurement ofε, the 3-D PIV technique might be adopted with a spatial resolution similar to the scale of the diameter of the RBCs, which is impractical.Due to this limitation, in this study, we apply the SGS model used in the LES to overcome the insufficient spatial resolution of the 2-D PIV, and to estimate the turbulent dissipation rate.
Between the large eddies containing the kinetic energy and the small eddies dissipating the energy,there is a large region called the inertial sub-range region, where the turbulent kinetic energy is neither generated nor dissipated but only transferred[20].In the LES, a low pass filter (LPF) is applied to the Navier-Stokes (N-S) equations to separate the resolved scales from the sub-grid scales in the inertial sub-range.The LES directly solves the large eddies with the N-S equations and models the small eddies by SGS models.The prediction of the turbulent dissipation rate in the LES is based on the SGS model,which depends on the resolved velocity.
In the PIV, the spatial filtering property is similar to the LES.The acquired images are divided into many small interrogation windows.The velocity vectors of the flow field are analyzed through cross-correlation in every interrogation window.The obtained velocity is the ensemble average velocity in the interrogation window, which can be considered as the resolved velocity in the LES.Thus, applying the SGS model from the LES, we can use the ensemble average velocity measured in the PIV to estimate the turbulent dissipation rate.
The filtered continuity and N-S equations for incompressible flow of the large eddy PIV method could be expressed as
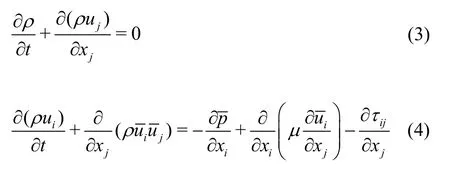
whereis the resolved velocity component,pis the pressure,ρis the density,μis the laminar viscosity andis the modeled sub-grid scale stress tensor.Multiply Eq.(4) byand arrange terms, then we can get the resolved turbulent kinetic transport equation as follows
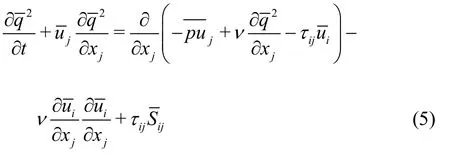

The last term in Eq.(5) is the sub-grid scale dissipation, representing the energy transfer between the resolved and SGSs in the inertial sub-range.Since the sub-integral scales are in a dynamic equilibrium, the flux of the turbulent kinetic energy through the inertial sub-range is equal to the turbulence dissipation rate.Thus we can estimate the turbulent dissipation rate by computing the ensemble phase averaged SGS dissipation rate
whereCS=0.17 is the Smogorinsky constant,Δ=0.59 mmis the spatial resolution of the PIV technique used in this study and.In addition, we have to obtain the resolved strain rate tensor, which involves nine velocity spatial gradient terms in Eq.(6).However, in the 2-D PIV,only four out of nine terms, i.e.,, can be measured.The additionaltermcan be derived from the continuity equation of Eq.(3).Sheng et al.[14]observed that the nine terms all have similar magnitudes when checking the five known terms of the dissipation rate tensor.Therefore, we assume that the dissipation rate could be estimated by multiplying the sum of the five obtained terms by a factor of 9/5.
Since it was reported that the eddies comparable in size with the RBCs are the most dangerous ones[22],KLS,η=(ν3/ε)1/4, the dissipative length scale or the smallest turbulent flow length scale, is also calculated from the estimated energy dissipative rate.
2.2 PIV apparatus
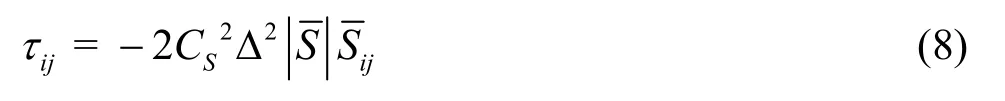
The RBP prototype is manufactured as a transparent acrylic prototype, which allows a suitable optical access for the 2-D PIV.The optical access is provided from the sides.The impeller of the tested prototype is fixed on a semi-transverse shaft and driven by magnet coupling.Figure 2 shows the structure diagram of the pump test rig.
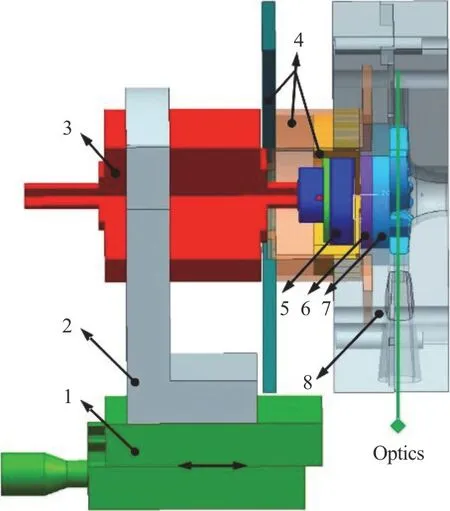
Fig.2 (Color online) The structure diagram of test rig consisting(1-A djustable micrometer, 2-Support, 3-Motor with hall sensors, 4-Supports, 5-Driving wheel, 6-Driven wheel embedded with one ball bearing, 7-Transparent impeller, 8-Transparent casing)
The schematic diagram of the PIV measurements is shown in Fig.3.The RBP inlet and outlet are connected via 9.525 mm Carmeda tubing (CB2994,Carmeda, Medtronic, Minneapolis, MN, USA) with a reservoir (R-38, Medtronic, Minneapolis, MN, USA)to allow for circuit volume changes, and a Hofmann clamp to adjust the circuit resistance.The working fluid is a mixture of the saturated sodium iodide solution, the glycerol and the purified water (volume percentage ratio: 79%, 20% and 1%), to match the refractive index of the acrylic used for the test rig(1.492) and the viscosity of the blood (3.8 mPa·s)[20].The fluid is seeded with 20 μm silver-coated hollow glass spherical particles.
Fig.3 The schematic diagram of the PIV measurements
The dual cavity pulsed 65 mJ lasers (DualPower 65-15, Dantec Dynamics, Skovlunde, Denmark) and a cylindrical lens are employed to generate a light sheet.A dual-frame camera (FlowSense 4M Mk2) with a video resolution of 2 048×2 048 pixels and a 76 mm×76 mm viewing window can capture 200 image pairs (with paired image interval of 100 μs) for each measured condition.
Hydraulic performance tests are conducted to select the experimental points before the PIV tests,by setting the pump speed and varying the circuit resistance (nearly fully open) while recording the flow rates (TS410-9PXL, Transonic Systems, Ithaca, NY,USA) and the pump head with pressure sensors(PX181B-015C5V, Omega Engineering, Stamford,CT, USA).At 2 900 rev/min with 5 L/min, this RBP can provide 100 mmHg head, a typical operating condition (TOC) for the RBPs.The flow fields at three flow rates are measured by the PIV, 3 L/min,5 L/min and 7 L/min at 2 900 rev/min.The measurements focus on the mean velocity profile in the plane across the middle of the impeller blade height to reduce the influence of the normal velocity components[21].In order to gate the image acquisition to a precise fixed position of the impeller, a specific microchip, is integrated into the pump controller to process the signals from one hall sensor of the pump motor (Maxon®, Switzerland).
To investigate the sequential development of the unsteady flow structures, the data of three impeller phases with a rotating interval of 20° in one blade-to-blade cycle (Fig.4) are all acquired through adding a delay to the trigger signal.In the figure,Tblademeans the time needed for a blade-to-blade rotation of 60°.
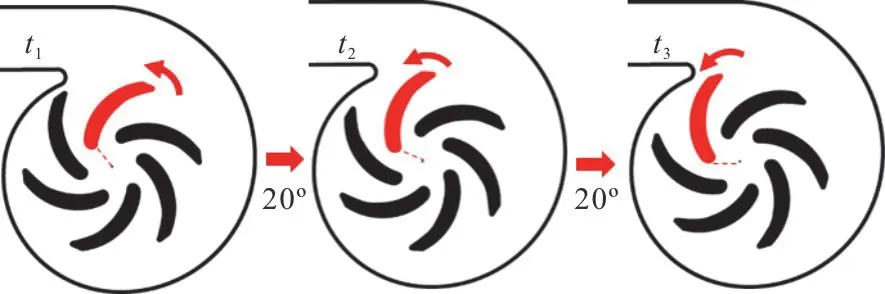
Fig.4 (Color online) Three measured impeller phases, where t2=t1 +1/3Tb lade , t3=t1 +2/3Tblade
All images are analyzed via the two-frame cross-correlation[22]with an initial interrogation window of 32×32 pixels and two refinement steps using the Dynamic Studio (Dantec Dynamics,Skovlunde, Denmark).The data post-processing is completed with the Tecplot 360 EX software(Bellevue, WA, USA).As suggested by Luff et al.[23]and Ge et al.[7], 3×3 Gaussian filter should be applied to the velocity field prior to the computation of the spatial velocity derivatives, to reduce the maximum error in the derivative.In this paper, we use the spatial filter as follows:
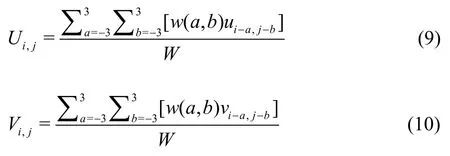
whereuandvdenote the raw experimental data,UandVare the filtered velocity components, and are adopted in the calculation of the vorticity.The filter kernel and the weight factor are defined as follows, where the constantRis set equal to 3 according to Luff et al.[23].
2.3 Numerical simulation
This study evaluates the TVSS by the large eddy PIV method, and a simulation with the filtered-based model (FBM, an improved hybrid LES-RANS turbulence model), is carried out to predict the TVSS under the design condition of 5 L/min at 2 900 rev/min.The adopted time step in the unsteady simulation is 5.74×10⁻⁵s, during which the impeller rotates by 1°.The blood is treated as a fluid with the viscosity of 3.8 mPa·s and the density of 1 758 kg/m3,the same as the physical properties of the refractive-ratio-match solution used in the PIV test.High quality anisotropic multi-block hexahedral grids,shown in Fig.5, are generated for the calculated RBP using the ANSYS ICEM 14.5.The refinement near the boundary layer is made by increasing the node density in the O-grids surrounding the blades.The results of the mesh independence analysis are shown in Table 2.The finally employed mesh has 2.7×10⁶grids.
Fig.5 (Color online) Computation domain and mesh of each flow component
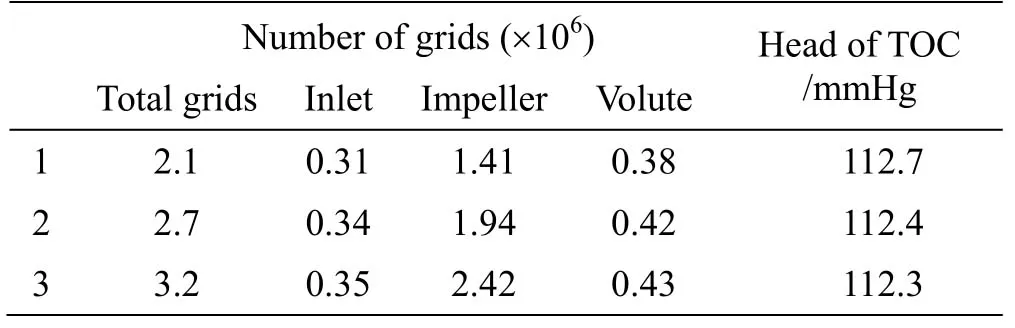
Table 2 Mesh independence analysis
The boundary conditions are set as follows: the total pressure at the domain inlet, the flow rate at the domain outlet, and the non-slip wall at the surfaces of the flow components.Governing equations of the FBM[24]are solved in the ANSYS CFX 14.5.The solvedy+distribution on the wall surfaces of the impeller is shown in Fig.6.
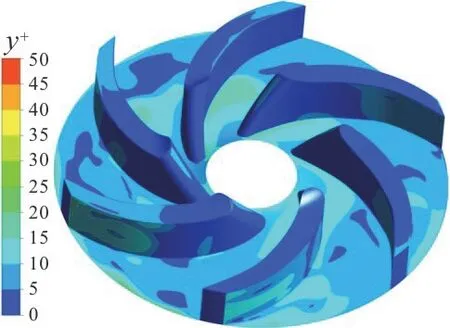
Fig.6 (Color online) y+ distribution of the impeller
3.Results
3.1 Hydraulic characteristics
The measured and predicted pump characteristic curves at 2 900 rev/min are shown in Fig.7, whereHis the pump head,Qis the flow rate.In the figure, exp.means the experimental results and FBM means the numerical data obtained with the filtered-based model.The design load condition,Qd=8L/min , is marked by a red square and three off-design conditions measured in the PIV are marked by blue squares, which are 3 L/min (37.5%Qd),5 L/min (62.5%Qd) and 7 L/min (87.5%Qd).Under the typical operating condition, 5 L/min at 2 900 rev/min, the error of the numerically predicted head obtained by the FBM is 3.14%, which indicates a good agreement between the numerical and experimental data.
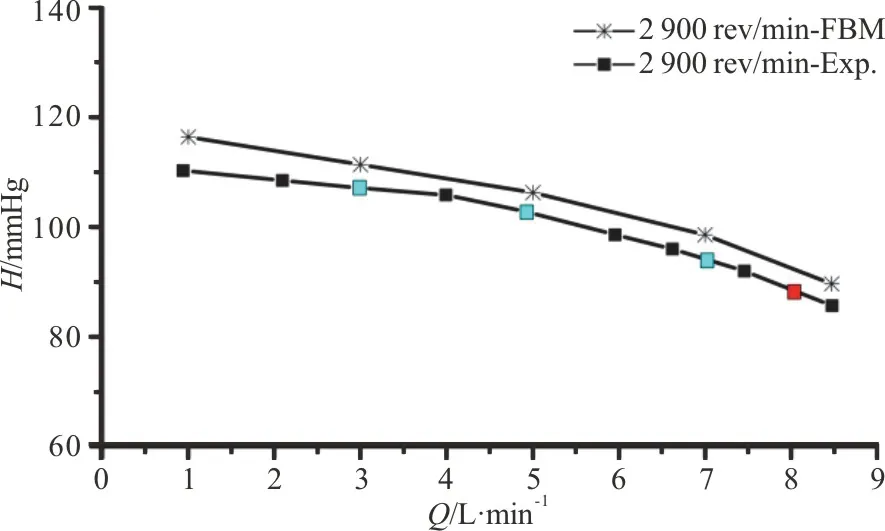
Fig.7 (Color online) Measured and predicted hydraulic performance (H-Q) curves at 2 900 rev/min
3.2 Acquired images and measured absolute velocity
Figure 8(a) shows an exemplary original image of particles acquired under the typical operating condition, 5 L/min.Through a two-frame crosscorrelation, the ensemble averaged velocity profile is obtained, as shown in Fig.8(b).The camera takes pictures with a video resolution of 2 048×2 048 pixels in a 76 mm×76 mm viewing window, so that the spatial resolution of this PIV measurements is 76×(32/2048)/2=0.59 mm.
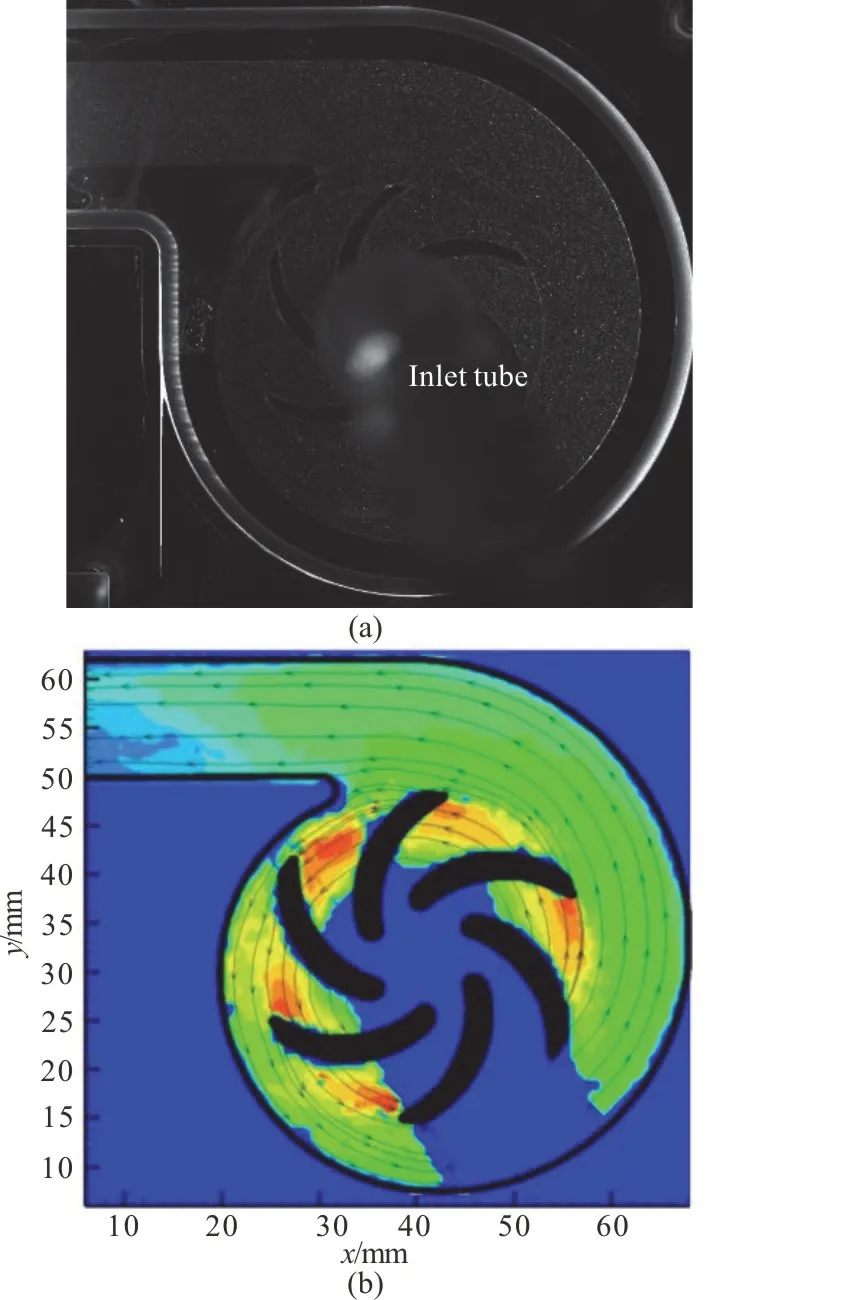
Fig.8 (Color online) PIV results at 5 L/min, an exemplary original image of particles (a) and averaged velocity profile (b)
Since the camera is fixed in space, this readily obtained velocity field is that of the absolute velocity.It clearly shows the acceleration of the blood flow from the blade leading edge to the trailing edge and the velocity decay from the impeller exit to the pump outlet.
With the large eddy PIV method, the TVSS and the Kolmogorov length scale (KLS) are further estimated based on the velocity data.Due to the presence of the inlet tube between the pump casing and the camera, the view of the camera is partly blocked.The data of this area are missing.Thus in the following estimation of the TVSS and the KLS, the data of this area are also not available, and are not taken into account and are covered by a zero-value contour.
3.3 Measured flow characteristics in different impeller phases
Since 5 L/min with 100 mmHg is usually considered as the typical operating condition for the RBPs, the flow details at three measured phases at 5 L/min are analyzed in detail.To allow a better demonstration of the flow structures, the relative velocityWis calculated by the analysis of the velocity triangle.
Figure 9 shows the internal flow inside the RBP atn=2900 rev/min andQ=5 L/min.One red blade and two channels (A, B) are highlighted to present the development of the flow structures when the marked blade is passed by the cut-water.Figure 9(a) shows the relative velocity vector maps in three impeller phases,t1-t3.The impeller rotation is in the counterclockwise direction.Att1, there is one blade aligned with the cut-water of the spiral volute.Under a part-load condition, it is observed that the flow separations occur around the upper suction and the center pressure surface in certain channels.Meanwhile,due to the asymmetry of the spiral volute, unsteady flows with uneven velocity are distributed in different channels of the impeller.Two adjacent passages, A and B, on each side of one highlight blade, are used to show the complete flow evolution process.In the region A ①, no significant separation occurs and the relative velocity follows well with the curvature of the blades.With the impeller rotating, in A ② and A ③,the low-velocity zone starts to appear and to grow,and the velocity vectors at the impeller exit slightly turns into a rotating direction opposite to that of the impeller.In B ④, when one blade is aligned with the cut-water, a large area with low-velocity is extended on the pressure side and hence reduces the through-flow in this passage.With the departure of the blade, in B⑤ and B⑥ , the low-velocity zone shrinks but leaves a “ridge” turning on the pressure surface.Another flow evolution process is also observed around the upper suction surface.
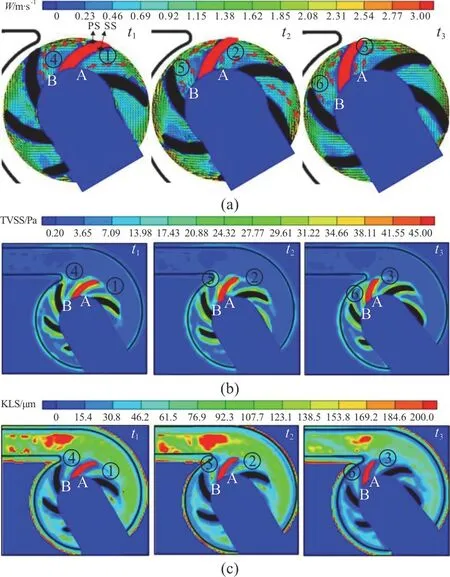
Fig.9 (Color online) Measured relative velocity vectors(a),estimated turbulent viscous shear stress (b) and KLS (c)by PIV for different impeller phases at n=2900 rev/min and Q=5 L/min.PS is the abbreviation of the pressure surface.SS stands for the suction surface
On the basis of the velocity data obtained in the PIV, the energy dissipation is estimated using the large eddy PIV method.Hence the TVSS (Fig.9(b))and the KLSs (Fig.9(c)) are calculated, to see more details of the hemolysis evaluation of the investigated RBP.At three impeller positions in one blade-to-blade cycle at 5 L/min, the maximum TVSS ranges from 47.78 Pa to 50.26 Pa in the mid-plane, lower than the critical value reported by Yen et al.[17].
Also as observed in the order from channel A①to channel B⑥, the TVSS and KLSs are found highly associated with the evolution of the flow structures.For an example, in B ④, as shown in Fig.9(a), with a large low-velocity zone around the center pressure surface, the high-momentum fluid moves towards the suction side and the outlet velocity is affected.Furthermore, this high momentum exchange and the velocity fluctuations increase the TVSS (B ④ in Fig.9(b)) and reduce the KLS (B ④ in Fig.9(c)) around the suction surface and the exit.
3.4 Measured flow characteristics at different flow rates
Dependent on the needs of the patients, the RBPs work with varied flow rates in some cases.Therefore,the PIV measurements are also conducted at lower(3 L/min) and higher (7 L/min) flow rates.
Figure 10 presents the flow characteristics for various flow rates.Figure 10(a) reveals that, under the operation condition of 7 L/min (87.5%Qd), the relative velocity follows well the curvature of the blades in the impeller passages, and no significant separation and distortions of the outlet velocity profile occur.With more loading off the design point, the flows show a clear departure from the well-behaved non-separated flow field.Under the operation condition of 5 L/min (62.5%Qd), a low-velocity zone appears in channel C.
But under the operation condition of 3 L/min(37.5%Qd), the obvious vortexes occur in the channels C, D, and dominate the blade-to-blade passages, due to the change of the attack angle around the leading edge at the low flow rate but with a maintained circumferential velocity.With the complex flow patterns developed under severe off-design conditions, the TVSS is found to become more intense,such as in the channels C, D, and the flow inside the impeller region has smaller KLSs correspondingly.

Fig.10 (Color online) Measured relative velocity vectors (a),estimated TVSS (b) and Kolmogorov length scales(KLS) (c) by PIV at three flow rates with n=2 900 rev/min
In addition, for all measured phases at each flow rate, the maximum TVSS and the minimum KLS obtained by the PIV are summarized in Table 3.It is noted that the maximum TVSS increases under the operating condition at a lower flow rate, as is consistent with the contour plots of the ensemble averaged relative speed and TVSS.Among all measured phases, the most dangerous TVSS value,54.91 Pa, happens att1with 3 L/min, when one blade is aligned with the cut-water.According to the report by Yen et al.[17], the critical TVSS value is 60 Pa,larger than the maximum value measured in our RBP prototype.
3.5 Simulated TVSS and KLSs
In this study, the simulations with the FBM, an improved hybrid LES-RANS turbulence model shown to be able to accurately predict unsteady flow structures in our previous study[25], are carried out to evaluate the PIV measurements.
The turbulent viscous shear stress and the Kolmogorov length scale predicted by the FBM are compared with the results estimated by the PIV, as shown in Fig.11.The present phase ist1atn=2900 rev/min andQ=5 L/min.For the TVSS profiles (a), the rising tendency, in the low-velocity zone around the pressure surfaces and with the velocity distortions around the impeller discharge, is captured by the PIV measurement.The difference between the channels close to and far away from the cut-water is more evident in the numerical results.That may be due to the measurement errors near the wall.In Fig.11(b), the flows with large KLSs at the outlet of the volute and the flows with small KLS,obtained by the PIV measurement and the simulation,are both properly shown.It could be said that the PIV technique adopted in this study is effective in providing detailed velocity and velocity gradient data for obtaining the characteristics of the complex flow pattern.The large eddy PIV method can give an appropriate estimation of the TVSS and the KLS.
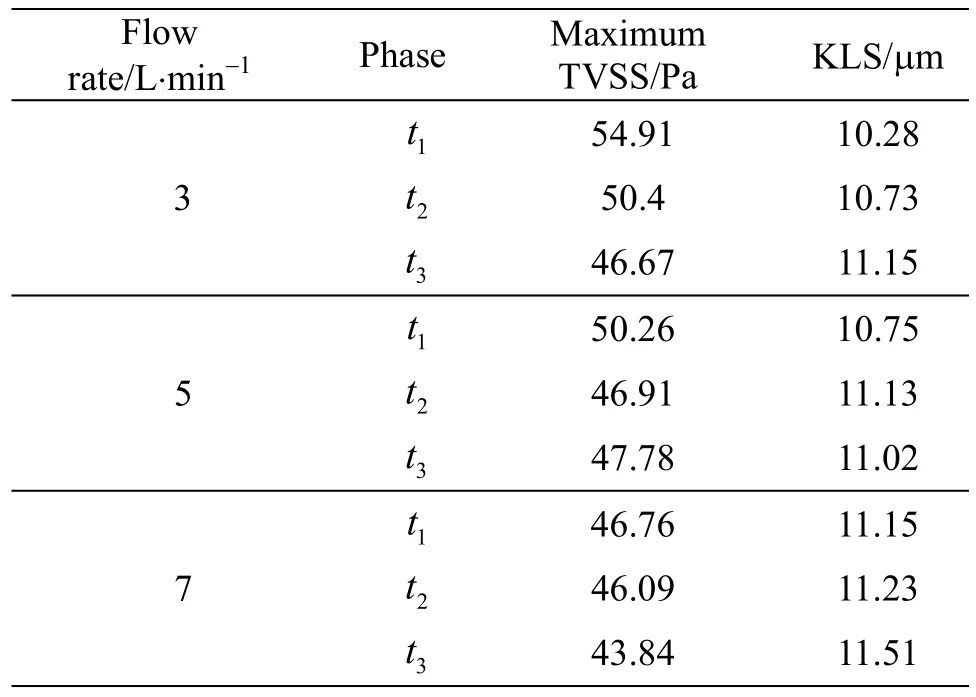
Table 3 The maximum TVSS and the minimum KLS (n=2900 rev/min)
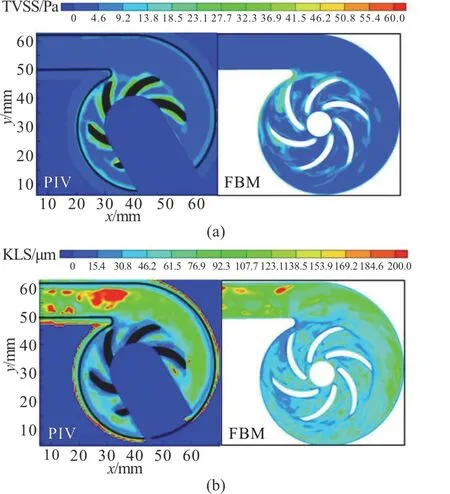
Fig.11 (Color online) TVSS (a) and KLSs (b) in the midplane
4.Discussions
Some recent researches suggest that the turbulent viscous dissipation and velocity fluctuation in the smallest eddies are the real reason for the cell damage induced by the turbulent flow[10,15], and hence the TVSS is taken as the physical force on the cells.In this study, in order to investigate the flow characteristics of an in-housing centrifugal RBP prototype, we apply the PIV technique to measure the velocity profiles.In particular, it is important to estimate the TVSS as the mechanical force acting on the cells, but very few studies did that.In this study,the large eddy PIV method is used to do that, based on the assumption that the dynamic equilibrium is held in the sub-integral scale, or within the spatial resolution of the PIV.That means that the flux of the turbulent kinetic energy through the inertial sub-range will be equal to the turbulence dissipation rate in the KLSs.
In other word, the large eddy PIV method makes the following assumptions: (1) The turbulent energy spectrum is completely separated from the energy dissipative spectrum as the function of the wave number, which is the case only if the flow is highly turbulent when the Reynolds number (Re) is large enough.In the flow investigated in this paper, because the Reynolds numbers in the impeller range from 18 158 to 18 332, it can be said that the flow in this RBP is highly turbulent.(2) The spatial resolution of the PIV must fall within the inertial sub-range, in other words, it has to be between the integral length scalesLand the KLSη.Landηare typically used to characterize the size of the largest and the smallest turbulent structures, respectively.The size of the integral length scalesLis on the order of the geometry of the pump[26], 1.8-12 mm, as estimated from Figs.7, 10.Since its direct measurement is very difficult, it is not adequate to calculate the true KLSs asη=(ν3/ε)1/4.In the isotropic homogeneous turbulence theory of Tennekes and Lumley[27], a simpler approach for estimating it is provided as
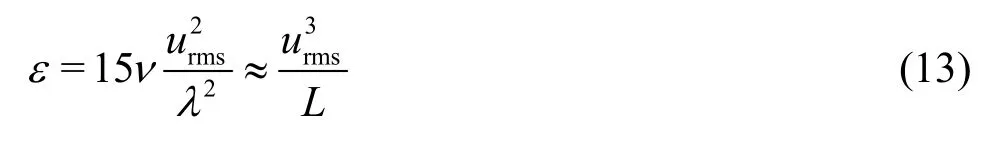
whereurmsis the root mean square of the turbulence velocity fluctuations,λis the Taylor micro-scale.By extracting the maximumurms(0.83 m/s) from the experimental data at the phaset1of 3 L/min and selecting the height of the blade as the characteristic lengthL(4 mm), we can estimate142.95 m2/s3and get an estimate of the KLS size as 16.3 μm.As mentioned before, the spatial resolution of the PIV in this study Δ is 0.59 mm, which is shown to be between the integral length scalesLand the KLSη, i.e.,L>Δ>η.Thus, in this study, the conditions for assuming the dynamic equilibrium are fulfilled and so it is reasonable to estimate the dissipation rate based on the large eddy PIV method.
In view of the limitation of the 2-D PIV, we could only obtain five out of the nine components of the strain rate tensor.Another four are assumed to be almost the same as the obtained ones, which simplifies the 3-D estimation into a 2-D one.As mentioned in the Ref.[15], it is very difficult to evaluate the precision of the approximation.In fact, to directly calculate the turbulent dissipation rate in Eq.(2)precisely, we have to measure the flow fields by the 3-D PIV technique with a spatial resolution similar to the scale of the diameter of the RBCs or even higher,which is impractical.Due to this limitation, we compare the results of this study with those of other estimation methods reported by previous researchers.In this study, using the large eddy PIV method, the TVSS and the KLS are estimated in our RBPs prototype.The maximum TVSS ranges from 43.84 Pa to 54.91 Pa and the KLS is around 11 μm, which is similar to the estimated KLS size 16.3 μm by Eq.(13).It is reported that, through the St.Jude Medical 27 mm valve, the turbulent viscous dissipative stresses were below 12 Pa and the minimum value of the Kolmogorov length scale was 27 μm.However, there is no reported TVSS vale in the RBPs.Day and Mcdaniel[26]conducted PIV measurements in a shaft-driven prototype of a magnetically suspended centrifugal blood pump at several constant flow rates 3 L/min-9 L/min and estimated that the KLS in the RBP is 25 μm, according to the above Eq.(13).Thus we can say that the large eddy PIV applied in this study is reliable in providing the estimation of the TVSS and the KLS in the RBPs.
In this study, the comprehensive flow details inside a centrifugal RBP are obtained using the PIV.At 5 L/min, as the typical working condition for the RBPs, a clear flow evolution, with the low-velocity zones initiating, growing and shrinking, due to the rotor-stator interaction, is observed.More complex flow pattern (flow separations, low-velocity circulation and vortical structures) is developed under severe off-design conditions, 3 L/min (37.5%Qd),caused by the change of the incidence angle.Similar to what is seen in our study, large recirculation regions around the upper suction surface and downstream the pressure surface were also observed from Pedersen et al.[28]through the PIV measurements in a centrifugal industrial pump operating at 0.25Qd.Also it was revealed that these complex flow characteristics would intensify the momentum exchange and the velocity fluctuation, and hence increase the TVSS.In particular, the maximum TVSS is increased under the operating condition of lower flow rate.A very similar feature was observed by Day et al.[26]in the measurement of a magnetic levitated centrifugal RBP at three flow rates.They reported that the increased root mean square (rms) of velocity fluctuations occurred at lower than design capacities,leading to a high RSS at the blade exit.
5.Conclusions
Recently, the TVSS is introduced as the real physical force acting on the cells in turbulent flows.However, limited by the temporal and spatial resolutions of measurements, there has been no detailed study of the TVSS in the turbulent flow of the RBPs.In this study, we apply the large eddy PIV method to quantify the TVSS as an evaluation of the mechanical force environment in an in-housing centrifugal RBP.The order of magnitudes of the Kolmogorov length scale estimated by the large eddy PIV matches the results of previous researchers.It could be said that the large eddy PIV method can provide a reliable estimation of the TVSS in the evaluation of the RBPs prototype.For the investigated RBP, over the entire range of the flow rates measured,the maximum TVSS is lower than the reported critical value in the case of the RBCs damage.
Through analyzing the detailed relative velocity vectors, the TVSS levels and the KLSs at three flow rates, it is found that the TVSS is highly dependent on the flow behavior.Complex flow characteristics would increase the TVSS.Consequently, in view of protecting the blood elements from damage by the elevated turbulent shear stress, the flow disturbance,such as induced by the departure of the incidence angle and the suddenly changed geometry, should be avoided during the design and the application of the RBPs.The results shed some insight into the relationship between the turbulence and the red blood cell damage, which can guide the design and the optimization of the RBPs.
Acknowledgements
This work was supported by the Prince Charles Hospital Foundation (Grant No.PRO2014-08), the National Health and Medical Research Council Centre for Research Excellence (Grant No.APP1079421), the Tsinghua National Laboratory for Information Science and Technology and the independent research fund of Tsinghua University (Grant No.20141081265).
杂志排行
水动力学研究与进展 B辑的其它文章
- Prediction of the precessing vortex core in the Francis-99 draft tube under off-design conditions by using Liutex/Rortex method *
- Experimental study of an ellipsoidal particle in tube Poiseuille flow *
- The hydraulic performance of twin-screw pump *
- Numerical investigation of frictional drag reduction with an air layer concept on the hull of a ship *
- Effects of finite water depth and lateral confinement on ships wakes and resistance *
- Large eddy simulation of turbulent channel flows over rough walls with stochastic roughness height distributions *