Large eddy simulation of turbulent channel flows over rough walls with stochastic roughness height distributions *
2020-12-02HaoLu
Hao Lu
China Key Laboratory of Enhanced Heat Transfer and Energy Conservation of Education Ministry, School of Chemistry and Chemical Engineering, South China University of Technology, Guangzhou 510640, China
Abstract: This paper studies the 3-D turbulent channel flows over rough walls with stochastic roughness height distributions by using the large eddy simulation and the immersed boundary method.The obtained mean and fluctuating velocity profiles for the smooth and rough channel flows agree well with the available numerical and experimental results.The stochastic surface roughness is found to have a more significant influence than the uniform surface roughness on the turbulent velocity statistics and the coherent structures, with the same average roughness height.With a greater variation in the roughness height, the mean velocity and the streamwise fluctuating velocity is decreased and the spanwise velocity and the wall-normal fluctuating velocity are increased.In addition, one observes larger and more profuse quasi-streamwise vortices, hairpin vortices and elongated structures above the crest plane of the roughness array in cases of highly stochastic rough walls.However, the low-speed streaky structures are broken up locally and the ejection and sweep events are depressed by the stochastic roughness below the average roughness height.The results of this study support Townsend’s wall-similarity hypothesis for both stochastic and uniform rough wall turbulences, demonstrating that in both cases the effects of the surface roughness on the turbulent flow are limited to the rough sub-layer.
Key words: Large eddy simulation, turbulent channel flow, rough wall, stochastic roughness height
Introduction
The surface roughness elements such as ribs and cubes find a wide range of energy engineering applications, especially in heat exchangers, stream turbines and air conditioners[1-2].The characteristics and the structures of the flow over the surface roughness elements are crucial for the design and the optimization of such industrial devices, because the efficiencies of the mass, momentum and heat transfers are very much influenced by the flow patterns[3-5].
Leonardi et al.[6]found that the maximum form drag occurs whenw/k=7, ascoincides with the minimum skin frictional drag.Ashrafian and Andersson[7]studied the turbulent structures in the rough sub-layers and the outer layers using the direct numerical simulation (DNS).They found that the vorticity fluctuation is enhanced by the surface roughness in the rough sub-layer (y<5k).However,the vorticity fluctuation is not significantly modified by the roughness elements in the outer layer, as compared with the smooth-wall case.Using the laser Doppler velocimetry (LDV) and the particle image velocimetry, Volino et al.[8]also found that the outer-layer turbulent structures in the smooth-wall flows are very similar to those in the transverse rough-wall flows.
3-D rough-wall turbulent flows were also investigated based on studies of 2-D rough-wall flows.Lee et al.[9]studied the turbulent boundary layer flow over 2-D and 3-D rough walls and found that the turbulent Reynolds stress is affected by the cube roughness not only in the roughness sub-layer but also in the outer layer.The introduction of the 3-D roughness significantly affects the streaky structures in the near-wall region and the low-momentum regions in the outer layer.However, the large-scale structures in the outer layer have similar characteristics across 2-D and 3-D roughened walls.Ahn et al.[10]investigated the turbulent boundary layer flow over 3-D cubic rough walls for different values ofwx/kandwz/k, withwxandwzbeing the streamwise and spanwise roughness spacings,respectively.The maximum flow drag occurs whenwx/k=3 andwz/k=3.Recently, Liu et al.[11]investigated the turbulent boundary layers over hemispherical rough walls using the DNS and the immersed boundary method (IBM).The results show that the effects of the roughness elements on the coherent structure are not limited to the rough sublayer but also in the outer layer.
It remains unclear whether the effects of the wall roughness elements on the turbulent motion and fluctuation are limited to the rough sub-layer(y<5k) or they extend to the outer layer (y>5k)as well, i.e., whether Townsend’s[12]wall-similarity hypothesis holds.In support of this hypothesis, a number of studies, such as Flack et al.[13], Wu and Christensen[14]and Castro[15], show no obvious differences in the outer-layer turbulent fluctuation between the smooth- and rough-wall flows in either 2-D or 3-D rough wall cases.However, the wall-similarity hypothesis has also been contradicted by the results of several experiments and numerical simulations, such as Krogstad and Antonia[16]and Volino et al.[17]for 2-D rod roughness.One of the objectives of this study is to examine the applicability of the wall-similarity hypothesis to a 3-D roughness array with elements of equal height.Even more importantly, the applicability of the hypothesis to the 3-D roughness with stochastic height distributions has not yet been investigated, to the best of the authors’knowledge.
The turbulent flow over 2-D and 3-D rough walls with the same roughness height was widely investigated.However, the influence of the surface roughness with stochastic height distributions on the turbulent flow remains a not very much touched area.As this type of roughness is most frequently encountered in nature and engineering applications,the characteristics and the mechanisms of the turbulent flow over the rough walls with stochastic height distributions should be investigated carefully.Therefore, this paper will investigate the effects of 3-D stochastic roughness elements on the turbulent velocity statistics and the coherent structures in a turbulent channel flow, and to compare them with the effects of equal roughness height distributions on the smooth-wall turbulent flow and the 3-D rough-wall flow.The study also examines the applicability of Townsend’s wall-similarity hypothesis[12]to the stochastic rough-wall flow.
1.Flow configurations
The turbulent channel flows over rough walls can be described as hydraulically smooth, transitionally rough or fully rough, when the roughness element heightsk+<5 , 5<k+<70 andk+<70 ,respectively.The investigation in this paper focuses on the transitionally rough flows.Figure 1 shows a schematic diagram of a computational channel with a stochastic rough wall.The channel size is specified as 6h× 2h× 3hin the streamwise (x), wall-normal(y) and spanwise (z) directions, respectively.Simulation is carried out for the smooth-wall case and the three rough-wall cases,as shown in Table 1.For the rough-wall cases, a 3-D roughness array with a stochastic height distribution is arranged on the bottom wall of the channel with equal streamwise and spanwise spacings, whereas the upper wall is smooth.The roughness height is distributed in a specified range.The average roughness height/his 0.1.Based on the friction velocityuτand the half channel height, the frictional Reynolds number is equal to 180.Therefore, the average roughness heightis 18 in wall units.The roughness height variance+δin the three rough-wall cases is 0, 3 and 6,respectively, in wall units.The roughness elements with the stochastic heights are generated by a Gaussian random function.
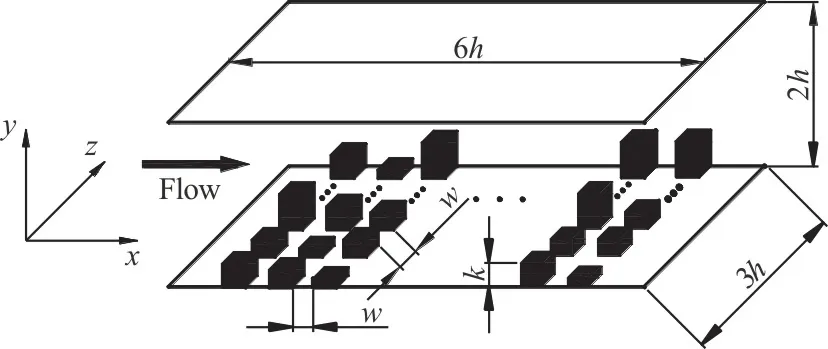
Fig.1 Schematic diagram of turbulent channel flow with stochastic roughed wall

Table 1 Computational cases
The smooth and rough walls in the computation are shown in Fig.2, with Figs.2(a)-2(d) being the cases of the smooth wall, the rough wall withk+=18,the rough wall withk+=18 ±3 and the rough wall withk+=18 ±6, respectively.The length and the width of the roughnessw/hare both 0.375.The ratio of the roughness spacing to the average height,w/,is 1 in the streamwise and spanwise directions in all rough-wall cases.
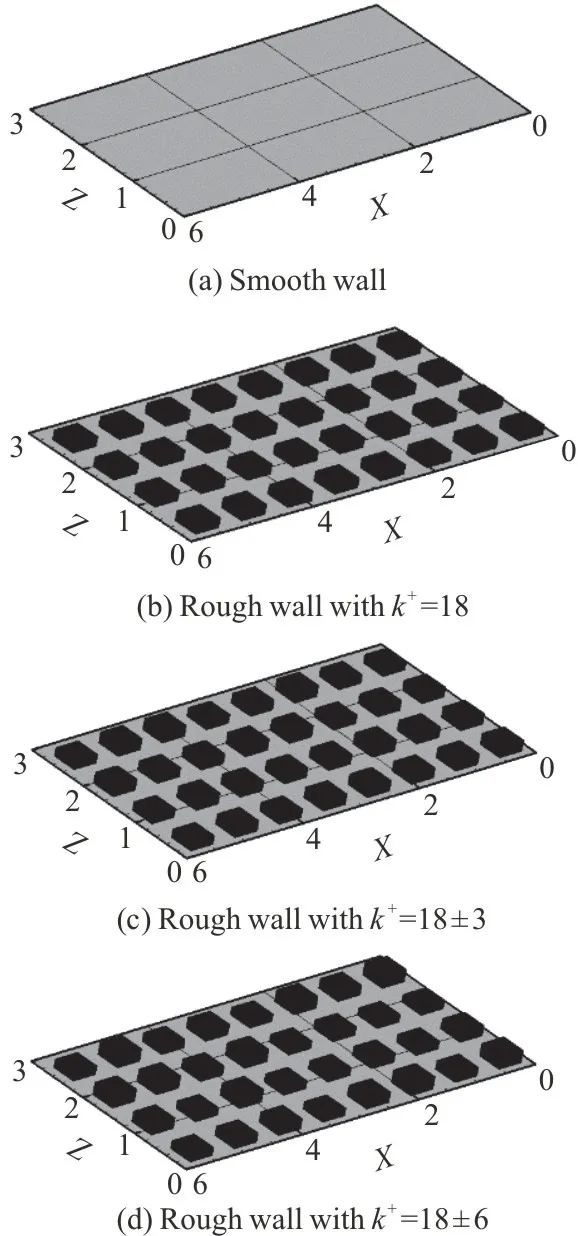
Fig.2 The smooth and rough walls in the computation
2.Numerical simulation procedures
The LES coupled with the IBM is used to simulate a channel flow with cubic surface roughness.The 3-D incompressible continuity and Navier-Stokes equations are represented in Eqs.(1), (2), respectively,following the use of a classical box filter:
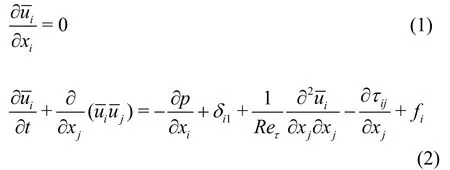
whereis the flow velocity,fiis the momentum forcing defined at the faces of the roughness elements inside the body, andτijis the sub-grid-scale stress,which is approximated with the eddy viscosity hypothesis, as follows

The eddy viscosityμTand the strain rate tensorare defined as

whereCSGSis an empirical constant, taken as 0.1 in this paper.For the channel flow, a damping functionfs=1 - exp(-y+/25) is applied in Eq.(4), because the Smagorinsky model provides an overlarge dissipation prediction near the wall and the viscosity at the wall must be zero.
The fractional step method is used to solve Eqs.(1), (2).The viscous term and the convective term are discretized using a second-order central scheme and a second-order hybrid scheme, respectively, to reduce the aliasing errors and to avoid instability.The momentum equations are integrated explicitly using the third-order Runge-Kutta algorithm.The pressure Poisson equation is solved by Fourier series expansions with the tridiagonal matrix inversion in the streamwise and spanwise directions.
The roughness elements are modeled using the IBM, first proposed by Peskin and McQueen[18].Generally, the IBM can be divided into the continuous forcing approach and the discrete forcing approach,according to the different methods of treating the forcing function.The discrete forcing approach can be further divided into the direct forcing method and the feedback forcing method.In this study, the direct discrete forcing approach is adopted to model the surface roughness.
The direct forcingfiis imposed on the right-hand side of the momentum equation, as shown in Eq.(6) to apply the non-slip boundary condition to the solid wall of the surface roughness


As the fractional step method is used in the present simulation, the pressure Poisson equation and the velocity equation are solved separately.No other interpolation of the pressure values is required on the pressure grids.Moreover, the eddy viscosity is forced to be zero on the IBM points.
In the streamwise and spanwise directions, the periodic boundary conditions are applied.A no-slip boundary condition is applied on the wall.The grids are uniform in the streamwise and spanwise directions,and more grid points are clustered near the wall in the wall-normal direction using a hyperbolic tangent function.The grid spacing in wall units is Δx+=8.4,Δz+=8.4 and Δymin+=0.49near the wall and Δymax+=4.50at the center of the channel.Based on the average dissipation rate per unit mass across the channel width, the Kolmogorov scale of the present flow is two wall units.Therefore, the minimum and maximum ratios of the transverse grid spacing to the Kolmogorov scale are 0.24 and 2.25, respectively.In the streamwise and spanwise directions, the ratios of the grid spacing to the Kolmogorov scale are both 4.2.This indicates that the present grid resolution is sufficient for the LES.
3.Results and discussions
3.1 Numerical verifications
To verify the LES method for the turbulent channel flow over a smooth wall, the turbulent velocity statistic profiles are obtained and compared with the DNS data obtained by Kim et al.[19].Figure 3 shows the mean streamwise velocity and the fluctuating velocity of the fluids.The LES results agree well with the DNS data, as shown in Fig.4.This indicates that the LES codes used here are very effective in resolving the turbulent channel flow.
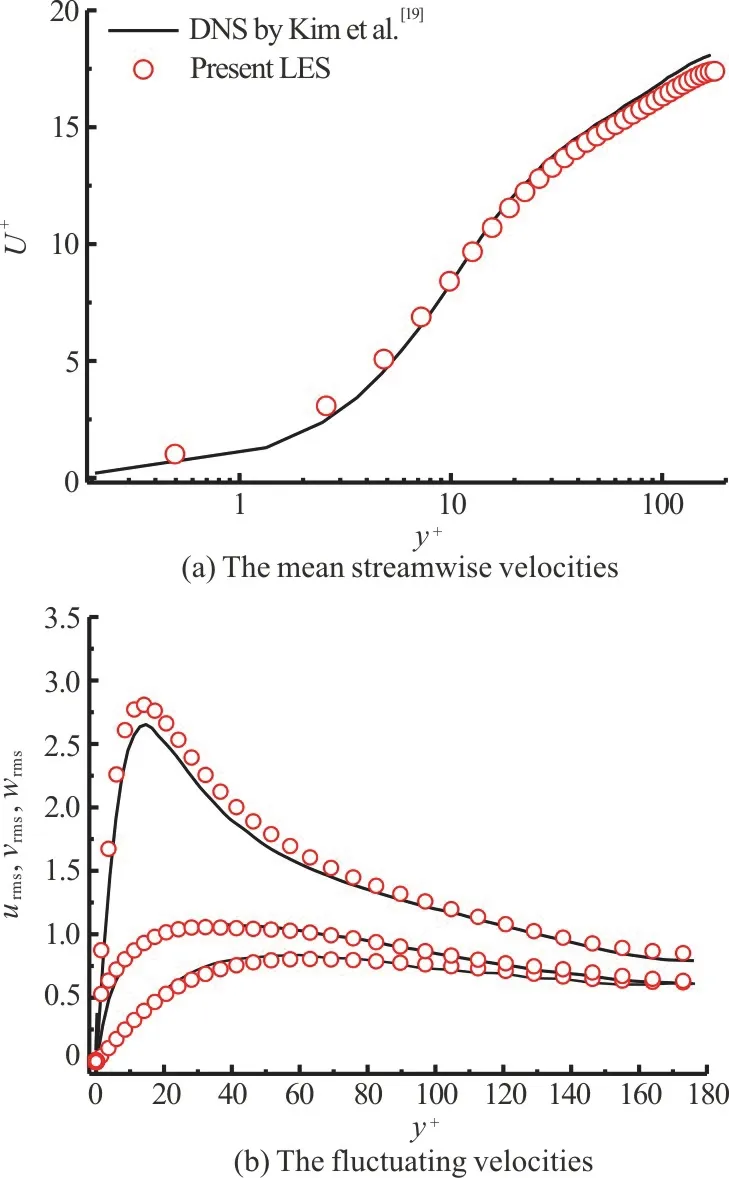
Fig.3 (Color online) Velocity statistical profiles of turbulent channel flow over smooth wall
The IBM with the surface roughness elements is also validated.Following the experimental case reported by Burattini et al.[20], the turbulent channel flows over transverse 2-D rough walls forw/k=3 are calculated using the codes obtained.More details of the flow configurations can be found in the literature[21].The mean and fluctuating velocity statistical profiles normalized by the maximum flow velocity are obtained and compared with the experimental results, as shown in Fig.4.The grid independent check is conducted as a part of validation,as shown in Fig.4.The grid numbers are 64×64×64 and 128×128×64.The grid spacings of the coarse mesh near the rough wall are Δx+=16.8, Δz+=8.4,Δymin+=0.95near the wall and Δymax+=11.42at the centre of the channel.For the fine mesh, the grid spacings near the rough wall are Δx+=8.4,Δz+=8.4, Δymin+=0.49near the wall and Δymax+=4.50.The Kolmogorov scale of the turbulent channel flow at the present Reynolds number is about 2 wall units.Thus the present fine gird spacing never exceeds 5 times of the Kolmogorov scale around the roughness elements.From Fig.5, it can be found that there are some difference both for the mean and fluctuating velocities between the numerical results of the coarse mesh and the experimental data.However,the CFD results of the fine mesh are in good agreement with the experimental data.This indicates that the present fine grids can resolve the turbulent channel flow with rough walls very well.Therefore,the rough-wall cases are calculated using 1.04 million staggered grids.The grid numbers are 128×64×128 in thex,yandzdirections, respectively.The mean streamwise and fluctuating velocities all agree very well with the experimental measurements, which indicates that the numerical methods and the grids developed here are highly effective in calculating such rough-wall turbulence.

Fig.4 (Color online) Velocity statistical profiles of turbulent channel flow over 2-D transverse rough wall
3.2 Turbulence velocity statistics
Figure 5 shows the mean streamwise velocity profiles of the turbulent flows over smooth and rough walls.The mean streamwise velocity is normalized by the frictional velocityuτ.In Fig.5(a), the normal coordinates are used to show the whole velocity profile, and in Fig.5(b), the logarithmic coordinates are used to show the details in the near-wall region.It is clear from the figures that the mean streamwise velocities in the three rough wall cases almost overlap below the average roughness height (y/h<0.1,y+<18), and are all lower than those in the smooth-wall case due to the extra form drag induced by the roughness elements.
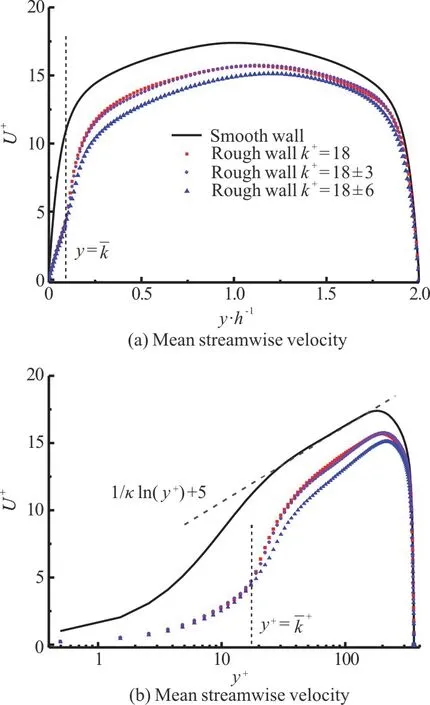
Fig.5 (Color online) Mean velocity profiles for smooth and rough walls
The effective flow area is reduced and the flow is depressed by the introduction of a roughness element array below this height.Above the average roughness height (0.1<y/h<2.0,1 8<y+<360), the variance appears in the three rough-wall cases.The mean streamwise velocity decreases with the increase of the roughness height variance, especially at high levels of the roughness height variance.In this study, the imposed pressure in the flow is held constant across the four cases.Therefore, the decrease of the velocity represents an increase of the flow drag.Higher roughness elements appear with greater variation in the roughness height, producing more form drag.Additional flow drag is induced by the height variance between adjacent roughness elements.
In Fig.5(b), a perfect logarithmic velocity distribution of the wall turbulence is observed in the smooth-wall case, which can be expressed by the following formula

whereκthe von Karman constant, is 0.41,B=5.Log regions remain in the mean velocity profiles for roughness elements with both equal and stochastic height distributions.This indicates that the stochastic roughness elements never contravene the log law of the wall turbulence.The log-region velocity distribution in the rough wall cases can be expressed as follows

where ΔU+is the roughness function, which represents the increase of the flow drag induced by the roughness.The roughness function has been shown to be determined by the Reynolds number, the roughness height and the roughness shape.In this study, it is equal to 0 in the smooth-wall case A and 1.65, 1.71 and 2.27 in the rough-wall cases B, C and D,respectively.This indicates that the roughness function ΔU+increases significantly with the variation of the roughness height, implying that the form drag of the rough-wall turbulent flow is closely related to the roughness height randomness.
Figure 6 shows the fluctuating velocity profiles of the turbulent flows over smooth and rough walls.Figs.6(a)-6(c) show the root mean squares of the streamwise, wall-normal and spanwise turbulent velocity fluctuations, respectively.The fluctuating velocities are normalized by the local values of the frictional velocityuτ, and the wall-normal distance from the plane of the average roughness height(y-) on the horizontal axis is normalized byhl,the distance from the plane of the average roughness height to the maximum velocityU+.Figure 6 shows that the turbulent fluctuating velocities in all three directions in the rough-wall case B agree with those in the smooth-wall case A fory>5.Therefore, the results of this study support the wall-similarity hypothesis for the rough-wall flows with equal roughness height.Even more importantly, the rough-wall cases C, D show no significantly greater effects on the turbulent fluctuation in the outer layer(y>5) compared with the smooth-wall case A,indicating that the wall-similarity hypothesis holds even for the rough wall with a stochastic height distribution.These results imply that a roughness array with a stochastic height distribution has only a limited influence on the turbulent fluctuation in the roughness sub-layer, although it has greater effects on the turbulent flow than a roughness array with an equal height distribution.
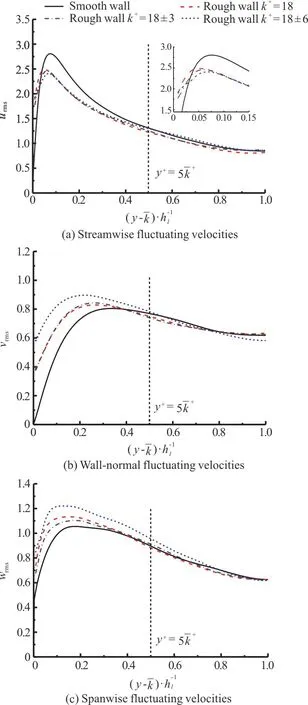
Fig.6 (Color online) Fluctuating velocity profiles for smooth and rough walls
In the smooth-wall case, the peaks of the fluctuating velocities are mainly due to viscous eff ects,whereas the pressure forces aremore important inthe rough-wall case because the flow drag is caused predominantly by the roughness elements.In the roughness sub-layer (y<5), the streamwise fluctuating velocity is decreased but the spanwise and wall-normal fluctuating velocities are increased by the roughness array with an equal height distribution.The turbulent kinetic energy is transferred from the streamwise direction to the spanwise and wall-normal directions by the obstructions created by the roughness elements, and the wall turbulence anisotropy is reduced by the surface roughness.In addition, a larger decrease of the streamwise fluctuating velocity and a larger increase of the spanwise and wall-normal fluctuating velocities are observed in the rough-wall cases C, D than in the rough-wall case B.These changes are closely associated with the modification of the turbulent coherent structures due to the surface roughness near the wall.The quasi-streamwise vortices (QSVs) are broken up locally by the roughness elements, and stronger spanwise and wall-normal turbulent fluctuations are observed in the rough-wall cases than in the smooth-wall case due to the stronger turbulent ejections from the cavities of the roughness array.The effects of the stochastic surface roughness on the turbulent coherent structures will bed is cussed in detail later.The above results clearly indicate that the roughness array with a height variance has a greater influence on the turbulent fluctuation than the array with an equal height distribution, but this influence is limited to the roughness sub-layer (y<5k).
The distribution of the Reynolds shear stressfor the smooth and rough walls is shown in Fig.7.The Reynolds shear stress is normalized by.The shear stress can be expressed as follows

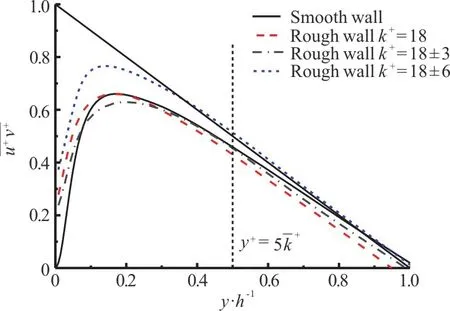
Fig.7 (Color online) Reynolds shear stress for smooth and rough walls
The Reynolds shear stress in the roughness sub-layer (y<5) is significantly higher in the rough-wall case D than in other cases.As the Reynolds shear stress represents the mean momentum flux due to the velocity fluctuation, the greater shear stress indicates that more intense momentum transport and exchange are induced by the surface roughness with a large height variance than by the smooth walls or the uniformly rough walls.However, the values of the Reynolds shear stress in the outer layer (y>5)are almost the same in all cases, as shown in the figure,similar to the velocity fluctuations discussed above.This again indicates that Townsend’s wall-similarity hypothesis holds for both uniform and stochastic rough-wall turbulent flows.
3.3 Turbulent coherent structures
It is widely accepted that the coherent structures near a wall are closely associated with the turbulence production and the energy transport in the boundary layer[21-23].The most significant structures in the turbulent channel flows are the QSVs, the low-speed streaks and the related ejections and sweeps near the wall.To investigate the influence of the 3-D roughness array with a stochastic height distribution on the QSVs, the streamwise vorticityωxis visualized numerically on theY-Zplane atX=1.125 for the smooth and rough walls, as shown in Fig.8.The streamwise vorticityωxis defined as

The arrows and the colors in the figure represent the flow velocity vectors and the vorticity magnitudes,respectively.Several pairs of counter-rotating streamwise vortices are shown in Fig.8(a) in the smooth-wall case.However, large-scale QSVs are still observed in the three rough-wall cases, similar to the smooth wall case, as shown in Figs.8(b)-8(d).The difference is that the streamwise vortices in the rough-wall cases are generated from the crest of the roughness array, rather than from the wall, as in the smooth-wall case.In addition, the size and the quantity of the QSVs are significantly increased due to the surface roughness, as compared to the smooth-wall case.Even more importantly,significantly larger and stronger QSVs are observed in the rough-wall case with a large height variance than in the case with an equal roughness height distribution.This indicates that the QSVs are not eliminated by introducing the surface roughness with either an equal or a stochastic height distribution.However, the position of the generation, the size and the quantity of the QSVs are all affected by the roughness array.In addition, the surface roughness with a large height variance has a more significant influence on the QSVs than the roughness with an equal height distribution.More intense ejections are elicited by the non-uniform surface roughness, increasing the wall-normal and spanwise turbulent velocity fluctuations.
The values of the dimensionless streamwise vorticity in Fig.8 inthe smooth- and rough-wall cases are -110-185 for the smooth-wall case A, -254-324 for the rough case B, -339-291 for the rough case C and -531-423 for the rough case D.This further proves that the QSVs are enhanced by the surface roughness, especially the roughness with a stochastic height distribution.Therefore, the turbulence production and the energy transport in the wall-normal direction are more intense in the stochastic rough case than in either the smooth case or the rough case with an equal roughness height distribution.This is likely to enhance the effectiveness and the efficiency of mixing and heat transfer.
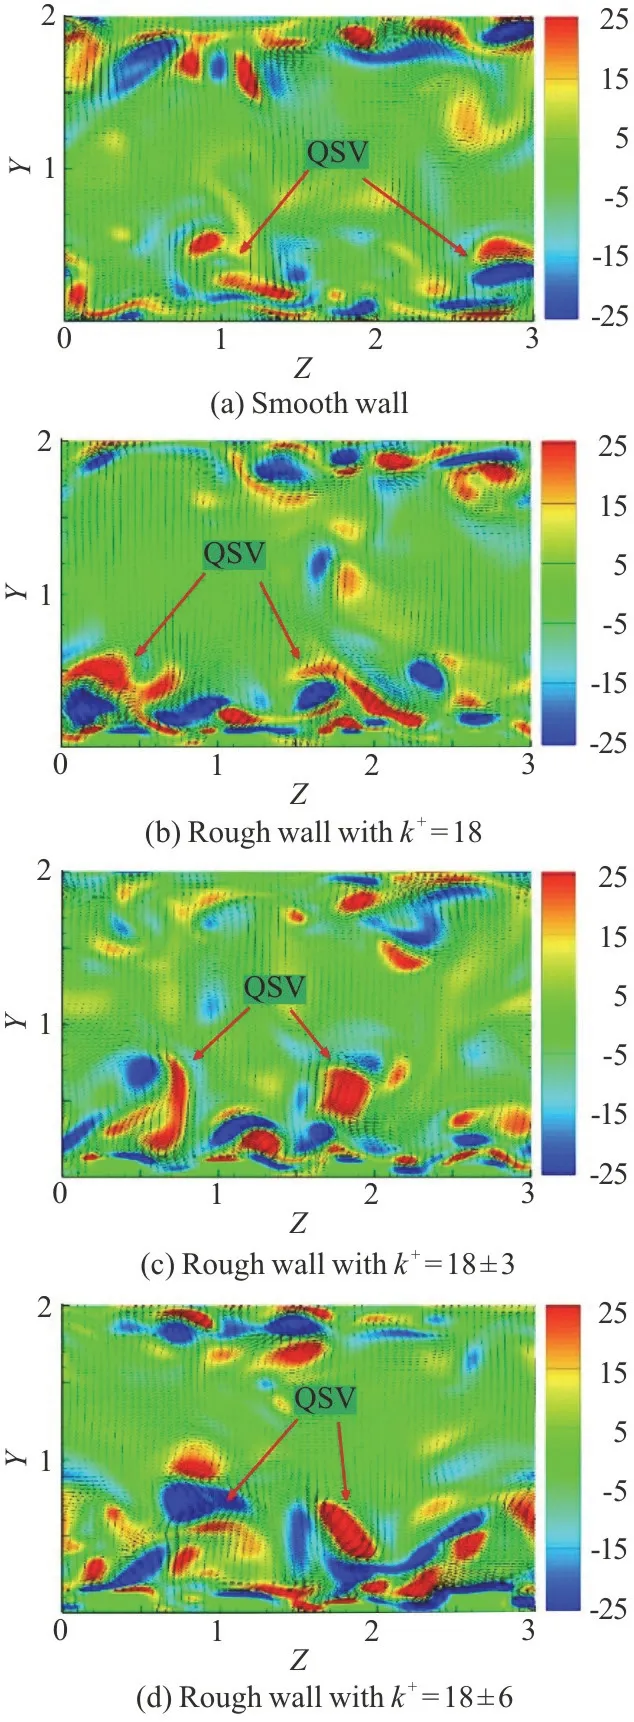
Fig.8 (Color online)QSVs on the Y-Z plane at X=1.125 for smooth and rough wall
To more clearly display the effects of the surface roughness array on the 3-D vortex near the wall, the iso-surfaces of theQ-criterion inthe smooth- and rough-wall cases are shown in Fig.9.The colors in the figure represent the streamwise velocity fluctuation.TheQ-criterion is a means of visualizing the turbulent vortical structures.It is the second invariant of the velocity gradient tensor and is defined as follows:


Fig.9 (Color online)Iso-surfaces of Q-criterion for smooth and rough walls
whereΩij=1/2(∂ui/∂xj-∂uj/∂xi) andSij=1/2(∂ui/∂xj+ ∂uj/∂xi), representing the antisymmetrical and symmetrical parts of the velocity gradient tensor, respectively.Positive values ofQrepresent the vortical structures in the flow field,which offers a more objective measure than the vorticity.The value ofQin the figure is 0.1.The 3D vortex structures in the smooth-wall case are clearly shown in Fig.9(a).Typical coherent structures such as hairpin vortices (HPVs) and elongated structure (ESs)can be found in the near-wall region.
Compared with the smooth-wall case, in the rough-wall cases, more abundant vortical structures are found, located above the surface roughness.In addition, more HPVs and ESs appear in the rough-wall case D than in the rough-wall case B,indicating that these coherent structures are enhanced more by the stochastic roughness than by the roughness of an equal height.This is also in agreement with the abovementioned results for the QSVs.The numerous incoherent structures (ICVs) are observed below the crest of the roughness.It can be concluded that these ICVs are induced by the sweep events and destroyed by the roughness array.Therefore, the vortical structures are locally broken up by the surface roughness below the average roughness height.
To investigate the effects of the surface roughness array with a stochastic height distribution on the turbulent streaky structures near the wall, the turbulent streaky structures are numerically visualized in the smooth- and rough-wall cases using the instantaneous streamwise velocities.The streamwise velocity streaks on theX-Zplane aty+=5.6 are displayed in Fig.10.The blue and red areas in the figure represent the low- and high-speed streaks,respectively.Approximately five obvious blue streaky structures are observed in the smooth-wall case, as shown in Fig.10(a), and these elongated low-speed streaks extend downstream for several hundred wall units.In addition, the spanwise spacing between nearby streaks is approximately 110 wall units,according to Fig.10(a).The agreement between these findings further indicates that the turbulent structures are well resolved by the LES codes used in this study.In the rough-wall case D with a large roughness height variance, the obvious elongated low-speed streaks in the smooth-wall case in the near-wall region are not observed, as shown in Fig.10(d).This indicates that the low-speed streaky structures are completely destroyed by the stochastic surface roughness, similar to the findings for the rough-wall case B with equal roughness height, as shown in Fig.10(b).
As the production of the low-speed streaks is closely associated with the ejections, the ejection motions below the roughness element height can be assumed to be greatly restrained by the surface roughness for both equal and stochastic roughness height distributions.The high-speed streaks related to the sweeps are also depressed by the surface roughness compared with the smooth-wall case.However, more high-speed streaks occur in the rough-wall case D than in the rough-wall case B or C.This implies that the sweep motions below the roughness height are stronger and more frequent in the rough-wall case with a large roughness height variance than in the rough-wall case with an equal roughness height distribution.In summary, the surface roughness has a great in fluence on the turbulent streaky structures near the wall.Obvious differences are observed in the high-speed streaks between the equal and the stochastic roughness arrays.
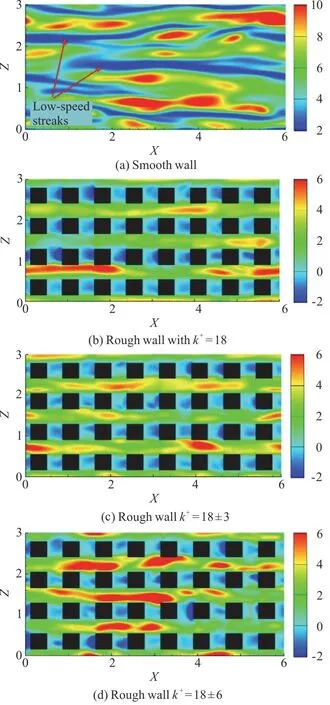
Fig.10 (Color online) Streaky structures on the X-Z plane at y+=5.6 for smooth and rough walls

Fig.11 Quadrant analysis of turbulent velocity fluctuation for smooth and rough walls on X-Z plane at y+=5.6
To shed more light on the effects of the surface roughness on the turbulent events near the wall, Figs.11, 12 display the results of the quadrant analysis of the turbulent velocity fluctuation in the smooth- and rough-wall cases on theX-Zplane aty+=5.6,12.7, respectively.In the figures, the streamwise velocity fluctuationu′ and the wall-normal velocity fluctuationv′ are bothdivided into four quadrants.The second quadrant (u′< 0,v′> 0) represents the low-speed fluids moving away from the wall, i.e., the ejections.The fourth quadrant (u′> 0,v′< 0)represents the high-speed fluids moving toward the wall, i.e., the sweeps.Figure12(a) shows that in the smooth-wall case A,the turbulent velocity fluctuation is dramatically concentrated in the fourth quadrant aty+=5.6, implying that the strong sweep events occur on this plane.Away from the wall aty+=12.7, the velocity fluctuation is concentrated in the second and fourth quadrants, as shown in Fig.11(a).This indicates that significant ejections and sweeps appear on this plane in the smooth-wall case.

Fig.12 Quadrant analysis of turbulent velocity fluctuation for smooth and rough walls on X-Z plane at y+=5.6
In the rough-wall cases, the velocity fluctuation aty+=5.6 is noticeably more homogeneous across the four quadrants, as shown in Figs.11(b)-11(d).This indicates that the sweep events near the wall are dramatically depressed by the surface roughness,relative to the smooth-wall case.In addition, the sweeps in the rough-wall case D are stronger than those in the rough-wall case B, which explains why more high-speed streaks appear in the rough-wall case with a large roughness height variance,as shown in Fig.10(b).Aty+=12.7, the preferential distribution of the velocity fluctuation in the second and fourth quadrants can be observed in the three rough-wall cases shown in Figs.12(b)-12(d).However, the ejections and the sweeps are significantly weaker than those in the smooth-wall case.
4.Conclusions
To understand the influence of the surface roughness elements with stochastic height distributions on the velocity statistics and the coherent structures of the turbulent channel flows, the turbulence flows over smooth and rough walls are simulated numerically using the LES and the IBM,based on our in-house codes.Through analysis of the statistics for the mean velocities, the Reynolds shear stress and the fluctuating velocities and the visualization of the QSVs and the streaky structures in the near-wall region, the following conclusions can be obtained.
(1) At the same average roughness height, more flow drag is induced by a surface roughness array with a stochastic height distribution than by a surface roughness array with an equal height distribution.However, the wall similarity for the mean velocity profile holds for both the rough wall with stochastic roughness height and the wall with equal roughness height.Compared with the surface roughness with equal height, the rough array with a height variance more significantly decreases the streamwise velocity fluctuation and more significantly increases the spanwise and wall-normal velocity fluctuation.In addition, the turbulent anisotropy is reduced by the surface roughness.
(2) For the turbulent flow over a 3-D rough wall with equal roughness height, the findings of this study support Townsend’s wall-similarity hypothesis.Even more importantly, this hypothesis is also shown to hold in stochastic rough wall cases.Although the stochastic surface roughness has a more significant influence on the turbulent velocity fluctuation than the roughness with an equal height distribution, this influence is limited to the rough sub-layer (y<5k),andno such effects are observed in the outer layer.
(3) Compared with the rough-wall case with an equal roughness height distribution, the stochastic rough wallcase displays larger and more profuse QSVs, HPVs and ESs above the crest plane.However,the surface roughness locally destroys the low-speed streaks and depresses the ejection and sweep events below the crest plane of the roughness elements.
The results of this study reveal significant differences between the stochastic and uniform rough wall cases, withthe same average roughness height.The stochastic surface roughness has a more dramatic influence on the turbulent flow and coherent structures.As larger and more profuse turbulent vortices are induced above the stochastic roughness array than above the uniform roughness array, the stochastic roughness elements are more conducive to the effective and efficient flow mixing and heat transfer than the uniform roughness elements.The effects of the roughness spacing and shape on the turbulent flow properties and the coherent structures should be investigated in future.
Acknowledgements
This work was supported by the Fundamental Research Funds for the Central Universities (Grant No.D2191930), the “Xinghua Scholar Talents Plan” of South China University of Technology (Grant No.K5183300).
杂志排行
水动力学研究与进展 B辑的其它文章
- Prediction of the precessing vortex core in the Francis-99 draft tube under off-design conditions by using Liutex/Rortex method *
- Experimental study of an ellipsoidal particle in tube Poiseuille flow *
- The hydraulic performance of twin-screw pump *
- Numerical investigation of frictional drag reduction with an air layer concept on the hull of a ship *
- Effects of finite water depth and lateral confinement on ships wakes and resistance *
- The velocity patterns in rigid and mobile channels with vegetation patches *
