Characteristics of Zhangsanying—Tongshanzi aeromagnetic anomaly zone and prospecting potential of iron deposits in northern Hebei, China
2020-07-07LIWenyongLIUYanxuLUWenfenMAGuoqingZHANGChongshanandZHAOJiawei
LI Wenyong, LIU Yanxu, LU Wenfen, MA Guoqing,ZHANG Chongshanand ZHAO Jiawei
1. China Aero Geophysical Survey & Remote Sensing Center for Natural Resources, Beijing 100083, China;2. College of Geo-Exploration Science and Technology, Jilin University, Changchun 130026, China;3. Hebei Institute of Geological Survey, Shijiazhuang 050081, China
Abstract: Based on the latest high-precision aeromagnetic data, an aeromagnetic anomaly zone is identified at Zhangsanying--Tongshanzi in northern Hebei Province. By the potential field conversion processing, including the reduction to the pole, vertical derivative, upward continuation and residual anomaly, the authors analyzed the characteristics of three typical aeromagnetic anomalies in Zhangsanying--Tongshanzi aeromagnetic anomaly zone and their geological origin. The methods include the forward and inversion methods, such as 2.5D optimization fitting and Euler deconvolution. Moreover, combined with the geological outcrop, known iron deposits, ground magnetic survey and verification, the authors studied the relationship between the aeromagnetic anomalies and iron deposits. The result shows that the Zhangsanying--Tongshanzi aeromagnetic anomaly zone is composed of 10 large magnetic anomalies with high amplitude and clear boundary. The aeromagnetic anomalies are comparable and intrinsically related to the ground magnetic anomalies and IP anomalies, indicating that the anomalies are caused by magnetite deposits. It has good magnetite prospecting potential in the Zhangsanying--Tongshanzi aeromagnetic anomaly zone.
Keywords: Zhangsanying--Tongshanzi aeromagnetic anomaly zone;forward and inversion;ground survey and verification;prospecting potential;iron deposit;northern Hebei
0 Introduction
Iron deposits are not only very important mineral resources but also strategic resources, and many countries invested heavily for the prospecting of irons. In the past decades, the precision of aeromagnetic survey had been improved significantly (Bansaletal., 2013; Osinowoetal., 2013), and the aeromagnetic survey played an important role in ore prospecting (Ecclesetal., 2005;Campbell, 2006; Campbell, 2009; Andersonetal., 2013; Mieth & Jokat, 2014).
Hebei Province is located in the north of China and has abundant mineral resources. Its ore production ranks high in China. The iron deposits in Hebei can be divided into four different genetic types: ①sedimentary metamorphic iron deposits mainly occur in eastern and northern Hebei (Dingetal., 2009; Zhaietal., 2011; Zhangetal., 2012); ②contact metasomatic iron deposits are distributed in southern Hebei (Handan--Xingtai region) and in central Hebei (Laiyuan--Fuping region) (Haoetal., 2008; Shenetal., 2012); ③magmatic iron deposits are distributed in northern Hebei (Sunetal., 2009; Lietal., 2010); ④sedimentary iron deposits are distributed in orthwestern Hebei (Xuanhua region) (Luetal., 2011; Li & Zhu, 2012). In recent decades, Hebei has been one of the important areas for iron ore prospecting in China, and the iron prospecting using aeromagnetic survey has achieved remarkable results (Luetal., 2008; Mengetal., 2009; Lietal., 2010; Wang, 2010).
The northern Hebei, covers about 6×10⁴km2. In the past few decades, there were many geological-geophysical explorations and ore-prospecting works by different kinds of measures in this area (Panetal., 2010; Caietal., 2012; Yangetal., 2012; Jiangetal., 2014), and dozens of iron deposits have been discovered and mined (Chenetal., 2011; Xiangetal., 2012; Zhouetal., 2013; Duanetal., 2014; Lietal., 2014). However, the iron deposits were not discovered in the north and west of Longhua (the northeastern part of the northern Hebei), covering an area of about 1.5×10⁴km2. In order to prospect the iron deposits, we carried out aeromagnetic survey over this area in the past few years. Based on the latest high-precision aeromagnetic data in this study area, this paper discusses the Zhangsanying--Tongshanzi aeromagnetic anomaly zone and its prospecting potential.
1 Geological setting
Zhangsanying--Tongshanzi aeromagnetic anomaly area is located in the edge of North China craton (Zhangetal., 2010; Baietal., 2013) (Fig.1). North China craton with stable crystalline basement formed at the end of Paleoproterozoic and unstable volcano-sedimentary cover formed in Mesozoic (Zhaoetal., 2010). The faults in the study area are mostly near E-W trending and NE-SW trending. One of the faults, located in the southern part of the study area named Fengning--Longhua fault, is a regional deep fault with near E-W trending and controlled the distribution of magmatic rocks.
The study area belongs to complex mountainous area with extensive outcrops. The outcrops are composed of Neoarchean, Mesoproterozoic, Mesozoic and Cenozoic rocks (BGMR, 1989). The Neoarchean strata, distributed mainly in the south, as well as scattered in the north, are a series of medium-high grade metamorphic rocks (Dantazi Group and Shuangshanzi Group) consisting of plagioclase amphibolite, biotite-bearing plagioclase gneiss, granulite, leptynite, migmatite and magnetite quartzite. The Mesoproterozoic strata, exposed only in the south to Longhua, is a littoral-neritic sedimentary formation consisting of carbonate rocks intercalated with a small amount of clastic rocks. The Mesozoic strata, including Middle and Upper Jurassic, distributed mainly in the north, as well as scattered in the south, comprise terrestrial volcanic-clastic rock series with lithology of intermediate-acid volcanic rocks as well as glutenite, sandstone, siltstone, shale, coal and oil shale. The Cenozoic strata are composed of the Paleogene and Quaternary. The Paleogene is scattered sporadically in the north, with main lithology of basalt (Hannuoba Formation). The Quaternary occurs only in the intermontane ravine, piedmont as well as river valley, with residual, slope and alluvial sediments.
The magmatic activities are strong and frequent in this area, and there are intrusive rocks in three stages (Zhangetal., 2010). The Archean metamorphic intrusive rocks occur on the southern edge, with lithology of diorite, granite, granogneiss and dioritic gneiss. The Late Paleozoic intrusive rocks mostly intruded into the Archean strata with lithology of diorite, granodiorite, granite and syenite. There are polymetallic mineralization in the intrusive rocks and contact zones. The Mesozoic intrusive rocks are the most widely distributed with lithology of granite, granite porphyry, monzonite porphyry, syenite porphyry and quartz syenite. There are no iron deposits discovered in the study area in the past, whereas there are magmatic iron deposits and sedimentary metamorphic iron deposits mined adjacent to the southern the study area (Xiangetal., 2012; Lietal., 2014).

Fig.1 Geological map of Zhangsanying--Tongshanzi area (modified after Zhang & Li, 2010)
2 Data
The aeromagnetic survey was carried out with international advanced HC-2000 helium optical pump magnetometer system, with a sensitivity of 0.005 nT and the sampling rate of 10 per second. The survey scale is 1∶25000, with line interval of 250 m and line direction of 0°--180°, cross line interval of 5 km and cross line direction of 90°--270°, and flight height of 120--350 m from the ground. The total accuracy of aeromagnetic survey after leveling and noise processing (the mean square deviation of aeromagnetic differences for intersection points between survey lines and cross lines) is 1.79 nT.
The processing of aeromagnetic data includes two steps: field preprocessing and indoor processing. The field preprocessing includes data input, assessment of acquisition quality control, statistics of parameters, correction of aeromagnetic data, coordinate transformation, drawing of flying routes, flying heights and aeromagnetic profiles. The indoor processing includes merging of flight database, data checking and editing, coordinate transformation, correction of aeromagnetic normal field, correction of magnetic diurnal variation, lag correction, aeromagnetic leveling, data quality controlling and basic graphics drawing. The data processing was carried out with Geoprobe Mager software developed by China Aero Geophysical Survey & Remote Sensing Center for Natural Resources (AGRS), Oasis Montaj software developed by Geosoft Inc., Canada, AgsMGis software deve-loped by AGRS and MapGIS software developed by Wuhan Zhongdi Digital Technology Co., Ltd., China, for this processing. After processing and interpolation, we obtained the aeromagnetic data with grid of 50×50 m.
3 Methods
3.1 Potential field conversion
Potential field conversion is the basic method of aeromagnetic interpretation. In view of the specific target of this aeromagnetic interpretation, we adopted the processing of potential field conversion such as the reduction to the pole, vertical derivative, upward continuation and residual anomaly with the Geoprobe Mager software (Lietal., 2016).
3.2 Forward and optimization
The essence of forward and optimization is to identify the geological bodies causing field anomaly by modifying the geological model and parameters and making the theoretical field data conform to the mea-sured field data. Based on the measured field data and combining the physical properties of rocks or ores, we build the geological model which makes the theoretical field curve as fitting as possible to the measured curve, and the model parameters from the best fitting can be output as the result (Phuocetal., 2008; Stepniak, 2011; Jung, 2013; Centenoetal., 2014).
The specific steps are as follows: ①The mea-sured anomaly values and coordinates are inputted. ②The geological models are selected. The model selection is based on the characteristics of magnetic anomalies and the known geological environment in the study area. ③The parameters of geomagnetic field and the model are given. Firstly, the parameters of geomagnetic field are given, with the geomagnetic inclination of 60.5°and the geomagnetic declination of -7.3°. Secondly, the model parameters are given, such as vector directions of remanence, magnitude of magnetic susceptibility, and magnitude of remanence, which depend on the actual measurement data from strata, rocks and ores in the study area. ④The theoretical anomaly for the geological model is computed and compared with the measured anomaly. ⑤The fitting degree between the theoretical and measured curves is evaluated, and whether or not the geological model will be modified and the theoretical curve will be recomputed. ⑥If the difference between the theoretical and measured curves does not meet the error requirement, the model will be modified until satisfied. ⑧The model parameters are outputted as the forward result. The above process is conducted using visualization software.
3.3 Euler deconvolution inversion
The Euler Deconvolution is well known for calculating the depth to magnetic body using magnetic anomaly (Cella & Fedi, 2012). The depth values are computed with the module in Oasis Montaj software.
4 Interpretation and results
4.1 Geophysical features
4.1.1 Magnetic properties of rocks and ores
The magnetic parameters of rocks and ores are the foundation for aeromagnetic inversion and interpretation. We measured the magnetic parameters of rocks and ores formed in different geological periods in the study area, and the statistical results are listed in Tables 1 and 2. Remanence was considered when mea-suring the data, with certain effect on the weak magnetic substance and being ignored on the stronger magnetic substance.
The magnetic properties of rocks and ores are as follows: ①The magnetism of sedimentary rocks is generally weak, with susceptibility values less than 100×10-5, ordinarily causing the low gentle magnetic anomalies (All data belong to SI, i.e. system of international units). ②The magnetism of metamorphic sandstones, schists, quartzites and marbles is relatively weak, ordinarily producing relative low magnetic anomalies; the magnetism of the metamorphic leptynites is moderate-strong, causing positive moderate-amplitude magnetic anomalies; and the magnetism of the metamorphic amphibolites, gneisses and migmatites is strong, leading to positive high magnetic anomalies. ③The magnetism of volcanic rocks varies greatly, with susceptibility values of (21--4 688)×10-5. Among them, the magnetism of basalts is the strongest, followed by andesites, and both can bring positive high-amplitude magnetic anomalies; the magne-tism of trachyte andesite is medium, causing the positive moderate-amplitude magnetic anomalies; and the magnetism of rhyolites is relatively weak, leading to the positive low-amplitude magnetic anomalies. ④The magnetism of intrusive rocks also changes greatly, with susceptibility values of (4--6 779)×10-5, and is apparently weakened from ultrabasic to basic to intermediate to acid rocks. Among them, the magnetism of ultrabasic pyroxenites is the strongest, followed by basic gabbros and intermediate diorites, and all three of them can lead to obvious positive high-amplitude magnetic anomalies; and the magnetism of intermediate-acid granodiorites and granodiorite porphyrites, acid granites and granite porphyries and intermediate syenites is medium, causing positive higher-amplitude magnetic anomalies. ⑤The magnetism of magnetite is very strong, with susceptibility values of (8 230--139 260)×10-5and magnetic remanence of 76 327×10-3A·m-1, leading to obvious positive high-amplitude magnetic anomalies.

Table 1 Statistics of magnetic parameters of rocks measured in the study area
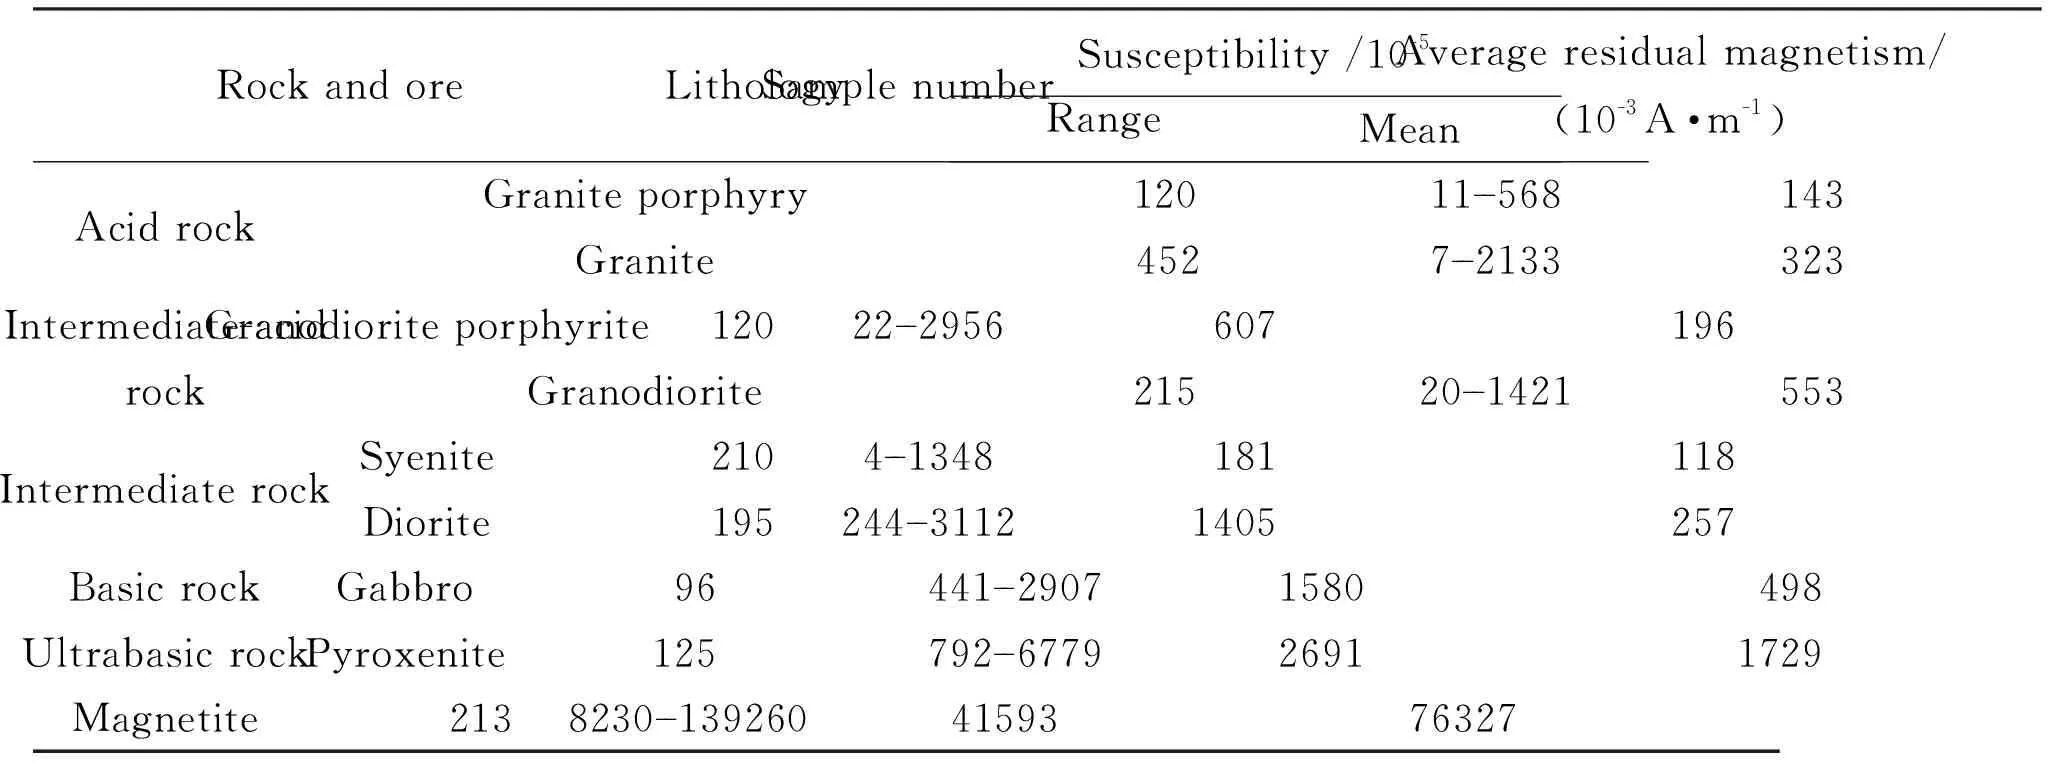
Table 2 Statistics of magnetic parameters of intrusive rocks and iron ores measured in study area
4.1.2 Magnetic field
Overall, the magnetic field in the study area is complex, with large variation of anomaly values from -1 162 to 3 041 nT (Fig.2). There are mainly two trends of magnetic anomaly belts, namely the NE-SW and near E-W trending. The magnetic field can be divided into three subareas, namely the southern positive and negative magnetic subarea, the middle positive high-amplitude magnetic subarea and the northern messy magnetic subarea.
In the southern magnetic subarea, the positive and negative magnetic anomaly zones distribute alternately, with the magnetic anomaly values ranging from -670 to 2 990 nT and the magnetic anomaly zones are near E-W trending. The positive magnetic anomalies are mainly caused by Late Paleozoic intermediate-acid intrusive rocks and Neoarchean sedimentary metamorphic magnetites; and the negative magnetic anomalies are mainly caused by the Neoarchean weak magnetic strata and the Jurassic sedimentary rocks.

Fig.2 Map of aeromagnetic △T of Zhangsanying--Tongshanzi area
In the middle magnetic subarea, the positive high-amplitude magnetic anomalies are widely distri-buted, while the negative magnetic anomalies are limitedly distributed. The magnetic anomaly values range from -1 162 to 3 041 nT and the magnetic anomaly zones are NE-SW trending. The exposed strata are mainly the Neoarchean medium-high-grade metamorphic Dantazi Group (amphibolite, gneiss, granulite, magmatite, and magnetite quartzite), the Late Paleozoic and Mesozoic intrusive rocks (mainly including granite, granite porphyry, syenite porphyry and quartz syenite), and locally distributed Jurassic--Cretaceous pyroclastic rocks. Because of the intrusion of magnetic magmatic rocks along the NE-SW trending faults, the positive magnetic anomalies are superimposed, resulting in the NE-SW trending high superimposed magnetic anomalies. The NE-SW trending high-amplitude magnetic anomaly zone along the Zhangsanying--Tongshanzi line is especially obvious.
In the northern magnetic subarea, the magnetic anomalies are largely and irregularly changing, with the positive bead-shape anomalies developed and the stable blocky anomalies rarely developed. The magnetic anomaly values range from -1 042 to 1 143 nT and the anomalies are mainly NE-SW trending. The strata and rocks are widely exposed, with the Jurassic volcanic rocks, the intermediate-acid magmatic rocks and the sporadical Archean. The above stratigraphic outcropping and magnetic features are because of the faulting and subsidence during the Jurassic, resulting in the increasing of the buried depths of magnetic basement, and the dropping of the regional magnetic field, and the Mesozoic volcanic eruption causing the largely and irregularly changing magnetic anomalies.
4.2 Analysis on typical aeromagnetic anomalies
4.2.1 Aeromagnetic anomaly C1
The aeromagnetic anomaly C1is located in the southwest of Zhangsanying--Tongshanzi aeromagnetic anomaly zone (Fig.2), and it is consistent with the position of Wuying magnetite deposit. The anomaly is long elliptic, with NE-SW trending, 2 820 m long and 930 m wide, the maximum value of 2 141 nT, and a clear negative anomaly accompanied in the northern side to this anomaly (Fig.3a). In order to study the source body causing the anomaly, the potential field conversion processing is carried out. By reduction to the pole (Fig.3b), the effect of oblique magnetization is basically eliminated, with the shape of the anomaly changing little, the position of the anomaly moving northward about 0.3 km, and the amplitude at the center of anomaly increasing about 30 nT. By the processing of residual anomaly and first vertical derivative(Figs.3c,d), the information from shallow magnetic body is highlighted, making the boundary of the anomaly more clear, which indicates the boundary of magnetic body. By the processing of upward continuation, the depth of the source body causing the anomaly can be understood roughly. For the upward continuation 3 km of reduction to the pole of aeromagnetic △T(Fig.3e), the strike of the anomaly can still be identified, but the range and outline of the anomaly become blurr, and the amplitudes of the anomaly decrease significantly. For the upward continuation 5 km of reduction to the pole of aeromagnetic △T(Fig.3f), the anomaly disappears completely. The above shows that the anomaly C1is caused by the shallow source’s magnetic body.
Based on the aeromagnetic data, we calculated the depths of the magnetic bodies causing the anomaly C1using the Euler deconvolution (Fig.4a). The result shows that the values of depth are mostly less than 1 km and partly less than 0.25 km, and deeper in the west (mostly deeper than 1 km) and shallower in the east (mostly less than 750 m).

(a) Map of aeromagnetic △T; (b) reduction to the pole of aeromagnetic △T; (c) residual anomaly of aeromagnetic △T; (d) the first vertical derivative of reduction to the pole of aeromagnetic △T; (e) upward continuation 3 km of reduction to the pole of aeromagnetic △T; (f) upward continuation 5 km of reduction to the pole of aeromagnetic △T. Fig.3 Aeromagnetic anomaly C1 and its conversion
From the geological environment (Fig.4b), the area corresponding with anomaly C1is more favorable for magnetite prospecting. The Neoproterozoic Dantazi Group and Shuangshanzi Group expose widely in this area, with the main lithology of amphibolite, gneiss, migmatite and magnetite quartzite, and there exists the Fengning--Longhua deep fault corresponding to the linear zone of high magnetic gradient in the northern side of the anomaly. Moreover, the Wuying iron deposit (magnetite) is being mined in the anomaly area (Fig.4c), with effective magnetization of (59 810--83 522) ×10-3A·m-1for the magnetite. By the forward fitting (Fig.4d), the anomaly C1is the response to the proven Wuying metamorphic magnetite bodies (② and ③ in Fig.4d) and the inferred and concealed magnetite body (④ in Fig.4d). The magnetic parameters of fitting profile are listed in Table 3. Moreover, the secondary anomaly to the north of the anomaly C1is also the response to the known magnetite body (① in Fig.3d).

(a) Depth by Euler deconvolution; (b) geological map; (c) photograph of iron deposit mined; (d) forward fitting profile to aeromagnetic data. The location of the forward fitting profile A-B in (d) is shown in Fig.3a. (a) and (b) are of the same range. Fig.4 Forward and inversion of aeromagnetic anomaly C1 and its corresponding magnetite deposit

Table 3 Magnetic parameters of forward fitting profile crossing anomaly C1
4.2.2 Aeromagnetic anomaly C3
The aeromagnetic anomaly C3is located in the southwest of the Zhangsanying--Tongshanzi aeromagnetic anomaly zone about 22 km from the anomaly C1(Fig.2). The anomaly appears ellipse (300 nT contour), with NW-SE trending, 4 800 m long and 2 400 m wide, the maximum value of 3 242 nT, the contours dense in the northeastern side and relatively sparse in the southwestern side, and an obvious negative anomaly exists in the northeastern side to this anomaly (Fig.5a). Through potential field conversion processing, the source body causing the anomaly can be further understood. By reduction to the pole (Fig.5b), the effect of oblique magnetization is basically eliminated, with the area of the anomaly becoming larger while its shape changing little, the position of the anomaly moving northward about 0.35 km, and the maximum value of anomaly increasing about 65 nT. By the processing of residual anomaly and the first vertical derivative (Figs. 5c, d), the boundary of the anomaly becomes clear, and the information reflecting the shallow magnetic body is highlighted. By the processing of upward continuation, the depth of the source body causing the anomaly was inferred. For the upward continuation 3 km of reduction to the pole of aeromagnetic △T(Fig.5e), the anomaly becomes vague except the strike of the anomaly, and the amplitudes of the anomaly decrease drastically. For the upward continuation 5 km of reduction to the pole of aeromagnetic △T(Fig.5f), the anomaly is not visible. Thus it can be deduced that the anomaly C3is caused by the shallow source’s magnetic body.
Based on the aeromagnetic data, the depths of the magnetic bodies causing the anomaly C3were calculated using the Euler deconvolution (Fig.6a). The result shows that the values of depth are mostly less than 0.25 km in the north and mostly between 0.5--1.0 km in the south, indicating that the magnetic body causing the anomaly C3is shallow, which is consistent with the qualitative interpretation of the prece-ding upward continuation.
The geological map corresponding with the ano-maly C3displays that there are widely distributed Neoproterozoic Dantazi Group outcrops (Fig.6b), with the main lithology of migmatite plagioclase amphibolite, plagioclase gneiss, granulite, and magnetite quartzite. The susceptibility is less than 3 000×10-5except magnetite quartzite which is greater than 10 000×10-5. The anomaly C3is adjacent to the Fengning--Longhua deep fault in the south, and to the Late Paleozoic granite body in the north. Field survey found that there are quartz-vein-type gold deposits being mined about 4 km southward and 5 km eastward from this anomaly. Thus it can be seen that this anomaly district is advantageous to magnetite prospecting.
In order to further study the magnetic body causing the anomaly C3, we arranged the ground magne-tic survey and electrical prospecting across the maximum value of aeromagnetic anomaly in the north (Fig.5a).
Fig.7a is the forward fitting profile to ground magnetic △Tfor surveying Line 1. The magnetic parameters of fitting profile are listed in Table 4. The curve of ground magnetic △Tis characterized by triplepeak. The left is relatively gentle, with the feature of crew cut and the extreme value of 5 241 nT. The fitting suggests that it is the response to the buried magnetite body and ultrabasic rock. The middle is high-gradient, with single spike and thigh magnetic △Tvalues, and the extremum being 17 150 nT. The fitting suggests that it is caused by the shallow-buried high-content magnetite bodies. The right is relatively narrow, with similar extreme value of magnetic △Tto the left, and the fitting suggests that it is the response to the buried magnetite body in ultrabasic rock. The above features indicate the occurrence of strong magnetic bodies with high content of magnetites, which should be the magmatic iron deposits formed by iron-bearing hydrothermal fluids intrusion and precipitation along the secondary faults.

(a) Map of aeromagnetic △T; (b) reduction to the pole of aeromagnetic △T; (c) residual anomaly of aeromagnetic △T; (d) the first vertical derivative of reduction to the pole of aeromagnetic △T; (e) upward continuation 3 km of reduction to the pole of aeromagnetic △T; (f) upward continuation 5 km of reduction to the pole of aeromagnetic △T. Fig.5 Aeromagnetic anomaly C3 and its conversion

Fig.6 Inversion of aeromagnetic anomaly C3 and its corresponding geological map
Fig.7b-d are the integrated geophysical profiles for ground survey Line 2. The curve of ground magnetic △Tis also characterized by triple-peak, with high gradient and high values of magnetic △T(Fig.7b). The extreme values of the left, the middle and the right are 8 261 nT, 13 326 nT and 8 729 nT respectively, suggesting that the three magnetic anomalies are caused by shallow-buried magnetite bodies with high content of different depths. Comparing the curve of ground magnetic △Twith the electrical curve for survey line 2 (Fig.7b-d), it shows that the positions of high magnetic anomalies are consistent with the low resistivity anomalies and high polarization anomalies, once again suggesting the strong magnetic bodies and their buried depths.
4.2.3 Aeromagnetic anomaly C7
The aeromagnetic anomaly C7is located in the middle of the Zhangsanying--Tongshanzi aeromagnetic anomaly zone, about 20 km from Longhua County (Fig.2). The anomaly is a local stacking anomaly in the high amplitude magnetic field, being irregular quadrilateral (620 nT contour), with near E-W trending, 3 200 m long and 2 300 m wide, and maximum value of 1 758.2 nT (Fig.8a). By reduction to the pole (Fig.8b), the effect of oblique magnetization is basically eliminated, with the shape of the anomaly changing greatly from irregular quadrilateral to semicircle, the position of the anomaly moving northward about 0.45 km, and the maximum value of anomaly increasing about 320 nT. By the processing of residual anomaly and first vertical derivative (Figs.8c,d), the information reflecting the shallow magnetic body is obviously strengthened, and the boundary of the anomaly becomes more clear. By the processing of upward continuation, we can roughly judge the depth of the magnetic body causing the anomaly. For the upward continuation 3 km of reduction to the pole of aeromagnetic △T(Fig.8e), the anomaly becomes unrecognizable. For the upward continuation 5 km of reduction to the pole of aeromagnetic △T(Fig.8f), the anomaly disappeared completely. From here we see that the anomaly C7is also caused by the shallow magnetic body.

(a) Forward fitting profile to magnetic △T of ground surveying Line 1; (b) curve of magnetic △T of ground surveying Line 2; (c) curve of IP central gradient method of ground surveying Line 2; (d) profile of ηs relative intensity by fixed-source sounding for ground surveying Line 2. Fig.7 Integrated geophysical profiles of ground surveying

Table 4 Magnetic parameters of forward fitting profile for ground surveying Line 1

(a) Map of aeromagnetic △T; (b) reduction to the pole of aeromagnetic △T; (c) residual anomaly of aeromagnetic △T; (d) first vertical derivative of reduction to the pole of aeromagnetic △T; (e) upward continuation 3 km of reduction to the pole of aeromagnetic △T; (f) upward continuation 5 km of reduction to the pole of aeromagnetic △T. Fig.8 Aeromagnetic anomaly C7 and its conversion
Based on the aeromagnetic data, we calculated the depths causing the anomaly C7using the Euler deconvolution (Fig.9a). The result shows that the depth values of the magnetic body are mostly less than 1 km and partly less than 0.5 km, indicating the magnetic body causing the anomaly C7being shallow, which is consistent with the interpretation from the upward continuation.
From the geological map corresponding with the C7anomaly, there exist Neoproterozoic Dantazi Group and Jurassic strata and intrusive rocks exposed widely (Fig.9b). The former comprises mainly of granulite (susceptibility of 427×10-5) and gneiss (susceptibility of 757×10-5), whereas the latter mainly consists of K-feldspar granite (susceptibility of 439×10-5), andesite (susceptibility of 852×10-5) and sandy shale (susceptibility of 21×10-5) in Dabeigou Formation. The anomaly center is located at the boundary among Neoproterozoic Dantazi Group, Jurassic K-feldspar granite and Dabeigou Formation, where there is a NNE-SSW trending large fault. During the field survey, we found a pit in which some vanadium-titanium-magnetite-bearing ultrabasic rocks were excavated (Fig.9c), with susceptibility of 62 800×10-5and magnetic remanence of 15 032×10-3A·m-1, containing iron, titanium and vanadium of 15%, 0.7% and 1.5%, respectively.

(a) Depth by Euler deconvolution; (b) geological map of anomaly C7: 1. Quaternary, 2. Upper Jurassic Dabeigou Formation; 3. Neoarchean Dantazi Group, 4. Upper Jurassic K-feldspar granite, 5. measured normal fault; (c) photograph of magnetite outcrop; (d) forward fitting profile to magnetic △T for ground surveying Line 3. Fig.9 Forward and inversion of aeromagnetic anomaly C7 and its corresponding magnetite outcrop
Fig.9d is the forward fitting profile of magnetic △Tfor ground surveying line 3 crossing the center of the anomaly C7. The magnetic △Tcurve is characterized by single-peak high amplitude. The magnetic parameters of fitting profile are listed in Table 5. The gradients of northwestern and southeastern sides of the primary curve are similar, being gradual to the background field in both sides, with the magnetic △Textreme value of 4 510 nT. The curve of reduction to the pole shows that the southeastern side of the anomaly is relatively steep accompanied by low-amplitude negative anomaly, and the northwestern side is relatively gentle and gradual to the background field. The result of the fitting profile suggests that the anomaly C7is caused by the buried ultrabasic rock and magnetite body dipping toward northwest. In addition, the secondary magnetic anomaly in the right suggests a small magnetite body in the ultrabasic rock.

Table 5 Magnetic parameters of inversion profile
4.3 Prospecting potential of iron deposits
From the geological environment, there are good structure-magma-hydrothermal assemblages for metallogenic conditions in the Zhangsanying--Tongshanzi aeromagnetic anomaly zone. Firstly, the tectonic movement was strong and frequent in the region, resulting in large number of faults and folds, etc., which provided structure condition such as magmatic intrusion and eruption channel, precipitation and metallogenic storage space, etc. Secondly, the metamorphic strata occurred widely in the zone (Fig.2), such as the Neoarchean medium-high-grade metamorphic rock series (Dantazi Group and Shuangshanzi Group) with lithology of plagioclase amphibolite, biotite-bearing plagioclase gneiss, granulite, leptynite, migmatite, and magnetite quartzite. The metamorphic rocks were rich in iron element which provided substance condition for mineralization. For example, the magnetite quartzite and sedimentary metamorphic magnetite are the typical iron ore occurring in the metamorphic strata. Thirdly, the magmatic activity was also strong and frequent in the zone, such as the Archean, Mesopro-terozoic, Late Paleozoic and Mesozoic hornblendite, Peridotite, gabbro, anorthitite, diorite, granodiorite, granite, syenite, monzonite, intermediate-basic volcanic rocks, intermediate-acid volcanic rocks, and so on. The magnetic activity provided the hydrothermal condition which promoted the migration and enrichment of iron element. For example, the vanadium-titanium magnetite is the magmatic iron ore which occurs in basic-ultrabasic intrusive rocks.
From the aeromagnetic anomalies, the Zhang-sanying--Tongshanzi aeromagnetic anomaly zone is composed of more than 10 magnetic anomalies with larger area and higher amplitude, which is superimposed on the positive magnetic background. The amplitudes of the local aeromagnetic anomalies are mostly more than 2 000 nT, and partly more than 3 000 nT. The measured physical properties data of rocks and ores show that the susceptibilities of the Neoarchean metamorphic rocks such as amphibolite, gneiss, granulite, leptynite, porphyritic magmatite (in Dantazi Group and Shuangshanzi Group) are (146--4 382)×10-5,with mean value of 942×10-5. The susceptibilities of the Mesoproterozoic carbonate rocks and clastic rocks are (3--49)×10-5, and the susceptibilities of the Mesozoic (Middle and Upper Jurassic) terrestrial volcanic-clastic rocks are (3--3 127)×10-5,with mean value of 658×10-5. Besides, the susceptibilities of the intrusive rocks such as the acid rocks, intermediate-acid rocks, intermediate rocks and basic rocks are 256, 572, 793 and 1 580×10-5, respectively. By comparative analysis, the above-mentioned rocks are unlikely to cause the high-amplitude aeromagnetic anomalies. However, the susceptibilities of the metamorphic magnetite quartzites and the magnetite are (8 230--139 260)×10-5, with mean value of 41 593×10-5, and the susceptibilities of the intrusive ultrabasic rocks are (792--6 779)×10-5, with mean value of 2 691×10-5. According to the above forward fitting, the high-amplitude aeromagnetic anomalies are caused by the magnetite quartzites, the magnetiteand the ultrabasic rocks.
In summary, there are good structure--magma--hydrothermal metallogenic conditions and high-amplitude aeromagnetic anomalies developed in Zhangsanying--Tongshanzi aeromagnetic anomaly zone. Thus, there is a great prospecting potential of iron deposit in this zone, and the high-amplitude aeromagnetic anomalies should be regarded as key prospecting target areas.
5 Conclusions
From the geological environment, there are favorable structure-magma-hydrothermal metallogenic conditions in the Zhangsanying--Tongshanzi aeromagnetic anomaly zone, which is one of the important aeromagnetic anomaly zones in northern Hebei. It is more than 160 km2, composed of more than 10 magnetic anomalies with larger area and higher amplitude. The forward fitting shows that the high-amplitude aeromagne-tic anomalies in the zone are mainly caused by the shallow magnetite deposits or ultrabasic rocks with magnetites. Accordingly, there is great prospecting potential of iron deposit in this zone, and the high-amplitude aeromagnetic anomalies should be regarded as the key prospecting target area.
The potential field conversion processing and forward-inversion methods adopted in this paper are very effective for the interpretation of aeromagnetic anomaly. The potential field conversion processing can be used for qualitative interpretation of aeromagnetic anomaly, and the forward-inversion methods such as the 2.5D optimization fitting and the Euler deconvolution, can be used for quantitative interpretation of aeromagnetic anomaly such as the calculation of depth and geometry of magnetic bodies.
The aeromagnetic survey can quickly identify the magnetic anomaly or magnetic anomaly zone with ore prospecting significance, and the integrated geophysical exploration on the ground can further verify the cause of the magnetic anomaly with timelines. Therefore, the air-land integrated survey is a quick and effective method for ore prospecting.
杂志排行

Global Geology的其它文章
- Joint inversion of magnetotelluric and fullwaveform seismic data based on alternating cross-gradient structural constraints
- Method for predicting cuttings transport using artificial neural networks in foam drilling
- Ore-controlling effect of structure and distribution of deep rock mass on Pb-Zn deposit in Qingchengzi ore concentration area,Liaoning
- Hydrothermal evolution and source of metallogenic materials of Beiya Au polymetallic deposit,western Yunnan, China
- Preparation and characterization of CaO-MgO-SiO2ceramics from silver mine tailings