Preparation and characterization of CaO-MgO-SiO2ceramics from silver mine tailings
2020-07-07HEQiangTANGZhenJIANGHaiyangPENGYijing1andZHANGPeiping
HE Qiang, TANG Zhen, JIANG Haiyang, PENG Yijing1,and ZHANG Peiping*
1. College of Earth Sciences, Jilin University, Changchun 130061, China;2. College of Materials Science and Engineering, Jilin University, Changchun 130025, China;3. The First Institute of Geology and Mineral Resources of Shandong Province, Ji’nan 250014, China
Abstract: Silver mine tailings are generated during the exploitation and extraction of silver. Immense amounts of silver mine tailings accumulated in the tailing ponds or backfilled in the mine have resulted in serious dust pollution and heavy metal pollution etc. In this study, ceramics were prepared by using the measure of one step sintering with the mixtures of silver mine tailings, talc and wollastonite, and the impact of silver mine tailings and wollastonite contents on the structure and properties of ceramics were investigated. Moreover, the phase, structure and morphology of ceramics were characterized by methods of XRD, FTIR and SEM. In addition, the apparent porosity, water absorption, volume density, flexural strength and coefficient of thermal expansion of ceramics were tested. The experimental results showed that the optimum performances of ceramics occurred when sintered at 1 200℃ and with raw material consisting of 50wt% of silver mine tailings, 20wt% of wollastonite and 30wt% of talc. The ceramics exhibited excellent properties, with flexural strength of 77.78±8.78 MPa, apparent porosity of (0.4±0.06)%, water absorption of (0.21±0.05)% and a bulk density of 1.93±0.02 g/cm3. A simple, efficient and economical preparation method of ceramics is presented in this article, which is an effective approach to value-added utilization of silver mine tailings.
Keywords: silver mine tailings; ceramics; preparation; characterization
0 Introduction
With the economic development, the living qua-lity of mankind has been improving and the demand for building materials has been increasing continuously. The natural resources used for building are limited and non-renewable. It’s necessary for us to seek suitable alternative materials to replace traditional building materials (Zhang, 2013; Novaisetal., 2015).
A large volume of solid wastes has been produced from industrial production, including tailing, fuel waste, chemical production and smelting waste. These wastes should be rationally utilized to avoid environment pollution and the wasting of resources. Tai-lings occupy a large proportion of industrial solid wastes. Silver mine tailings (SMTs) are produced during the refining of silver and there are a lot SMTs output each year. At present, large volume of SMTs accumulated in the tailing ponds or backfilled in the mine have led to the waste of space and dust pollution. Meanwhile, the SMTs contain certain amount of heavy metals, which may penetrate surrounding soil and groundwater after long-term accumulation. These problems threaten the health of people (Cetinetal., 2015; Liuetal., 2017), so the recycling of SMTs is an important issue.
In recent years, people have used the tailings to prepare cement, ceramics, and other composite materials, etc. (Lietal., 2013). In these applications, ceramics prepared by using mainly tailing brought higher economic benefits. Meanwhile, the pollution problems caused by tailings have been solved. Tai-lings of different compositions require different technical methods for preparing ceramics. In the past stu-dies, lithium porcelain tailings (Zhengetal., 2015), iron tailings (Meloetal., 2012), chrysotile asbestos tailing (Zhang, 2013), tungsten tailings, bauxite tailings, carbonaceous mudstone tailings, lead-zinc mine tailings (Liuetal., 2016), gold tailings (Yeetal., 2015), etc., have been investigated, but the comprehensive utilizations of SMTs have not been researched.
In the published studies, the two-step sintering method was usually used to prepare ceramics from the tailings. For example, Lietal. (2013) calcined the material for 4 h at 1 470℃, and then cooled it. In another study, the samples were heated at 720℃ for 2 h, and then heated at 800℃ to prepare ceramic with very good performance (Lay & Rockwel, 2009). But its longer firing time and higher temperature resulted in heavy burdens on energy and cost. In order to reduce energy consumption and cost, one-step sintering was used in this research. The ceramics were prepared from SMTs, talc and wollastonite. The properties and structures of ceramics with different contents of wollastonite and SMTs were investigated by XRD, FTIR, SEM, and the apparent porosity, water absorption, bulk density; thermal expansion coefficient and flexural strength were tested. The purpose of this study is to find a simple, efficient, affordable method for ceramics preparation using SMTs.
1 Preparation and characterization of ceramics
1.1 Raw materials and ceramics preparation
The SMTs used in the experiments came from Jilin Province, China. The chemical compositions of the SMTs tested by XRF arew(SiO2) 84.55%,w(Al2O3) 3.31%,w(Fe2O3) 1.57%,w(MgO) 0.54%,w(CaO) 5.28%,w(Na2O) 0.13%,w(K2O) 0.61% andw(LOI) 3.99%. The X-ray diffraction spectrum of SMTs is shown in Fig.1. According to the X-ray diffraction spectrum, the mineral compositions of SMTs are calculated as 80wt% quartz, 5wt% illite, 3wt% pyroxene, 8wt% calcite and 4wt% amphibole.
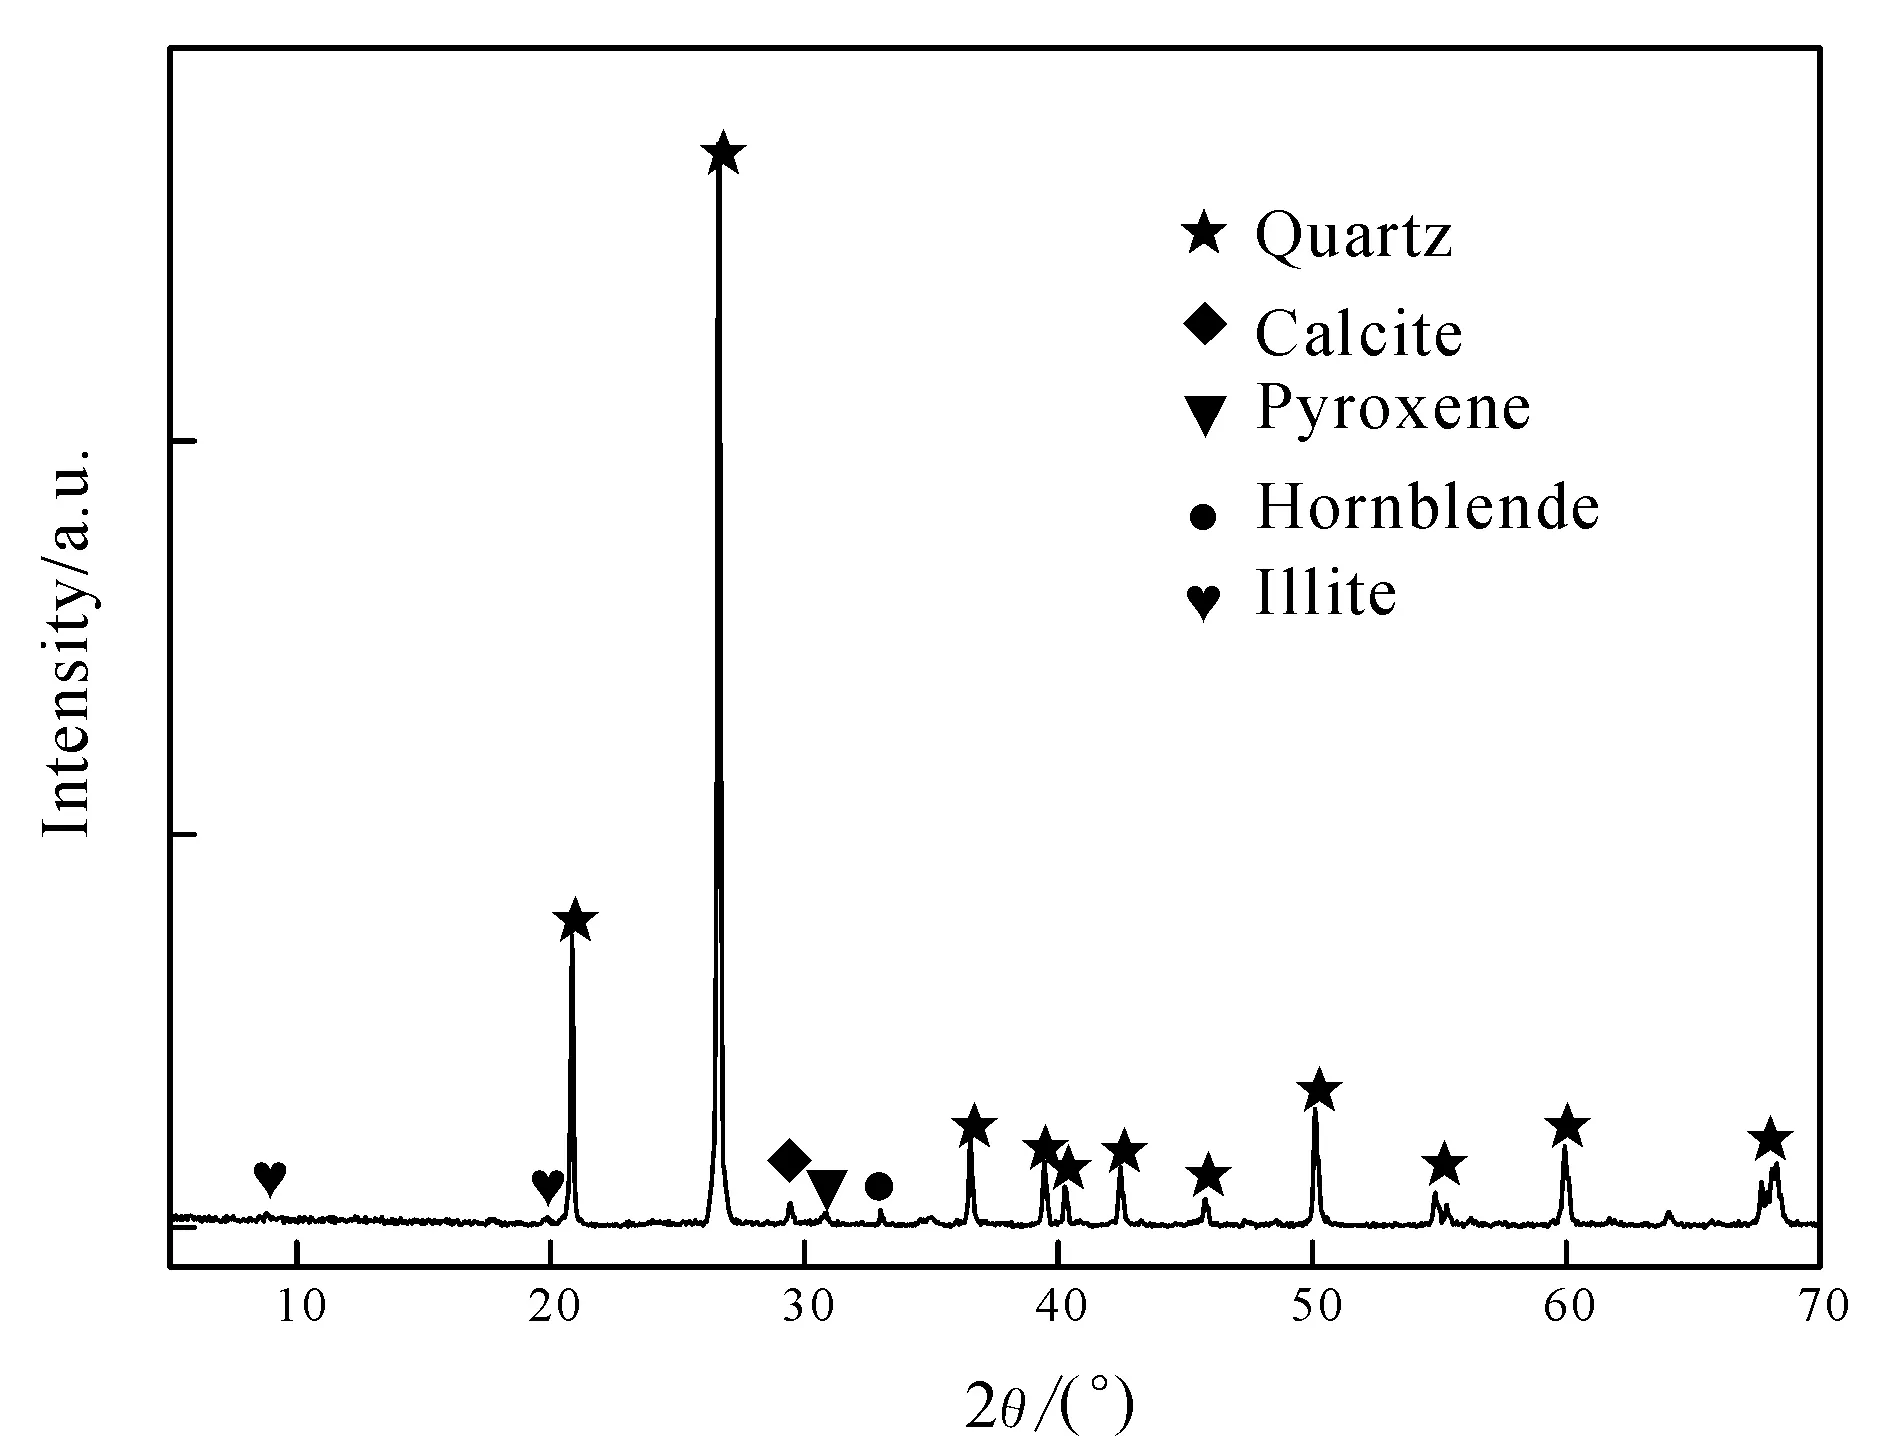
Fig.1 X-ray diffraction spectrum of SMTs
SMTs contain plenty of quartz. It is necessary to add other raw materials to produce certain amount of diopside in ceramics. Talc and wollastonite were used as magnesium source and calcium source respectively. Different mass incorporation (S1-S6: 65%, 60%, 55%, 50%, 45% and 40%) of SMTs in the formulation experiments were set up. The content of talc is always 30wt%, and the rest of the formulation is wollastonite. In accordance with the formula, the SMTs, wollastonite and talc were mixed by ball milling about 2 h. The mixtures were subsequently placed in 40 mm×10 mm mold and shaped under a pressure of 40 MPa, and then the samples were dried in an oven at a temperature of 120℃. Ten samples of each component ceramics were prepared. The temperature program of ceramic is shown in Fig.2.
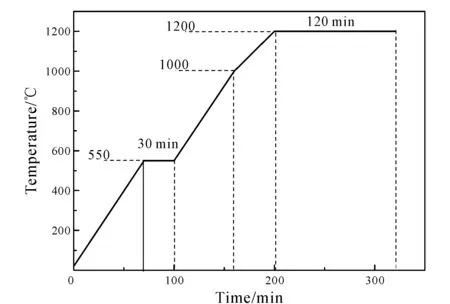
Fig.2 Temperature program of ceramics
1.2 Characterization techniques
Apparent porosity, water absorption and bulk density were tested by TXY-180 ceramic water tester with the processes of 10 min vacuum and 30 min soaking. The flexural strength of the ceramics was mea-sured using the method of three-point bending at a loading rate of 0.5 mm/min (MTS-810). The Netzsch DIL402C thermal dilatometer was used to measure the coefficient of thermal expansion of the ceramics. The test temperature ranged from 50℃ to 800℃ at a heating rate of 5℃/min. The phase compositions of ceramics was tested by Rigaku Dmax 2500, Japan X-ray diffractometer with a scan range of 5°--80°/2θ, a tube voltage of 50 kV, a current of 200 mA and a scan step width of 0.05 mm. KBr was used in the sample preparation process. The samples were tested by NICOLET760 USA Fourier transform infrared spectrometer with the wave number range of 400--4 000 cm-1.The SEM images of ceramics were captured by a Quanta-200 with accelerating voltage of 5 kV.
2 Results
2.1 Crystalline phase analysis
The XRD patterns of ceramics sintered at 1 200℃ with various contents of SMTs and wollastonite are shown in Fig.3. It can be seen that the crystalline phases of S1and S2 are cristobalite (SiO2). With the increase of wollastonite and decrease of SMTs, the intensity diffraction peaks of cristobalite (SiO2) became weaker and the diffraction peaks of diopside (CaMgSi2O6)appeared on S3. Meanwhile, the diffraction peaks of diopside gradually increased. Moreover, the diffraction peaks of quartz (SiO2)appeared on S5 and S6.
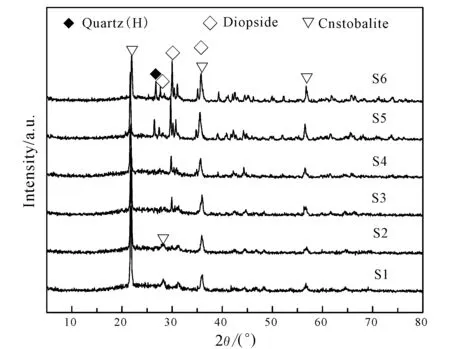
Fig.3 XRD patterns of ceramics
2.2 Fourier transform infrared spectroscopy testing
Fig.4 shows the FT-IR patterns of ceramics sintered at 1 200℃ with various contents of SMTs and wollastonite. It can be seen from Fig.4 that S1, S2 and S3 were mainly composed of quartz, and diopside began to appear in S4, quartz and diopside dominated in S5 and S6.

Fig.4 FT-IR patterns of ceramics
2.3 Physical properties and mechanical strength
Fig.5 illustrates the effect of SMTs and wollastonite contents on apparent porosity, percentage of contraction, volume density and water absorption of ceramics sintered at 1 200℃. The shrinkage ratio of S1 is (22.30±1.18)%. With the increase of wollastonite and decrease of SMTs, the shrinkage ratio increased to the maximum value (36.29±0.72)% (S4), then decreased to the minimum value (15.79±0.47)% (S6). On the contrary, the apparent porosity and water absorption of S1 is (11.31±0.23)% and (17.73±0.22)%. With the increase of wollastonite and decrease of SMTs, the apparent porosity and water absorption deceased to the minimum value (0.21±0.05)% (S4) and (0.4±0.06)%(S4), then the apparent porosity and water absorption increased to approximately 25% and 15%. The trends of bulk density and bulk shrinkage are roughly the same. The bulk density of S1 is 1.57±0.05 g/cm3. With the increase of wollastonite and decrease of SMTs, the bulk density increased to the maximum value 1.93±0.02 g/cm3(S4), and then bulk density decreased to approximately 1.6 g/cm3.
2.4 Flexural strength
Fig.6a shows the effect of SMTs and wollastonite contents on flexural strength of ceramics sintered at 1 200℃. Fig.6b shows the weibull analysis results of the flexural strength of ceramics. TheX-axis andY-axis are lnσband ln[1/(1-i/(n+1))] respectively, where the σbdenotes flexural strength,iis ranking number of ceramics for each composition,nrepresents the sum of ceramics for each composition.βdenotes Weibull modulus, which reflects the dispersion of material strength. Higher Weibull modulus represents smaller dispersion. The flexural strength of S1 is 38.72±5.09 MPa. With the increase of wollastonite and decrease of SMTs, the flexural strength increased to the maximum value 77.78±8.78 MPa (S4), and then the flexural strength decreased to approximately 46 MPa. Fig.6b shows a relatively good linearity, theβvalue is enough to improve that the all tested results are reliability.

(a) Porosity; (b) percentage of contraction; (c) volume density; (d) water absorption.Fig.5 Relation between properties of ceramics and content of SMTs
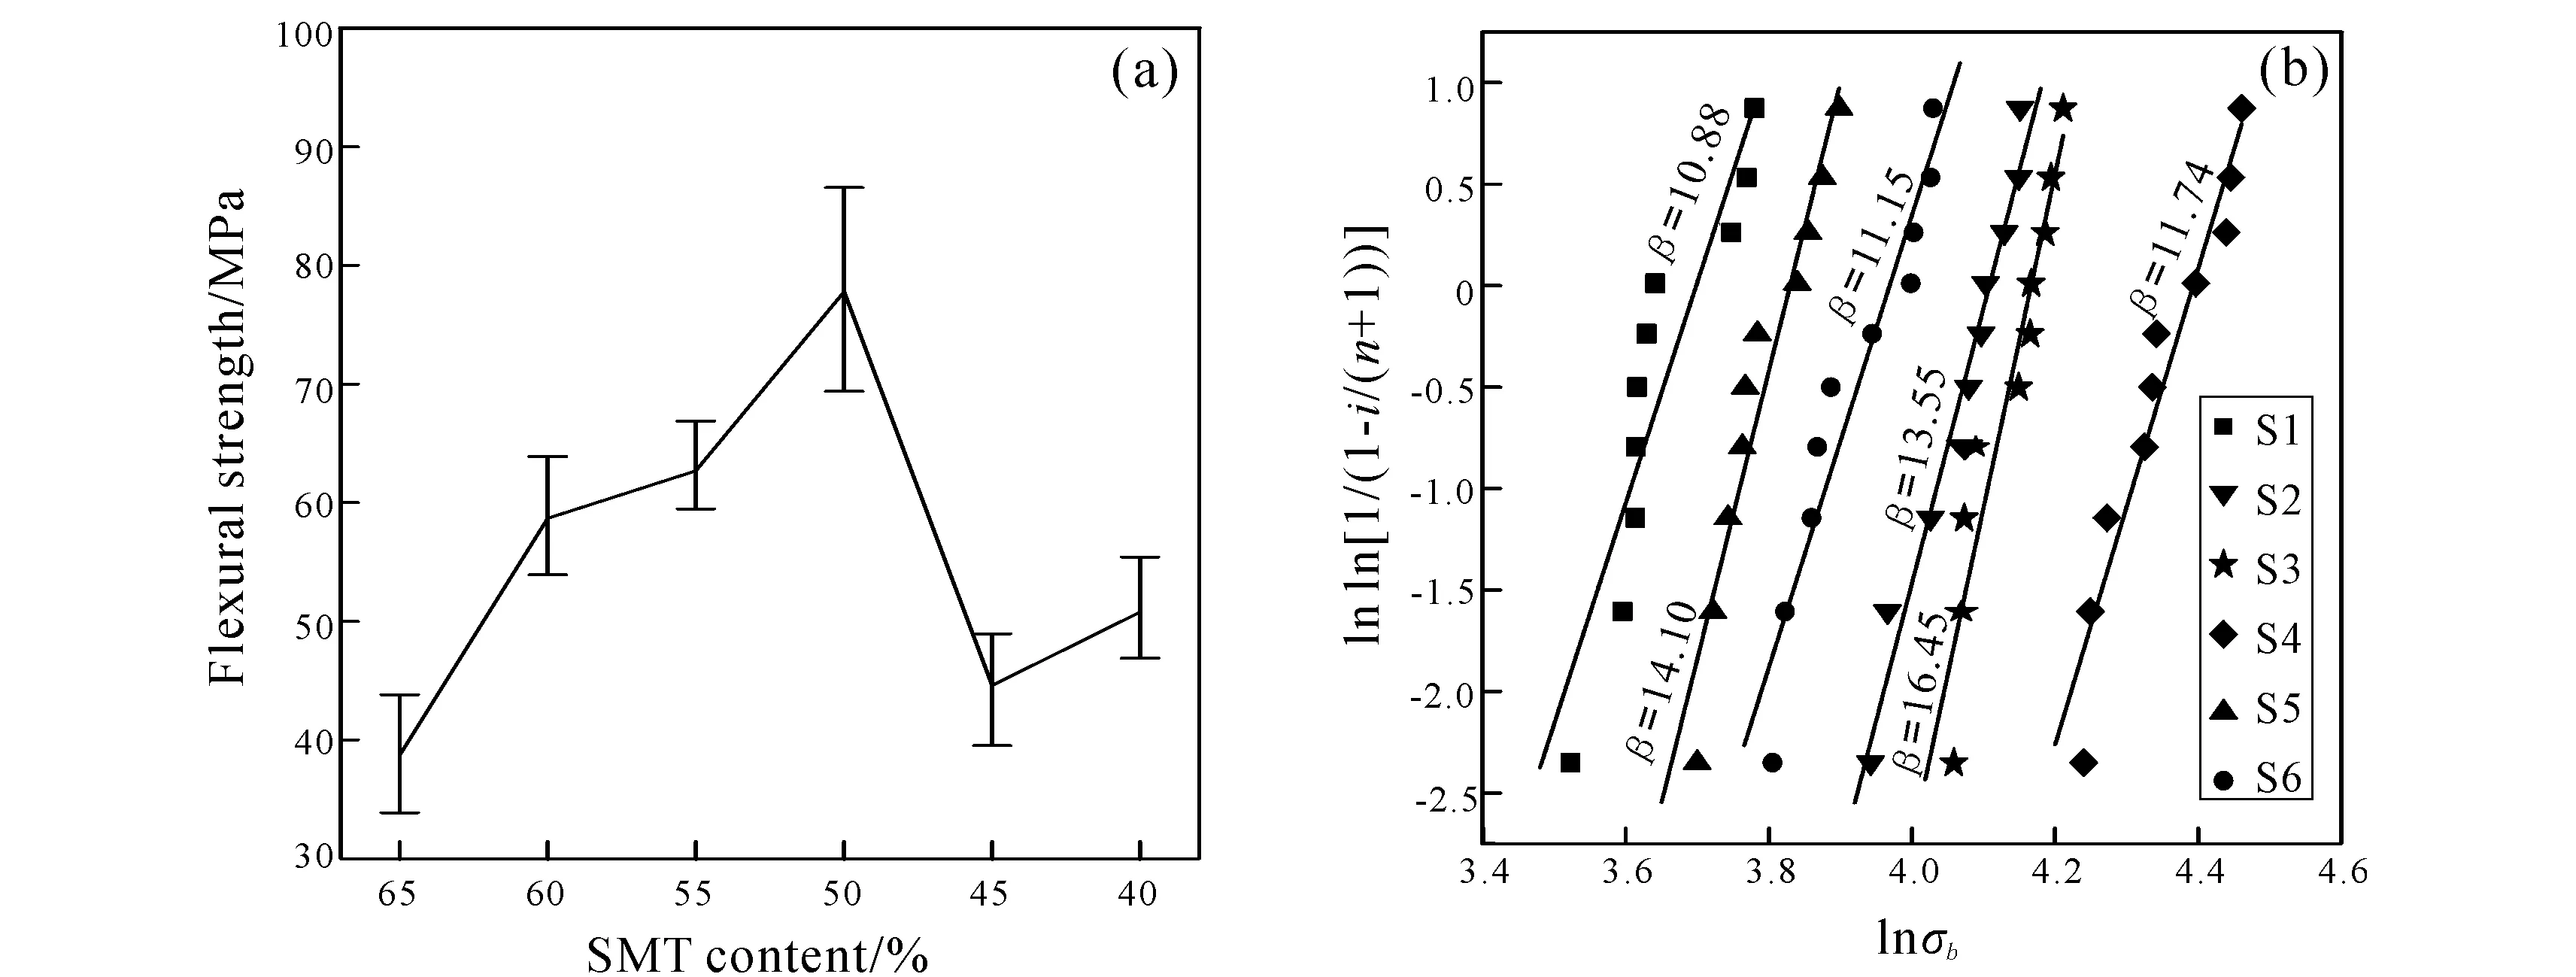
Fig.6 Flexural strength of ceramics
2.5 Coefficient of thermal expansion
Fig.7 presents the effect of contents of SMTs and wollastonite on the coefficient of thermal expansion of ceramics sintered at 1 200℃. It can be seen that the coefficient of thermal expansion generally decreases with the increase of wollastonite and decrease of SMTs. Moreover, the maximum value of the coefficient of thermal expansion appeared on 210℃.

Fig.7 Thermal expansions of ceramic
2.6 Morphology of ceramics

Fig.8 XRD patterns of ceramics sintered at different temperature
The effect of SMTs and wollastonite contents on the microstructure of the ceramics at 1 200℃ are showed in Fig.8. It can be seen from Fig.9 that there are many pores in S1 with diameters ranging from 2 μm to 10 μm. With the increase of incorporation percentage of SMTs and the content of wollastonite, the number of pores in S2 decreased and the diameter of pores decreased with diameter ranging from 1 μm to 8 μm. Compared with S2, there is a great reduction in the number of pores; the diameter of the pores varies from 3 μm to 6 μm in S3. The pores in the S4 almost disappeared. With the augment of the content of SMTs, and the increase of wollastonite content, a large number of pores appeared in S5 with the diameter ranging from 0.5 μm to 2 μm. Compared with S5, the diameter of pores became larger in S6, ranging from 1 μm to 4 μm.
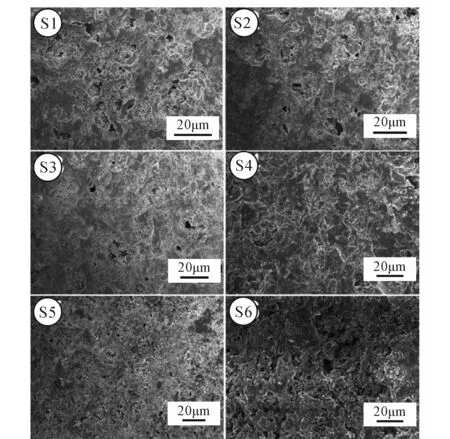
Fig.9 SEM pictures of ceramic
3 Discussion
3.1 Influence mechanism of wollastonite and SMTs contents on properties and structures of ceramic
Fig.9 is the SEM pictures of ceramic. There is a little wollastonite and a large content of SMTs in S1. SMTs contain CaCO3, which decomposed at high temperature, and the escape of CO2led to a large number of pores in the ceramic. The apparent porosity and water absorption of S1 are relatively high; the bulk density of S1 is relatively small. Meanwhile high porosity contributed to the low flexural strength. The main phase of S1 is cristobalite. Theβ-cristobalite converts into the cristobalite at about 200℃, which results in the expansion of volume. So the coefficient of thermal expansion of S1 increased to the maximum value at 210℃. Compared with S1, the content of cristobalite decreased in S2, thus the coefficient of thermal expansion decreased. Since the content of wollastonite increased and the content of SMTs decreased, the diopside and enstatite phases appeared in S3. This can increase the content of liquid phase at high temperature, and then fill the pore. Therefore, the apparent porosity and water absorption of ceramics decreased significantly, and the bulk density increased further. The coefficient of thermal expansion of diopside is relativity low, therefore the coefficient of thermal expansion decreased. Compared with the S3, S4 has more content of diopside and less content of cristobalite, so the apparent porosity and water absorption of ceramics decreased to the minimum value, whereas the bulk density and flexural strength increased to the maximum, and the coefficient of thermal expansion decreased further. The quartz phase appeared in S5 and S6. When the cristobalite converted to quartz, the crystal structure of SiO2converted from tetragonal crystal to hexagonal crystal in S5 and S6. It resulted in a lot of pores appearing on cera-mics. The increase of diopside can improve the flexural strength, but the existence of large number of pores play a dominant role on the flexural strength, so the bulk density and flexural strength of ceramics decreased drastically in S5 and S6 while the apparent porosity and water absorption of ceramics increased obviously. Moreover, owning to the increase of the content of diopside and the existence of pores, the coefficient of thermal expansion decreased.
3.2 Phase evolution during calcination
In order to investigate the phase variation during the calcined process, the XRD patterns of samples containing 30wt% talc, 20wt% wollastonite and 50wt% SMTs were sintered at different temperature and results are shown in Fig.8. It can be seen that the main ingredients of raw materials include α-quartz (SiO2), wollastonite (CaSiO3), Talc (Mg3(OH)2-Si4O10), and as the temperature increased, the intensity diffraction peaks of talc became weaker and subsequently stronger. The peaks of talc disappeared at 1 000℃, the anorthite (CaAl2Si2O8) appeared when the temperature reached 1 050℃:
CaSiO3+Al2O3+SiO2→CaAl2Si2O8
As the temperature increased from 1 050℃ to 1 150℃, the intensity diffraction peaks of wollastonite became weaker. When the temperature reached 1 200℃, the diopside phase appeared:
3CaAl2Si2O8+3MgO·4SiO2→3CaMgSi2O6+4SiO2+ 3Al2O3
3CaSiO3+3MgO·4SiO2→3CaMgSi2O6+ SiO2
Meanwhile, 2 h holding time provided enough time for the primary variants of SiO2to convert from trigonal quartz to cristobalite.
4 Conclusion
In conclusion, various contents of ceramics have been successfully prepared. With the increase of wollastonite and decrease of SMTs, diopside and enstatite appeared on S3 and S4 and enstatite disappeared on S5 and S6. The pores of ceramics decreased to the minimum value and then increased. Diopside and enstatite can increase the flexural strength; however, the existence of pores can decrease the flexural strength. The experimental results indicated that when the mass fractions of SMTs, wollastonite and talc are 50wt%, 20wt% and 30wt%, respectively, the final calcination temperature is 1 200℃, the ceramics exhibited superior properties owing to a certain amount of diopside and enstatite and barely existing pores. A new, economic and environment friendly preparation technology was proved, which can successfully solve the problems caused by SMTs.
杂志排行
Global Geology的其它文章
- Joint inversion of magnetotelluric and fullwaveform seismic data based on alternating cross-gradient structural constraints
- Method for predicting cuttings transport using artificial neural networks in foam drilling
- Characteristics of Zhangsanying—Tongshanzi aeromagnetic anomaly zone and prospecting potential of iron deposits in northern Hebei, China
- Ore-controlling effect of structure and distribution of deep rock mass on Pb-Zn deposit in Qingchengzi ore concentration area,Liaoning
- Hydrothermal evolution and source of metallogenic materials of Beiya Au polymetallic deposit,western Yunnan, China
