鲜枣中糖精的快速、无标签检测
2020-06-05吴昊邵菲郭小玉吴一萍杨海峰
吴昊 邵菲 郭小玉 吴一萍 杨海峰

Fund Project: The National Natural Science Foundation of China(21475088)
Biography: WU Hao(1990—),male,graduate student,research area:Raman application.E-mail:qingdaodaxueguzi@163.com;SHAO Fei(1995—),female,graduate student,research area:design of novel SERS substrates for detection application.E-mail:1446573055@qq.com
?Co-first authors:WU Hao carried out the preparation of materials,data acquisition and writing,SHAO Fei completed the characterization of part materials,detection of real sample and corresponding writing.These authors contributed equally to this work.
*Corresponding authors:WU Yiping(1987—),female,associate professor,research area:construction of Raman probe for biological and chemical applications.E-mail:yipingwu@shnu.edu.cn;YANG Haifeng(1968—),male,professor,research area:design of Raman detection strategies for biochemical application.E-mail:hfyang@shnu.edu.cn
引用格式: 吴昊,邵菲,郭小玉,等.鲜枣中糖精的快速、无标签检测 [J].上海师范大学学报(自然科学版),2020,49(2):121-133.
Citation format: WU H,SHAO F,GUO X Y,et al.Rapid and label-free detection of saccharin in fresh jujube fruit [J].Journal of Shanghai Normal University(Natural Sciences),2020,49(2):121-133.
Rapid and label-free detection of saccharin in fresh jujube fruit
WU Hao?, SHAO Fei?, GUO Xiaoyu, WU Yiping*, YANG Haifeng*
(College of Chemistry and Materials Science,Shanghai Normal University,Shanghai 200234,China)
Abstract: Saccharin is one of the oldest artificial sweeteners used in food industries because it has no calories.However,the abuse of saccharin is illegal.According to the National Standard of China,the maximum permitted level is 8.189×10⁻⁴mol·L-1in food.In this work,inositol hexakisphosphate(IP6) as protection agent was introduced to synthesize silver(Ag) nanoparticles(Ag NPs),designated as Ag NPs@IP6,and a rapid method based on surface-enhanced Raman scattering (SERS) was explored for the determination of saccharin in food products.The minimal detectable concentration for saccharin in water by using the optimal SERS assay was 50 nmol·L-1,which meets the requirement of National Food Safety Standard for tolerance level of food additives.This proposed Ag NPs@IP6-based SERS method with the portable Raman system could be implemented for on-site detection of saccharin in food such as fresh jujube fruit,a kind of Chinese date product.
Key words: saccharin; silver(Ag) nanoparticles(Ag NPs); surface-enhanced Raman scattering(SERS); rapid detection
CLC number: CLC number:O 614.24 Document code: A Article ID: 1000-5137(2020)02-0121-13
摘 要: 糖精是食品工业中最古老的人造甜味剂之一,因为没有卡路里而被廣泛使用,但其滥用是非法的,食品中最大允许添加量为8.189×10⁻⁴mol·L-1.介绍了以六磷酸肌醇(IP6)为保护剂合成的银(Ag)纳米粒子(Ag NPs),即Ag NPs@IP6,并提出了一种基于表面增强拉曼散射(SERS)的快速方法.探讨了食品中糖精的测定,用最佳SERS法测定水中糖精的最低可检测浓度可达50 nmol·L-1,符合食品添加剂耐受性水平的国家食品安全标准.提出了基于便携式拉曼的Ag NPs@IP6的SERS方法,可用于现场检测食品中的糖精,如新鲜枣果.
关键词: 糖精; 银(Ag)纳米粒子(Ag NPs); 表面增强拉曼散射光谱(SERS); 快速检测
1 Introduction
The abuse of the additives is a current problem in the field of food safety,which is a major issue of concern to the peoples healthcare[1].Saccharin is one of the oldest artificial sweeteners used in food industries because it has no calories.In the 1970s,PRICE et al[2] found that saccharin had close correlation with bladder cancer in rodents.Consequently,foods containing saccharin must be labeled with a warning to match the requirement of the “Saccharin Study and Labeling Act” of 1977.However,in the year 2000,due to some reports exploring the different rodents cellular microenvironment,involving high pH,high calcium phosphate,and high protein levels[3-4],from human situation,the United States removed the warning labels from the external packing of food containing saccharin.Next,some researches showed saccharin might give rise to the release of insulin in humans and rats,which has not been confirmed by the later control studies[5-7].In 2012,Qin[8-9]found the close relationship between inflammatory bowel disease and the intake amount of saccharin,meaning that the saccharin is health risk for human as food additives.In China,the acceptable daily intake (ADI) value of the saccharin is in the range from 8.189×10⁻⁴to 2.729×10⁻² mol·L-1for different foods.Thereupon,even if it remains controversy over the safety for saccharin as the food additive,some methods to detect saccharin have been developed.WANG et al[10]proposed a competitive enzyme-linked immunosorbent assay to determine the sodium saccharin in food samples.This immunosorbent method showed an excellent specificity for sodium saccharin with the limit of detection (LOD) of 1.146×10⁻⁸mol·L-1by the diazo-reaction,but it needed more than 1.5 h for a whole test process and even 12 h in a preparatory process.Bergamo et al[11]demonstrated an accurate analytical technique for simultaneous determination of different artificial sweeteners by using capillary electrophoresis with capacitively coupled contactless conductivity with the 30 kV separation voltages and 450 kHz operating condition,but it was not easy to actualize an on-site strategy.GREMBECKA et al[12] reported a HPLC-CAD-UV/DAD protocol to analyze the mixture of artificial sweeteners with the LOD less than 3×10⁻⁶ mol·L-1and relative standard deviation (RSD) less than 2% but it has to perform the tedious pre-treatments,control exorbitant operating conditions,and require large-sized instrument.Therefore,it is necessary to explore some fast approaches for pre-screening in food on field or market.
The surface-enhanced Raman scattering(SERS) technique has become one of the most potential spectroscopic tools for label-free determination of the metal ions,bio-analytes or food additives[13-16],due to its extraordinary capability for signal enhancement and inherent narrow width of Raman peak.The amplified Raman intensities could be attributed to the contributions of electromagnetic (EM) field enhancement[17-18]and chemical enhancement (CE)[19].With the huge electromagnetic field from “hot spots” between neighbor noble metal nanoparticles by laser inducing[20],Raman signal for some especial molecules could be dramatically elevated even down to single molecule level[21-22].The additional merits of SERS technique such as rapidness,no interference by water,and simple pre-treatment of sample have aroused great interests of many analysts in various disciplines.As above-mentioned,SERS-based methods have lots of applications in life science[23-25],biotherapy[26],and chemical analysis[27].Also,SERS spectroscopy provides fingerprint vibrational information of molecule moieties adsorbed on a metallic surface,bringing an intrinsic selectivity.It is perspective that with the development of reasonably active and stable SERS substrates,Raman spectroscopy will play the key role in quality control application for goods and foods.
According to our previous work[28-30],inositol hexakisphosphate (IP6) as a naturally non-toxic substance,which has the strong interaction with metallic ions,could be used to synthesize and stabilize the SERS substrates.In this work,tuning the ratio of IP6and AgNO3amounts for obtaining silver(Ag)nanoparticles (Ag NPs) (designated as Ag NPs@IP6)with optimal sensitivity was explored.Herein,we proposed the Ag NPs@IP6-based SERS method to determine saccharin in the food product of fresh jujube fruit.The lowest detectable concentration for saccharin was 50 nmol·L-1,which meets the requirement of National Food Safety Standard for tolerance level of food additives.This SERS protocol with good reproducibility can be employed for on-market monitoring the food quality by using the portable Raman system.
2 Materials and methods
2.1 Chemicals and materials
Silver nitrate (AgNO3),sodium salt of IP6and saccharin 98% (mass fraction) were obtained from Sigma-Aldrich (USA).Crystal violet,perchloric acid,acetic anhydride,sodium hydroxide(NaOH),Rhodamine 6G (R6G),hydroxyl-ammonium chloride (NH2OH·HCl) and acetic acid were purchased from Sinopharm Chemical Reagent (Shanghai,China).Ethanol was obtained from Shanghai Titan Scientific Co.,Ltd.Raw fresh jujube fruit (Raw-J) was purchased from a local supermarket,and retail jujube fruit (Retail-J) was bought from a local agricultural trade market.All reagents were of analytical grade and used without further purification.Deionized water (18 MΩ·cm) was produced using a Millipore water purification system.
The SERS experiment was carried after the mixture totally dried at the condition of 20 ℃ and 60% relative humidity.
2.4 Titration determination of saccharin
According to suggestion by the National Standard of China,the titration method was a routine technique to analyze the saccharin in foods.In detail,the sample containing saccharin was added into the 20 mL of acetic acid and 5 mL of acetic anhydride.Then,two drops of crystal violet (1.23×10⁻²mol·L-1) were injected as an indicator.Finally,the above solution was titrated by 0.1 mol·L-1of perchloric acid until the color of the solution turned cyan and the experiment was repeated for three times.
3 Results and discussion
3.1 Preparation and characterizations of Ag NPs@IP6
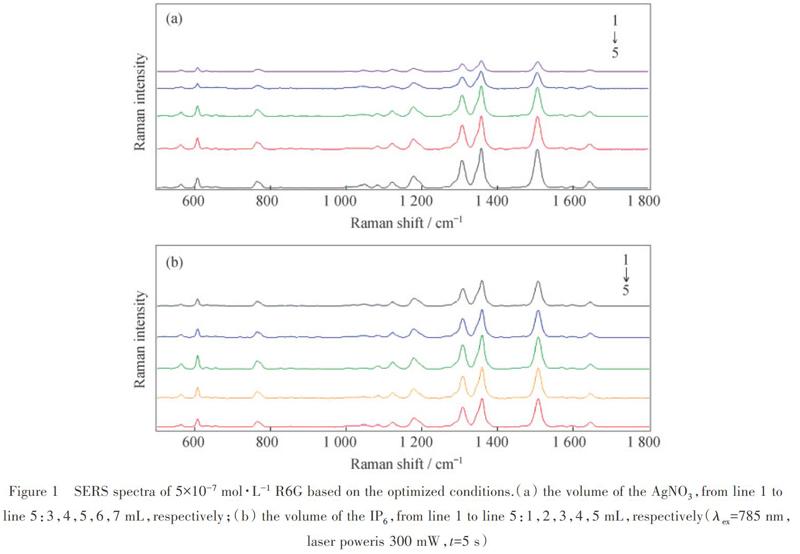
Silver substrates have their inherent surface plasmon resonance (SPR) phenomenon to enhance the Raman scattering of adsorbed species,and the enhancement factor is related to their geometry[32-33],chemical composition[34],and size distribution[35].In this work,silver nanoparticles were picked out as SERS substrates to carry out the detection of saccharin residue on the surface of foods because of Raman signal-enhancing peculiarity of Ag NPs[36].Unfortunately,silver nanoparticles are unstable under ambient condition.Normally,the citrate salt was used as reducing agent to obtain Ag NPs and citrate salt residue on the Ag NPs resulted in the Raman spectroscopic interference to the trace detection.We used NH2OH·HCl with no Raman activity as the reduction reagent to prepare Ag NPs.IP6molecules were introduced into the synthesis procedure to stabilize Ag NPs for real application requirement.Interestingly,tuning the ratio of AgNO3and IP6,the as-obtained Ag NPs@IP6products showed different SERS effects (R6G as Raman probe).As shown in figure 1(a),Raman intensity of R6G rises with the increase of the dosage of AgNO3.However,the stability of Ag NPs becomes worse and results in a serious aggregation in the case of amount of AgNO3increased from 5.0 to 7.0 mL.As a result,the optimal volume of 1×10⁻²mol·L-1AgNO3solution is fixed at 5.0 mL.Additionally,the usage of IP6is also carefully examined for the long-term stability of Ag NPs.As shown in figure 1(b),3.0 mL of 1.0×10⁻³mol·L-1IP6may be the best one for constructing SERS substrate.The excessive amount of IP6will increase the thickness of IP6at the surface of Ag NPs,which suppresses the Raman signals of target sample.

Figure 1 SERS spectra of 5×10⁻⁷mol·L-1R6G based on the optimized conditions.(a) the volume of the AgNO3,from line 1 to line 5:3,4,5,6,7 mL,respectively;(b) the volume of the IP6,from line 1 to line 5:1,2,3,4,5 mL,respectively(λex=785 nm,laser poweris 300 mW,t=5 s)
Figure 2 depicts the TEM images of the Ag NPs and Ag NPs@IP6.It is found that their average diameters are around 50 nm.The thickness of IP6shell for Ag NPs@IP6 is about 6±2 nm.In figure 2(e),the SPR bands for Ag NPs and Ag NPs@IP6are observed at 403 nm and 408 nm,respectively.Closely investigating the TEM image in figure 3 shows that the gap between Ag NPs @IP6is less than 10 nm and the distribution of Ag NPs@IP6exhibits more uniform than that of Ag NPs,which agrees with the narrow band in SPR spectrum of Ag NPs@IP6.
3.2 The SERS performance
For the evaluation of the SERS effects of the Ag NPs@IP6 and Ag NPs,1.0×10-7mol·L-1R6G solution was used as the Raman probe.It was found from figure 4 that the SERS signal of R6G from Ag NPs@IP6is stronger than that from Ag NPs.The enhancement should arise from “hot-spot” formation via Ag NPs@IP6bridging each other.In figure 5(a),in case of R6G,the lowest detectable concentration could be down to 1.0×10⁻⁹mol·L-1.As a consequence,the Ag NPs@IP6 colloid is regarded as a promising substrate to elevate the SERS sensitivity for analyzing saccharin in real samples.
The stability of the as-made Ag NPs@IP6was also monitored by the time-dependent SERS experiments.The statistical results as column diagrams in comparison with Ag NPs are given in figure 5(b).Obviously,with a storage time within 3 weeks,as compared with the original signal intensity from newly prepared substrate,the SERS signal of Ag NPs@IP6 could keep about 90% even under ambient condition (20 ℃ and 60% relative humidity) and it exhibits a long-term stability,which is beneficial to the real application.
Figure 2 TEM images of (a),(b)Ag NPs and (c),(d) Ag NPs@IP6with different scales,and corresponding (e) UV-vis absorption spectra
Figure 3 The TEM image of Ag NPs@IP6with large magnification
Figure 4 SERS spectra of 1×10⁻⁷mol·L-1R6G mixed with different substrates:Ag NPs@IP6(blue curve) and Ag NPs (red curve)
Figure 5 SERS spectra of various concentrations of R6G and the stability of Ag NPs@IP6and Ag NPs.(a) SERS spectra (1-5) of R6G at different concentrations of 1×10-5,1×10-6,1×10-7,1×10-8,and 1×10⁻⁹mol·L-1,acquired from Ag NPs@IP6and spectrum 6 is acquired from blank Ag NPs @IP6(λex=785 nm,laser poweris 300 mW,t=5 s);(b) Column diagrams of normalized intensity ratio (I/I0) of R6G signals recorded on novel prepared substrates (Ag NPs (green color) or Ag NPs@IP6(red color)) and after different storage time (error bar:each datum was acquired by repeating 6 times)
3.3 Detection of saccharin with portable Raman system
For the interpretation of the SERS bands,normal Raman spectrum of powder saccharin and SERS spectrum of saccharin (5.0×10⁻⁴mol·L-1) together with the structure formula were given in figure 6.Clearly,the diversities between normal Raman spectrum of solid saccharinand SERS spectrum could be due to the saccharin molecules adsorbed onto the surface of Ag NPs@IP6.According to the calculation based on B3LYP/LANL2DZ level,the assignments to main vibration bands of saccharin were tabulated in table 1.SERS peak at 779 cm-1is attributed toνas(C-S-N) andνs(C-C) and a band at 1 175 cm-1could be due toδ(C-C-H) andρ(N-H).SERS band at 1 287 cm-1belongs to co-contributions ofρ(C-H) andν(C-N-O).The strongest characteristic band at 1 385 cm-1in SERS spectrum is from the asymmetric stretching modes of O=S=O group while it is a very weak band in normal Raman spectrum.This indicates that the saccharin molecules are anchored on the Ag NPs@IP6surface via lone pairs of oxygen atom.
Figure 6 SERS spectrum of 5×10⁻⁴mol·L-1saccharin adsorbed on Ag NPs@IP6(blue color) and normal Raman spectrum of solid saccharin (red color) (λex=785 nm,laser power is 300 mW,t=5 s)
As shown in figure 7,concentration dependent SERS spectra of saccharin in the aqueous solution are recorded with the Ag NPs@IP6 substrates.The linear relationship was plotted by the intensities of the Raman band at 1 385 cm-1versus the varying concentrations of saccharin in the range from 1.0×10⁻⁴to 1.0×10⁻³mol·L-1.The SERS substrate of blank Ag NPs@IP6was also recorded with no interference on the spectrum of target molecule (figure 8).The error bars given by six independent measurements are for the indication of the standard deviation.The lowest detectable concentration reaches 5.0×10⁻⁸mol·L-1,indicating that this optimized Ag NPs@IP6-based SERS method could be performed for a practical analysis.
Figure 7 SERS spectra of various concentraction of saccharin and calibration plot based on Raman intensity at 1 385 cm-1.(a) SERS spectra of saccharin obtained from Ag NPs@IP6(the concentration of saccharin from top to bottom:5×10-2,5×10-3,5×10-4,5×10-5,5×10-6,5×10-7,5×10⁻⁸,and 5×10⁻⁹mol·L-1,respectively);(b) SERS intensities at 1 385 cm-1versus the different concentrations of saccharin(inset is the linear relationship between SERS intensity and the concentration ranging from 1.0×10⁻⁴to 1.0×10⁻³mol·L-1in aqueous solution,λex=785 nm,laser power is 300 mW,t=5 s)
Figure 8 SERS spectrum of Ag NPs@IP6 without saccharin
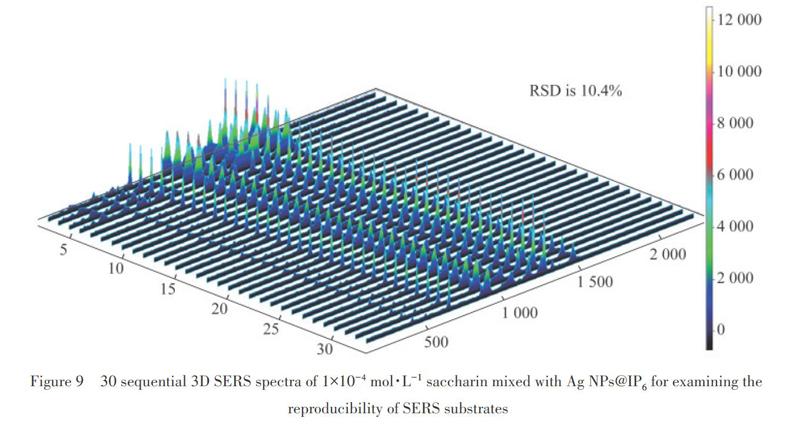
The investigation of SERS reproducibility of saccharin on the Ag NPs@IP6was given in figure 9 and the RSD is about 10.4%.The RSD value of Ag NPs@IP6is less than 20.0%,remarking the good reproducibility[37]of such Ag NPs@IP6substrates.
3.4 Detection of saccharin in real sample
The SERS-based protocol to determine saccharin might have interference of food matrix,such as acesulfame potassium,sucrose and so on.Especially,in food production process,acesulfame potassium is routinely mixed with saccharin to offer sweeter tastes by some enterprises[38].Herein,SERS spectra of saccharin,acesulfame potassium,sorbitol,sucrose,and glucose together with the mixture of above 5 species were recorded,which were shown in figure 10.It is confirmed that the characteristic Raman band of saccharin at 1 385 cm-1without interfering could be distinguished from the others.
Figure 9 30 sequential 3D SERS spectra of 1×10⁻⁴mol·L-1saccharin mixed with Ag NPs@IP6for examining thereproducibility of SERS substrates
Figure 10 SERS spectra of (a) mixture of 5 species,(b) saccharin,(c) acesulfame potassium,(d) sorbitol,(e) sucrose and (f) glucose
Pitifully in news report,some fresh jujube fruits were added with excessive saccharin by bad vendors to obtain illegal economic benefits.For conducting SERS detection,the pre-treatment approach for sample has an important process[39-42].We used 20%(volume fraction)ethanol aqueous solution to extract the raw jujubes(Raw-J),the retail jujubes(Retail-J),and the spiked jujubes (Spiked-J).All of the SERS signals were recorded from the ethanol extract solution after they were mixed with Ag NPs@IP6substrates.In figure 11(line 1),no obvious Raman signal from the extract solution of Raw-J is visible,while in figure 11(line 2),the Raman spectrum of the extract solution from Spiked-J shows the characteristic bands of saccharin.The SERS spectrum of the extract from Retail-J presents the characteristic bands at 779 and 1 385 cm-1of saccharin as shown in figure 11(line 3),meaning that Retail-J might be added by saccharin.We also tested the same sample of Retail-J according to the titration method recommended by GB 4578-2008.As demonstrated in table 2,the results obtained by the titration method are not exactly same as those from the SERS method,but the SERS results are still in acceptable values,especially for quick on-market analysis with the help of the portable Raman system.
Figure 11 Ag NPs@IP6-based SERS spectra of the Raw-J(line 1,green),the Spiked-J(line 2,red) and the Retail-J(line 3,blue)extract solutions (λex=785 nm,laser power is 300 mW,t=5 s)
Through preparing an optimal Ag NPs@IP6with an IP6shell of around 6 nm in thickness,the Ag NPs@IP6-based SERS approach for the rapid determination of saccharin in fresh jujube fruit was developed.The Ag NPs@IP6showed a much stronger Raman scattering enhancement factor and long-term stability.The lowest detectable concentration of saccharin down to 50 nmol·L-1was achieved.For real application,by using the ethanol solution,after a facile pre-treatment method was done to extract the saccharin from the food products,the SERS test could be conducted.Although the SERS result had about 25% RSD in comparison with the result from the titration method recommended by the National Standard of China,as a perspective,this Ag NPs@IP6-based SERS approach with the aid of portable Raman spectrometer could realize rapid,sensitive and on-site detection of saccharin for food quality control.
References:
[1] JACKSON L S.Chemical food safety issues in the United States:past,present,and future [J].Journal of Agricultural and Food Chemistry,2009,57(18):8161?????-8170.
[2] PRICE J M,BIAVA C G,OSER B L,et al.Bladder tumors in rats fed cyclohexylamine or high doses of a mixture of cyclamate and saccharin [J].Science,1970,167(3921):1131-1132.
[3] WHYSNER J,WILLIAMS G M.Saccharin mechanistic data and risk assessment:urine composition,enhanced cell proliferation,and tumor promotion [J].Pharmacology and Therapeutics,1996,71(1/2):225-252.
[4] DYBING E.Development and implementation of the IPCS conceptual framework for evaluating mode of action of chemical carcinogens [J].Toxicology,2002,181/182(1/2/3):121-125.
[5] JUST T,PAU H W,ENGEL U,et al.Cephalic phase insulin release in healthy humans after taste stimulation? [J].Appetite,2008(3)51:622-627.
[6] IONESCU E,ROHNER-JEANRENAUD F,PROIETTO J,et al.Taste-induced changes in plasma insulin and glucose turnover in lean and genetically obese rats [J].Diabetes,1988,37(6):773-779.
[7] BERTHOUD H R,TRIMBLE E R,SIEGEL E G,et al.Cephalic-phase insulin secretion in normal and pancreatic islet-transplanted rats [J].American Journal of Physiology,1980,238(4):E336-E340.
[19] ALBRECHT M G,CREIGHTON J A.Anomalously intense Raman spectra of pyridine at a silver electrode [J].Journal of the American Chemical Society,1977,99(15):5215-5217.
[20] WANG Y,YAN B,CHEN L.SERS tags:novel optical nanoprobes for bioanalysis [J].Chemical Review,2013,113(3):1391-1428.
[21] NIE S M,EMORY S R.Probing single molecules and single nanoparticles by surface-enhanced Raman scattering [J].Science,1997,275(5303):1102-1106.
[22] KNEIPP K,WANG Y,KNEIPP H,et al.Single molecule detection using surface-enhanced Raman scattering (SERS) [J].Physical Review Letters,1997,78(9):1667-1670.
[23] LIU T Y,TSAI K T,WANG,H H,et al.Functionalized arrays of Raman-enhancing nanoparticles for capture and culture-free analysis of bacteria in human blood [J].Nature Communication,2011,2:538-545.
[24] LI Y T,LI D W,CAO Y,et al.Label-free in-situ monitoring of protein tyrosine nitration in blood by surface-enhanced Raman spectroscopy [J].Biosensors & Bioelectronics,2015,69:1-7.
[25] QIAN X,PENG X H,ANSARI D O,et al.In vivotumor targeting and spectroscopic detection with surface-enhanced Raman nanoparticle tags [J].Nature Biotechnology,2008,26(1):83-90.
[26] MOHS A M,MANCINI M C,SINGHAL S,et al.Hand-held spectroscopic device forin vivoand intraoperative tumor detection:contrast enhancement,detection sensitivity,and tissue penetration [J].Analytical Chemistry,2010,82(21):9058-9065.
[27] WILLETS K A,VAN DUYNE R P.Localized surface plasmon resonance spectroscopy and sensing [J].Annual Review of Physical Chemistry,2007,58(1):267-297.
[28] WANG N,YANG H F,ZHU X,et al.Synthesis of anti-aggregation silver nanoparticles based on inositol hexakisphosphoric micelles for a stable surface enhanced Raman scattering substrate [J].Nanotechnology,2009,20(31):315603.
[29] FOX C H,EBERL M.Phytic acid (IP6),novel broad spectrum anti-neoplastic agent:a systematic review [J].Complementary Therapies in Medicine,2002,10(4):229-234.
[30] LIU J R,GUO Y N,HUANG W D.Study on the corrosion resistance of phytic acid conversion coating for magnesium alloys [J].Surface & Coatings Technology,2006,201(3/4):1536-1541.
[31] LEOPOLD N,LENDL B.A new method for fast preparation of highly surface-enhanced Raman scattering (SERS) active silver colloids at room temperature by reduction of silver nitrate with hydroxylamine hydrochloride [J].Journal of Physical Chemistry B,2003,107(24):5723-5727.
[32] RODRIGUEZ L L,ALVAREZ P R A,PASTORIZA S I,et al.Zeptomol detection through controlled ultrasensitive surface-enhanced Raman scattering [J].Journal of the American Chemical Society,2009,131(13):4616-1618.
[33] HUANG X,EL-SAYED I H,QIAN W,et al.Cancer cell imaging and photothermal therapy in the near-infrared region by using gold nanorods [J].Journal of the American Chemical Society,2006,128(6):2115-2120.
[34] LIU B H,HAN G M,ZHANG Z P,et al.Shell thickness-dependent Raman enhancement for rapid identification and detection of pesticide residues at fruit peels [J].Analytical Chemistry,2012,84:255-261.
[35] LINK S,EL-SAYED M A.Size and temperature dependence of the plasmon absorption of colloidal gold nanoparticles [J].Jouranl of Physical Chemistry B,1999,103(21):4212-4217.
[36] ABALDE-CELA S,ALDEANUEVA-POTEL P,MATEO-MATEO C,et al.Surface-enhanced Raman scattering biomedical applications of plasmonic colloidal particles [J].Journal of the Royal Society Interface,2010,7(4):S435-S450.
[37] SANTOS E D B,SIGOLI F A,MAZALI I O.Surface-enhanced Raman scattering of 4-aminobenzenethiol on silver nanoparticles substrate [J].Vibratioanl Spectroscopy,2013,68:246-250.
[38] ALLEN A L,MCGEARY J E,KNOPIK V S,et al.Bitterness of the non-nutritive sweetener acesulfame potassium varies with polymorphisms in TAS2R9 and TAS2R31 [J].Chemical Senses,2013,38(5):379-389.
[39] ZHANG H,ZHAI S D,LI Y M,et al.Effect of different sample pretreatment methods on the concentrations of excitatory amino acids in cerebrospinal fluid determined by high-performance liquid chromatography [J].Journal of Chromatography B,2003,784(1):131-135.
[40] GONG W B,LIU C,MU X D,et al.Hydrogen peroxide-assisted sodium carbonate pretreatment for the enhancement of enzymatic saccharification of cornstover [J].ACS Sustainable Chemistry and Engineering,2015,3(12):3477-3485.
[41] LIU H,PANG B,WANG H S,et al.Optimization of alkaline sulfite pretreatment and comparative study with sodium hydroxide pretreatment for improving enzymatic digestibility of corn stover [J].Journal of Agricultural and Food Chemistry,2015,63(12):3229-3234.
[42] ZHANG H D,WU S B.Efficient sugar release by acetic acid ethanol-based organosolv pretreatment and enzymatic saccharification [J].Journal of Agricultural and Food Chemistry,2014,62(48):11681-11687.
(責任编辑:郁 慧,顾浩然)
