Mapping the risk of winter storm damage using GIS-based fuzzy logic
2020-05-19AbdullahAkaynancTas
Abdullah E. Akay · I˙nanc¸ Tas¸
Abstract Abiotic and biotic factors that cause damage toforest trees also threaten the sustainability of forest resources. Although winter storms can be one of the most damaging forces, very few studies have focused on winter storm damage in Turkey. To prevent or minimize storm damage, we must evaluate the factors that influence the degree of damage and develop storm risk maps for the forested areas. Here, a GIS-based mathematical model(fuzzy logic) was used to develop such a risk map by considering risk factors such as tree species, tree age,crown density, site quality, topographical features (elevation,slope,aspect),climatic variables(wind,precipitation),and soil depth. The Alabarda Forest Enterprise Chief within the borders of Tavs¸anl1 Forest Enterprise Directorate was selected as the study area due to high occurrence of storm damage in the region during winter 2015-2016.For model verification, the risk map of storm damage was compared to the actual areal distribution of storm damage reported by the Enterprise Directorate.The model based on fuzzy logic indicated that slightly more than half of the study area (52.49%) was under very low storm damage risk,28.12%was under low risk and 19.19%was classified as high risk. A very small portion of the total study area was classified as very high risk. These results indicated a close relation with the storm damage map generated using Tavs¸anl1 FED records. The results revealed that the most effective risk predictors for overall storm damage risk were wind direction and speed, followed by slope and site quality factors.
Keywords Fuzzy logic · GIS · Risk map · Storm damage
Introduction
As one of the most important natural resources, forests have vital functions such as sustaining biodiversity, preserving soil, and protecting water (Akbulak and özdemir 2008). To maintain these functions, we need to plan and manage forests by considering social, economic, ecological,and sociocultural factors(Wilkie et al.2003).The most impactful abiotic factors such as forest fires,winter storms,avalanches, and droughts can cause serious biological and ecological damage toforest vegetation and thus threaten sustainability of forest resources (Teich and Bebi 2009).
Although winter storms can be the most detrimental abiotic factors in many regions of the world, including Turkey, few studies have assessed winter storm damage in Turkey. Previous studies generally focused on the relation between winter storm damage and biological agents such as insects and fungi, the types of storm damage, effects of stand characteristics on the damage level,and techniques to prevent winter storm damage. Tree breaks and falls are typically the most common type of damage; fir trees with shallow root system are most prone to tree falls,while tree breaks are mostly observed in black pines and yellow pines stands (ünal et al. 2007).
To prevent or minimize winter storm damage, we need to thoroughly evaluate the factors that influence the damage and develop a risk map of storm damage, especially for forested areas with a high storm risk. In the present study, after considering storm damage factors and storm damage prediction methods, we developed a risk map of winter storm damage using a GIS-based mathematical model.The model considered common risk factors such as tree species, tree age, crown density, site quality,topographical features (elevation, slope, aspect), climatic parameters (wind, precipitation), and soil depth. Finally,the risk map of storm damage was compared to the actual areal distribution of storm damage reported by the local Enterprise Directorate to verify the model.
Winter storm risk factors
Coniferous species are more sensitive to winter storms comparing with deciduous trees (Atay 1990; Foster and Boose 1995). Deciduous trees are more resistant to storm damage because their wood is relatively stronger and root systems grow deeper.Storm damage risk may also increase by tree age,and mature stands with root rot and other stem defects are more prone to winter storm damage (Moore 2000). Stands with high crown density are sensitive to winter storm because there is limited space for crowns and roots (Mitchell 2000). The trees at the edge of the stands protect the trees with weak root system in dense stands.There is also a close relationship between winter storm damage and site quality (Harris 1989). When stand age is constant,the stands with high site quality are more sensitive to winter storms (Peltola and Kellomaki 1993). In some studies, the ratio of tree height and tree diameter has been used as a risk indicator for winter storm damage;as this ratio increases,winter storm damage increases(Jull 2001).
Winter storm damage is also affected by topographical features such as elevation,slope,and aspect(Mitchell et al.2001; Kramer et al. 2001). Schmoeckel and Kottmeler(2008) found that storm damage is low at lower elevations(i.e.,<150 m a.s.l.)and increases up to a certain elevation(i.e., 1000 m a.s.l.). Trees at higher elevations are more resistant to winter storm damage since they are always exposed to winter storm and other environmental factors.Schütz et al. (2006) indicated that there is an inverse relationship between storm damage and ground slope;winter storm damage is highest on slopes of 20-30% and decreases on steeper slopes. In terms of aspect, stands on northwest, north, and southeast aspects have higher risk of storm damage risks (Schmoeckel and Kottmeler 2008).
The wind speed and direction are the most important climatic variables that influence winter storm damage on forest trees.Winds at speeds of 54 km h-1and more likely to cause serious storm damage.If the storm continues for a long time, more tree roots are damaged, and winter storm hazards increase. Snow and frost with wind increases the load on the tree crown and reduces stem elasticity, which increases storm damage (Lanquaye 1999). In areas that receive continual, strong precipitation before the storm,soil loosening causes tree falls in particular (C¸anakç1oğlu 1993).Snow melt which generates wet soil also contributes to tree falls during winter storms.
Soil type itself also plays an important role on winter storm damage. When ground water is high in shallow,loose soils,storm damage incidents are more frequent.Soil that is wet from rainfall before the storm also increases the risk of storm damage (Atay 1990). The resistance of the tree roots to the storm is greater in loamy forest soils than in clay soils that roots cannot hold(Coutts 1983).Based on the information obtained from previous studies on storm damage, the following risk factors were considered in this study: tree species, tree age, crown density, site quality,elevation,slope,aspect,wind,precipitation,and soil depth.
Predictive methods for winter storm damage
The observational, mechanical, and empirical methods commonly used to predict winter storm damage:(Lanquaye 1999) consider winter storm factors to determine the magnitude of the damage and the level of damage risk.The risk of winter storm damage increases as the number of risk factors increase in observational method (Stathers et al. 1994). In this method, storm damage indicators include asymmetric root system,irregular crown growth,and root rots.
In mechanical methods,winter storm damage is predicted based on critical wind speed level and the probability of s storm.This method is used to determine storm damage risk in different regions of forested areas and to develop specific strategies for each region (Talkkari et al. 2000). The empirical method predicts storm damage in a sample area based on the risk factors.Fridman and Valinger(1998)used a logistic regression model to predict winter storm and snow damage on a sample stand by considering tree species,stand structures,and site conditions.
GIS techniques that have been effectively used in many fields can also be used to analyze winter storm damage by integrating with empirical models (Moore and Somerville 1998;Lekes and Dandul 2000;Akay et al.2017).Common GIS programs such as ArcGIS, Idrisi, Erdas, and MapCalc can be used to analyze spatial data considering various decision variables. These programs can develop suitability models in which decision variables with different criteria and values are associated by using multi-criteria decision making (MCDM) methods. The fuzzy logic method is a common MCDM method used for GIS-based classification in the field of natural resources management (Ayd1n and Eker 2012). Fuzzy logic method provides the optimum solution for complex problems by eliminating uncertainties for maximum and minimum values of decision variables.
Materials and methods
Study area
The study area in Alabarda FEC in the Tavşanl1 FED on the border of the Kütahya Forest Regional Directorate(Fig. 1) was dominated by Pinus nigra, Pinus brutia,Quercus species and other deciduous species. The average elevation was 900 m a.s.l. and slope was 25%. In winter 2015 in Alabarda FEC about 200,000 m3of timber was serious damaged in a winter storm (Fig. 2). According tofEC records, it took about 2 years (2015-2016) to extract damaged timber from the forest land.
GIS database
To produce digital data layers for storm damage risk factors, we generated a GIS database using ArcGIS 10.4.1(Esri, Redlands, CA, USA). Necessary data layers including stand maps and topographical maps with contour lines were obtained from the Tavs¸anl1 FED. The stand map was used to produce data layers representing stand characteristics (i.e., tree species, tree age, crown closure, and site quality). A contour line map, generated based on topographical maps, was used to produce a digital elevation model(DEM),then slope and aspect layers were generated based on the DEM. The data layers representing climatic parameters (i.e., wind and precipitation) were also produced based on climatic data provided by three meteorology stations in the provinces of Tavs¸anl1, Emet, and Gümüs¸yeniköy. The soil map indicating soil depth was generated based on geology maps of the study area from the General Directorate of Mineral Research and Exploration.The digital data were stored as raster layers at 10×10 m resolution.
Classification of risk factors
The wind storm risk map was generated for the forested land within the border of the Alabarda Forest Enterprise Chief by considering storm damage risk factors. In the process, specified risk factors were regrouped into several classes: stand characteristics (tree species, tree age, crown density, site quality), topographical features (elevation,slope, aspect), climatic parameters (wind, precipitation),and soil depth.
Stand characteristics
Based on the stand-type map of the Alabarda FEC,the tree species factor was divided into eight classes, starting from the deciduous tree species with the highest resistance to storm damage to the tree species with the lowest resistance(Table 1). The stands in the study area were divided into six 10-year age classes. Forested lands were also divided intofour crown density classes and six site quality classes;storm damage risk generally increases as crown density and site quality increase (Peltola and Kellomaki 1993;Mitchell 2000).
Topographical features
The elevation map was reclassified intofive classes by 200-m intervals (Table 2). The studies reported that storm damage risk generally increases up to 1000 m, while the risk tends to reduce on higher elevations (Schmoeckel and Kottmeler 2008).Then the slope map was classified into 10 classes by 10% intervals. In addition, damage risk increases with an increase in slope from 0 to 30%,then gradually decreases on slopes over 30%(Schütz et al.2006).Finally,the aspect map was divided into 10 classes based on the data from previous studies(Wern and Bärring 2009;Ulfves 2015).

Fig. 1 Study area in the Tavs¸anl1 FED on the border of the Kütahya Forest Regional Directorate in Turkey
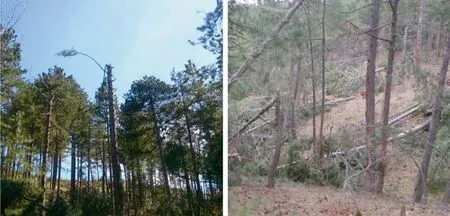
Fig. 2 Typical tree breaks and tree falls after winter storm in 2015-2016 in the study area

Table 1 The classifications of stand characteristics

Table 2 Classification of topographical features
Climatic parameters
Wind data were obtained from the nearest meteorological station in Tavs¸anl1 Province. Considering the major risk factors wind directions and wind speed (maximum wind speed at each direction),the wind data layer was generated based on aspect data and divided into 10 classes(Table 3).A precipitation map was then generated based on the data from the Eskis¸ehir Regional Directorate of Meteorology.The risk of storm damage increases as the amount of precipitation increases.
Soil depth
The soil depth data layer was generated using the geology map from the General Directorate of Mineral Research and Exploration. The soils in the study area were divided intofour soil depth classes: shallow, low, medium, and deep.Storm damage risk increases as soil depth decreases.
Rating and weighting the risk factors
After classifying the risk factors,each class was assigned a storm damage risk rate from 1 to 10 based on the data obtained from the related literatures; 1 represents the lowest damage risk, 10 represents the highest risk). Each class was rated with maximum and minimum values to ensure flexibility in decision-making. To state specific values, especially in suitability models, that can be expressed verbally but cannot be presented mathematically,expert knowledge and literature-based expressions such as‘‘bad’’,‘‘good’’,‘‘fair’’,‘‘weak’’etc.should be transformed into real numbers (ESM103 1981). To integrate those values into the GIS-based mathematical model (fuzzy logic),four risk rates(RR)were defined for the risk factors that are assigned as decision variables in the objective function(Table 4).The average risk rates were determined using maximum and minimum values, then these average risk rates were weighted to develop functions for the risk factors.
After assigning ratings for subclasses of the main decision variables, the arithmetic mean of the maximum and the minimum rate was calculated and the weights of each decision variables were determined using a proportional relation among totals (rank-sum procedure) (ESM103 1981; öztürk and Batuk 2011; Gülci and Akay 2015). The assigned values in each class of storm damage risk factors were transformed into rate numbers then to percentages by calculating regression functions using Excel (Microsoft,Redmond, WA, USA). Equation 1, which has the highest R2value,was used in the objective function(Eastman et al.1995).

In Eq. 1, y represents RR, x represents rates as shown Table 4,and n is the number of rates(n = 10).This process provides better visual quality of model in the ArcGIS environment (Gülci and Akay 2015). The data layers representing the risk factors in the GIS data set were then reclassified by considering RR values in percentages(Table 5). During classification, the Reclassify tool (Reclass by ASCII File) in the Spatial Analysis extension was used in ARCGIS 10.4.1 software.
GIS-based storm damage risk model
GIS-based mathematical models are powerful tools tofind optimal solutions for complex problems that require evaluation of many factors.Integrating advanced mathematical methods such as fuzzy logic with GIS provides promising results for spatial suitability models (Chang 2004). In the present study, fuzzy logic was employed to eliminate uncertainties between maximum and minimum values ofstorm damage risk factors and therefore for the most realistic estimate of risk.
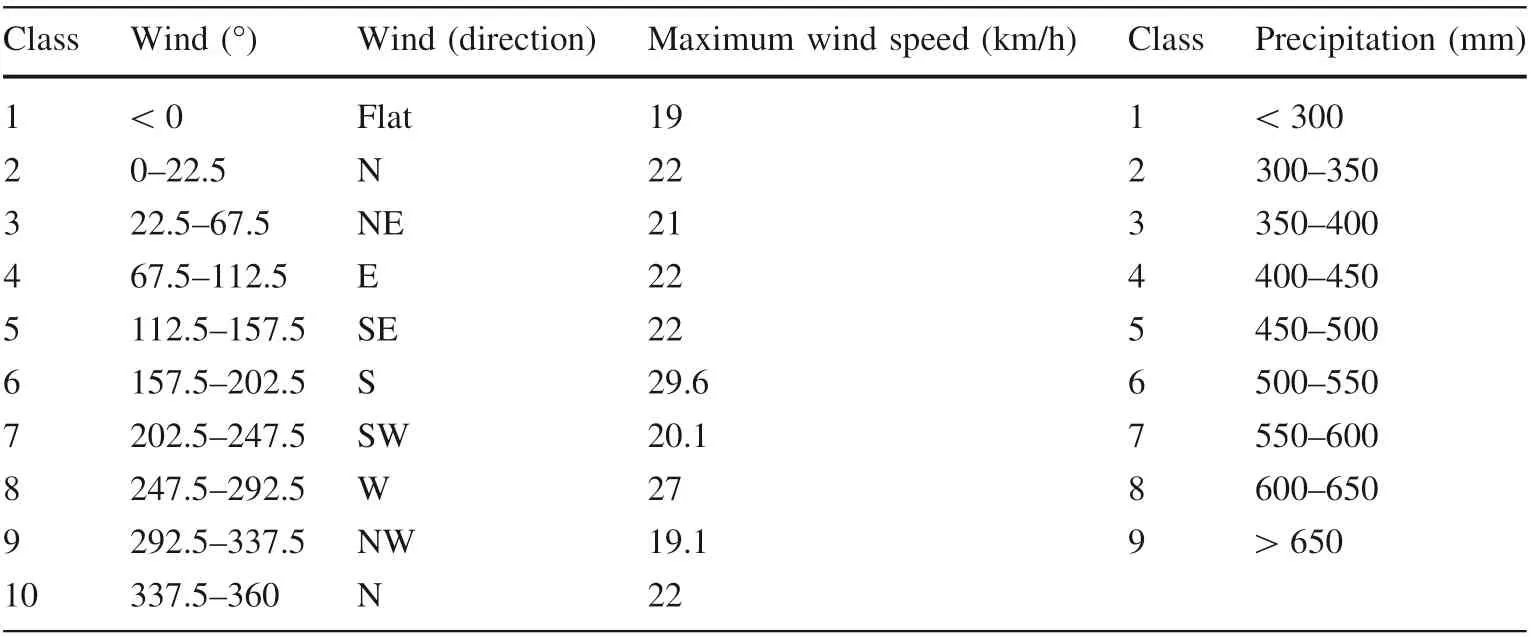
Table 3 Classification of climatic parameters

Table 4 Rating table of the decision variables used in objective function
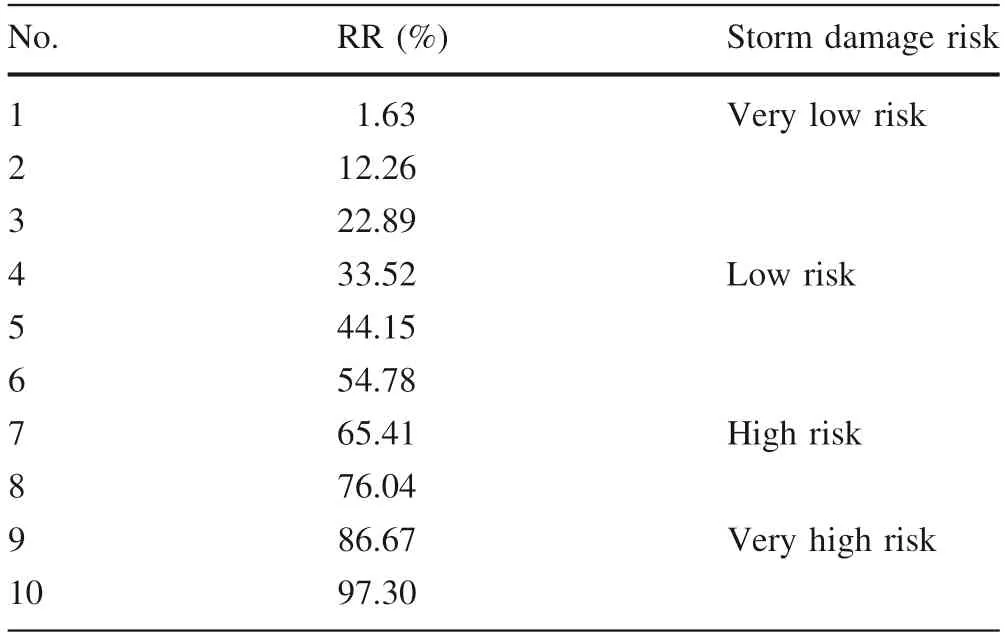
Table 5 Risk rates in percentages
Fuzzy logic membership
In the fuzzy logic membership approach, the main component is fuzzy clusters that are defined by membership functions(Sasilka et al.2004).This approach,in which the memberships are defined as number of pairs between 0 and 1, expresses a series of continuous functions such as ‘‘optimum, near optimum, true, near true, near false, false’’instead of certain clustering logic such as ‘‘yes, no, exist,not exist, true, false’’ (Brooks et al. 2010). Fuzzy logic memberships are divided into the following graphical functions based on the field of target application: linear,large, small, near, Gaussian, and Cauchy.
GIS tools such as ArcGIS software can be used to evaluate membership of the decision variables between 0 and 1 within the fuzzy logic (Yanar and Akyürek 2003;ESRI 2017). In the present study, the Fuzzy Membership tool in the Spatial Analyst extension of ArcGIS 10.4.1 was used to reclassify digital data for the storm damage risk factors from 0 to 1 based on the probability of membership in a specified cluster.Values with no probability of being a member of the fuzzy cluster, were assigned a value of 0,but if all data were members of the cluster, and 1 was assigned to values that were definitely members. Data between these two possibilities were assigned probabilities of membership between 0 and 1. The membership values for storm damage risk factors were determined based on seven fuzzy logic membership types including Gaussian,Small,Large,Near,MS small,MS large,and Linear(ESRI 2017).
Defuzzification of fuzzy memberships
Defuzzification can be defined as the process of converting a fuzzified output into a single crisp value by overlaying the membership values using various defuzzification methods.Mamdani(1976)developed rules that allow fuzzy logic to evaluate the variables with fuzzy expressions.Today, various methods are used in the defuzzification process.In this study,the Fuzzy Overlay tool in the Spatial Analyst extension of ArcGIS 10.4.1 was used to develop a risk map of storm damage. In the solution process, five common defuzzification methods were evaluated including AND,OR,PRODUCT, SUM,and GAMMA(ESRI 2017).
Accuracy assessment of risk map
The accuracy of the storm damage risk map by evaluating the areal distribution of the storm damage reported by the Tavs¸anl1 FED in winter 2015-2016. Actual storm damage map was generated based on the volume of the salvage timber extracted from unit area (hectare) at each forest compartment. A new field was added to the attribute table of the stand-type map to indicate the amount of salvage timber extracted per hectare (m3ha-1) from the compartments. The storm damage map was then produced by reclassifying the amount of salvage timber intofour classes (Table 6). Finally, the risk map of storm damage developed using the GIS-based mathematical model was compared to the actual storm damage map for verification.
Results
Weighted values of risk factors
Once the data layers representing the storm damage risk factors were reclassified into the GIS environment, the average risk rates were determined using maximum and minimum values of the risk rates,then average values were weighted to develop functions for the risk factors(Tables 7, 8, 9, 10). Finally, the data layers of the risk factors were reclassified again based on the weighted percentages of the risk rates.

Table 6 Storm damage classes based on salvage timber extracted from unit area
Fuzzy memberships of GIS-based model
To reclassify weighted values of risk factors using the Fuzzy Membership tool, the Large membership type was used for tree species,age range,crown density,site quality,and soil depth factors because the larger input values were more likely to be a member of the fuzzy cluster (Fig. 3).For elevation, slope, aspect, and wind factors, the Near membership type was preferred since fuzzy members were near a specific value (Fig. 4). Since there was a linear relationship between fuzzy membership of precipitation and elevation, the Linear membership type was preferred for the precipitation factor.
Risk map of storm damage
A risk map of winter storm damage was generated by using GIS based mathematical model considering stand characteristics,topographical features,climatic parameters,and soil depth(Fig. 5).The memberships of the risk factors were defuzzified by using ‘‘Fuzzy Overlay’’ tool under Spatial Analyst extension of ArcGIS 10.4.1. Among alternative defuzzification methods, GAMMA method,which is an algebraic product of PRODUCT and SUM methods, was used in defuzzification stage.
The risk map of storm damage indicated that risk was very low at more than half of the study area while about 30% was classified as low risk areas (Table 11). On the other hand,about 20%of the study area was under the risk of storm damage and very small percentage was classified as very risky areas.In order to verify the risk map of storm damage,actual storm damage map was developed based on the areal distribution of storm damage reported by the Tavs¸anl1 FED in winter 2015(Fig. 6). According to actual storm damage map, storm damage was very low at less than half of the area while 30% was subject to low storm damage (Table 12). It was alsofound that storm damage was at high level in about 24%of the area while very small part was subject to very high storm damage.
Discussion
Storm damage risk factors
The relative effects of risk factors on total storm damage risk were determined using computing weighted values of the risk factors based on average values of risk rates of each class of the risk factors (Table 13). The results indicated that the most effective factor on storm damage risk was wind, followed by slope and site quality factors.Similar studies alsofound that wind direction and wind speed are the most important climatic parameters influencing storm damage of forest trees (Lanquaye 1999). In the next section,the effect of each factor on storm damage risk is evaluated and the results compared to those of previous studies.

Table 7 Weighted values for stand characteristics

Table 8 Weighted values for topographical features
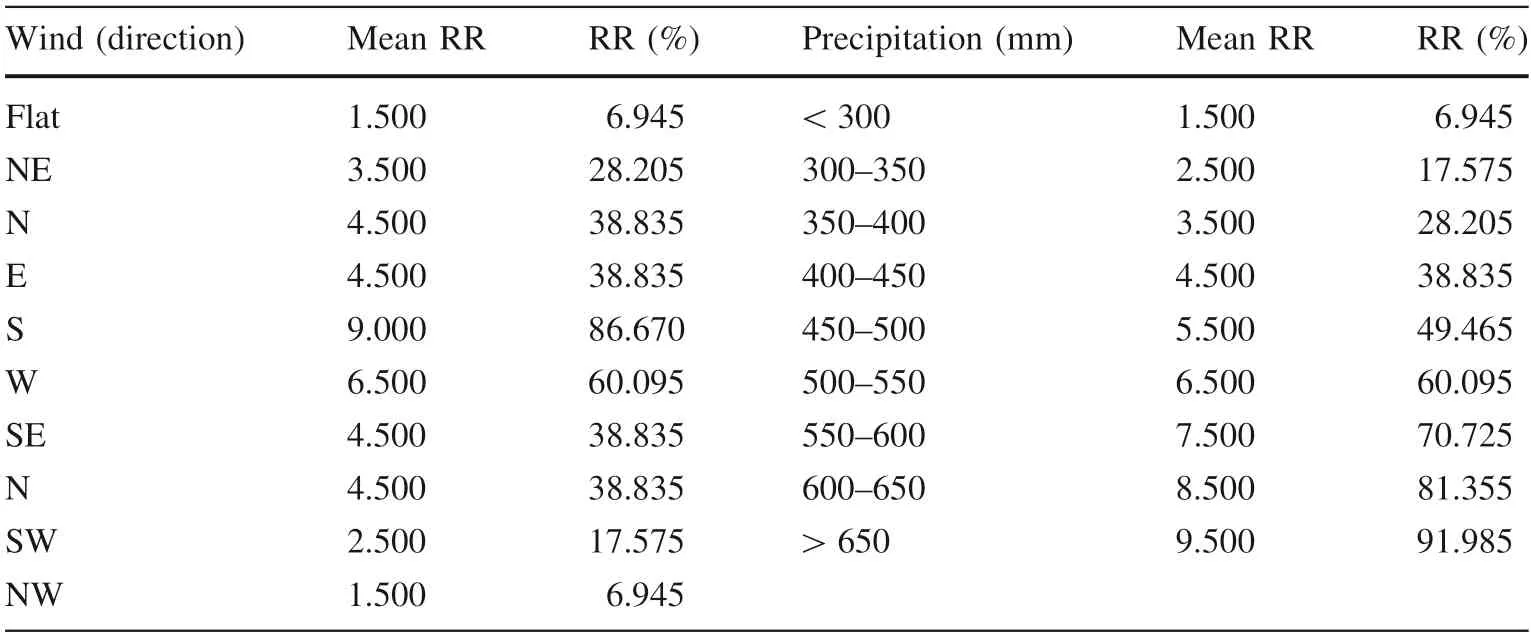
Table 9 Weighted values for climatic parameters

Table 10 Weighted values for soil depths
Stand characteristics
Tree species, age range, crown density, and site quality factors were evaluated as stand characteristics that affect storm damage risk. The results indicate that the storm damage risk was very high in black pine stands and in mixed stands of black pine and Brutian pine (Fig. 7). On the other hand, storm damage was very low in oak stands,beech stands, and in stands with other deciduous species.Previous studies on storm damage also reported that deciduous species are more resistant than coniferous species to storm damage(C¸anakc¸1oğlu 1993;Foster and Boose 1995).
In addition, storm damage risk was very high in mature stands in the study area, especially in stands over 40 years old. In analyses of relationship between stand age and storm damage risk, the likelihood of storm damage increased with stand age and generally observed in the stands over 50 years old (Foster 1988).
When considering crown density of the stands, storm damage was more frequent in stands with moderate(41-70%) and high (>70%) crown density. In similar studies, storm damage risk was alsofound to be relatively high in stands with high crown closure because there is limited space available for tree crown and roots to grow in dense stands (Mitchell 2000). In the present study, storm damage risk also increased as site quality increased in the study area, similar to the finding of Peltola and Kellomaki(1993)that stands in high-quality sites are more sensitive to winter storms due to relatively higher tree heights.

Fig. 3 Data layers for the storm damage factors generated by the large membership type
Topographical features
Our results indicated that storm damage risk was lower at elevations less than 600 m a.s.l. and risk gradually increased above 600 m, reaching a maximum level around 1000 m (Fig. 8). The risk of damage also tended to decrease at higher elevations (e.g.,>1000 m) where trees are frequently exposed to winter storms and more resitnat to damage (Schmoeckel and Kottmeler 2008). That storm damage risk tended to increase up to 30% slope, then decreased as the slope got steeper suggested that there is an inverse relationship between storm damage and ground slope(Schütz et al.2006).Aspect also contributed to storm damage risk, which was higher on southwest, south, and west aspects.
Climate parameters
Storm damage risk was higher with southeast and south wind directions (Fig. 9) and increases when strong winds occur for long periods (Lanquaye 1999). In terms of precipitation, storm damage risk increased as the amount of precipitation increased, which greatly loosens soils and thus leads to tree falls (C¸anakc¸1oğlu 1993).
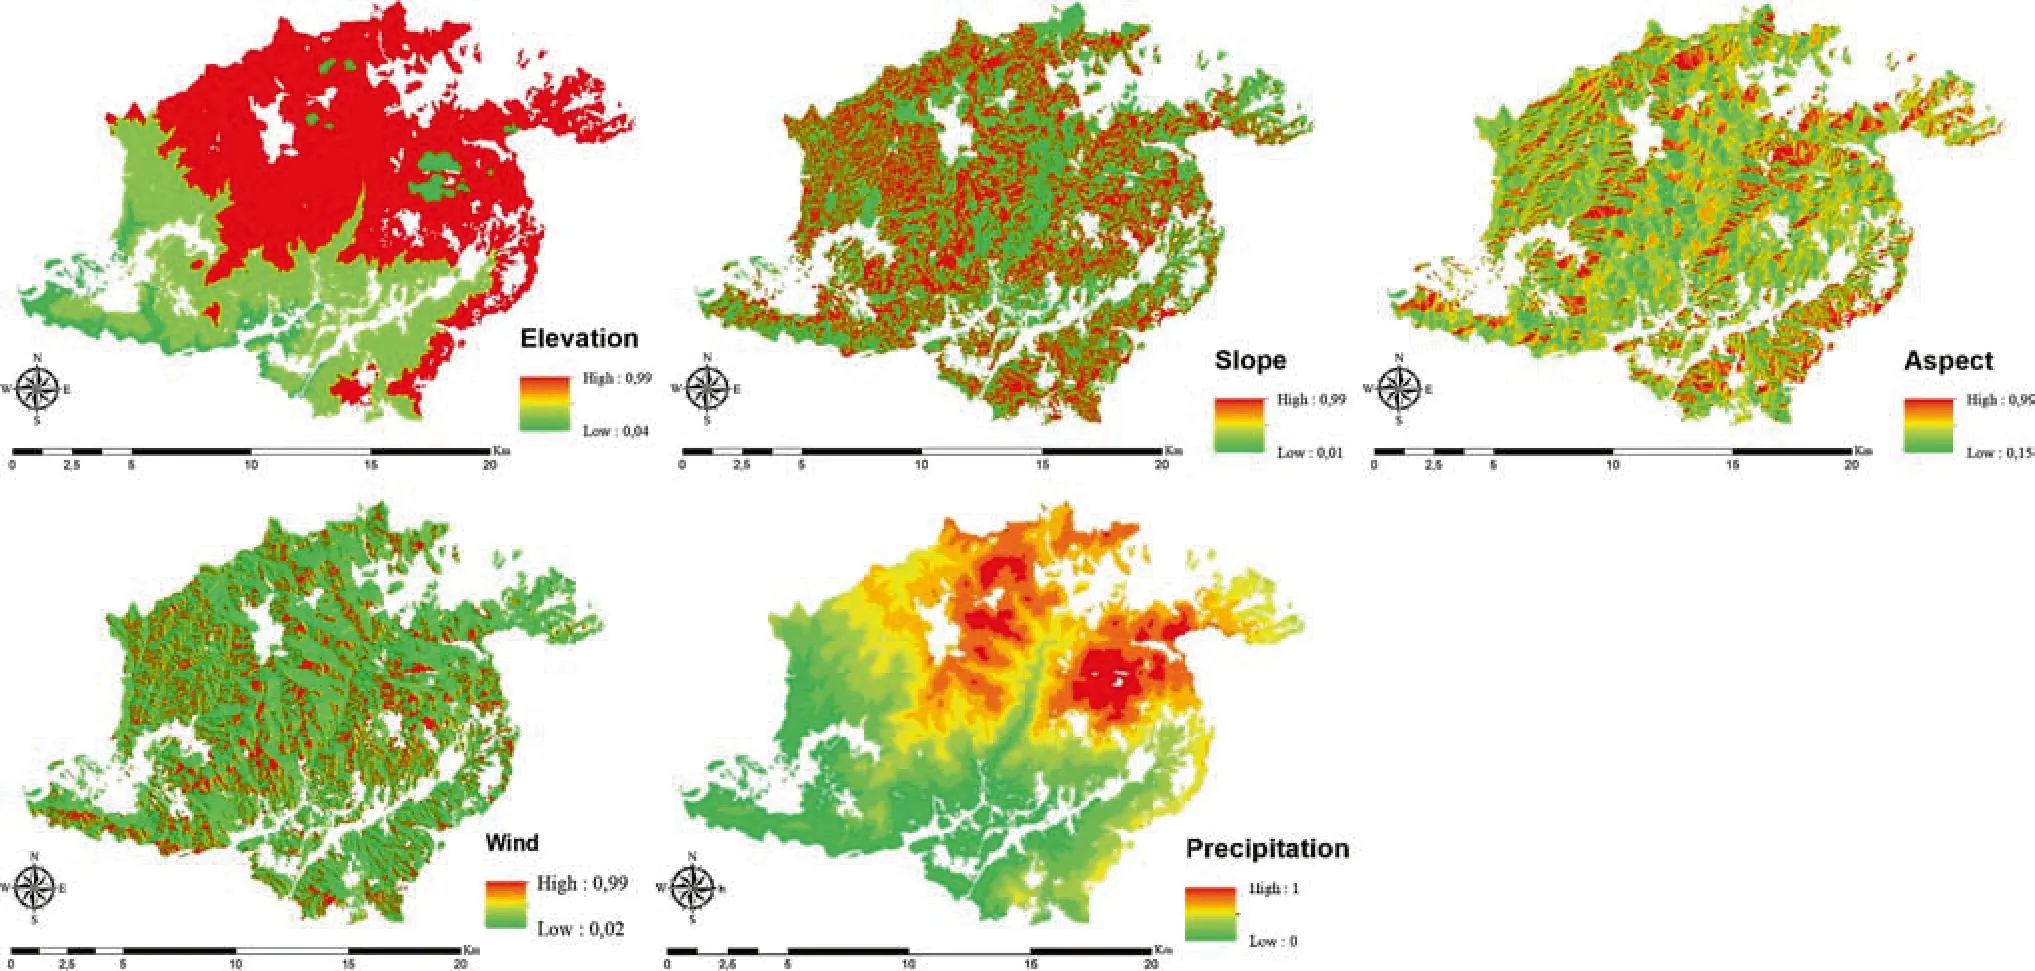
Fig. 4 Data layers for the storm damage factors generated by the large and linear (i.e., precipitation) membership types
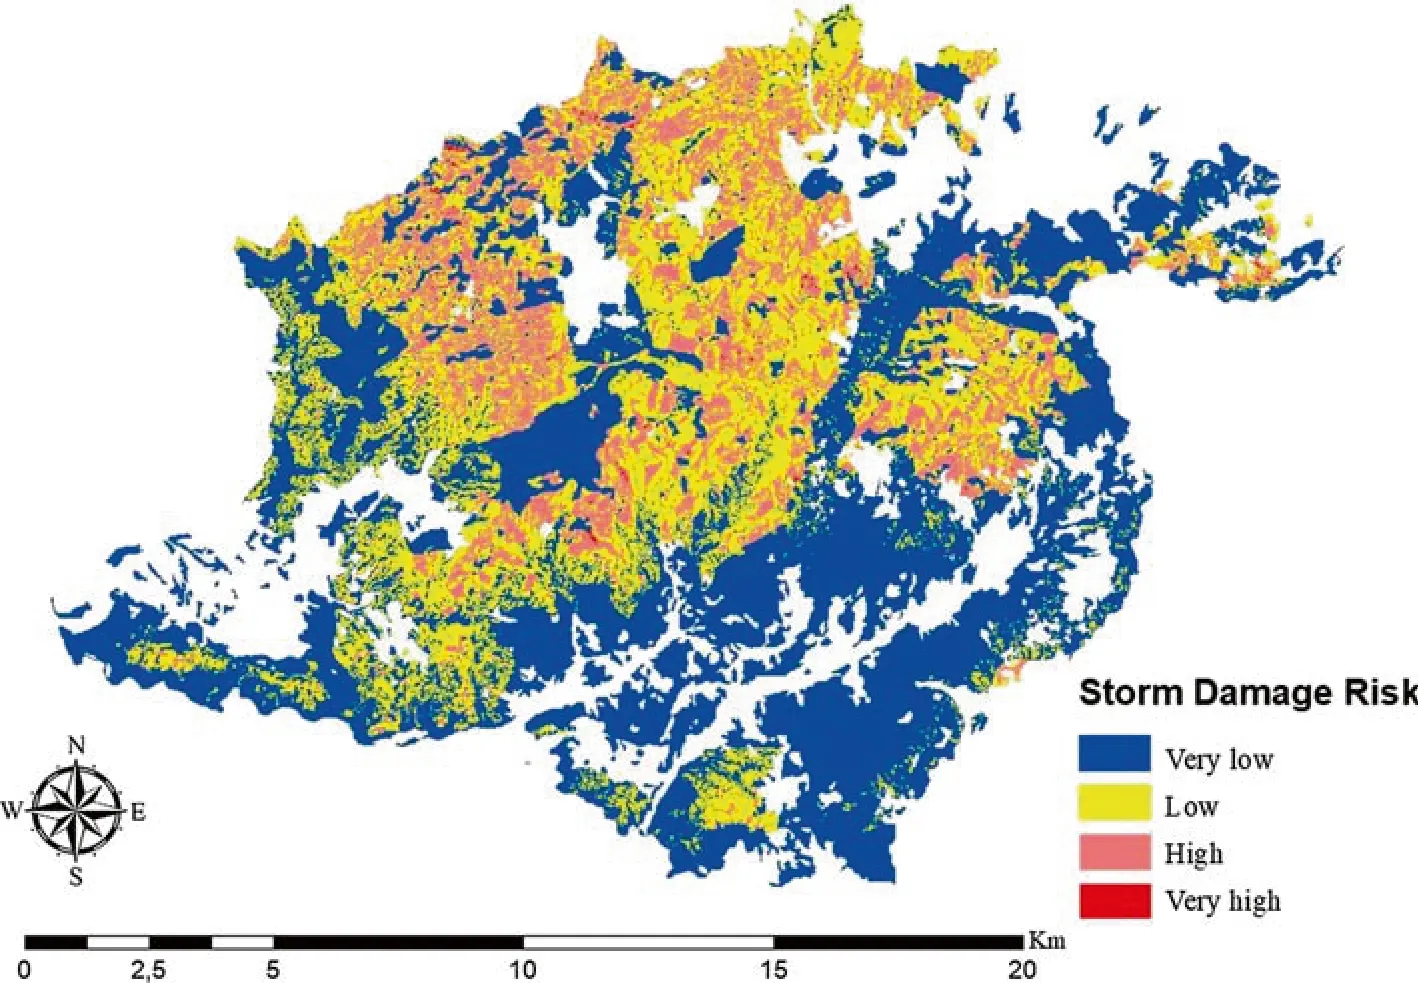
Fig. 5 Risk map of winter storm damage

Table 11 Areal distribution of storm damage risk
Soil depth
Where soil depth was low or shallow, storm damage risk was high(Fig. 9).Similar studies also suggested that stormdamage risk is considerably lower in the forests on deep soil, which permits the growth of stronger root systems,thus increasing tree resistance to storm damage(Rizzo and Harrington 1988).

Fig. 6 Map of actual storm damage

Table 12 Areal distribution of actual storm damage
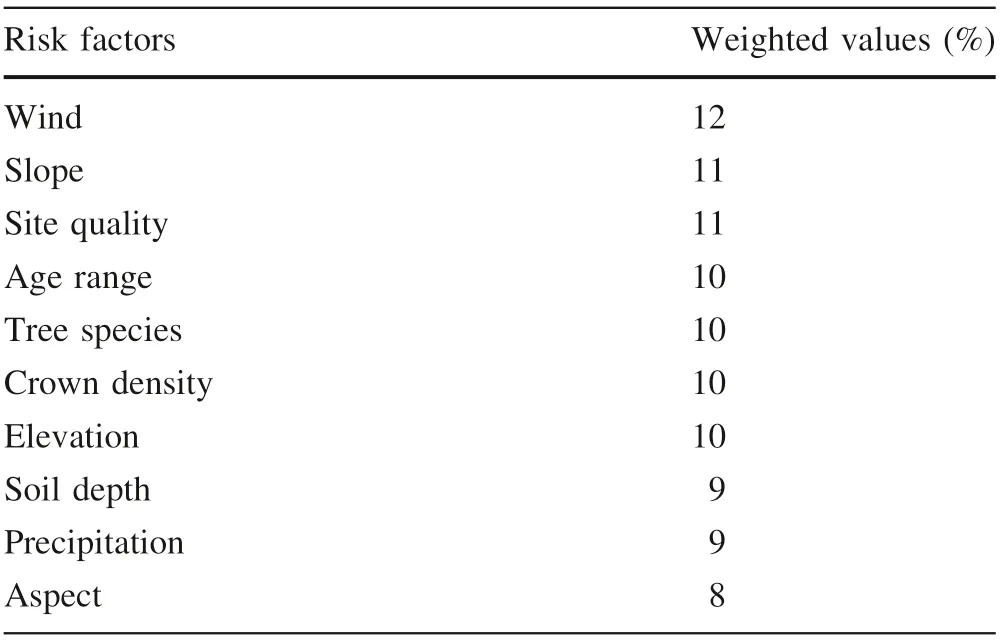
Table 13 Weighted values of risk factors on total storm damage risk
GIS-based storm damage risk model
Developing a risk map of storm damage using a GIS-based mathematical model provides effective solutions to advanced suitability model problems. The results from the model indicated that approximately 80% of the study area had very low or low storm damage risk, while 20% had high or very high risk, which was verified by, the actual storm damage map showing that about 76% of the study area was at very low or low risk,about 24%at high or very high risk.
Conclusions
To minimize the damage caused by winter storms in various regions of Turkey, we need to determine which forested areas are at risk of storm damage risk, then implement appropriate silvicultural, administrative, and technical measures. The risk map of storm damage developed here using a GIS-based mathematical model and a fuzzy logic approach considered stand characteristics,topographical features,climatic parameters,and soil depth.Wind (i.e., direction and speed) was found to have the greatest impact. The comparison of the risk map of storm damage to the actual storm damage maprevealed that high accuracy for the model; thus, the GIS-based mathematical models can be effectively and accurately used to generate risk maps for winter storm damage.

Fig. 7 Storm damage risk rates for stand characteristics
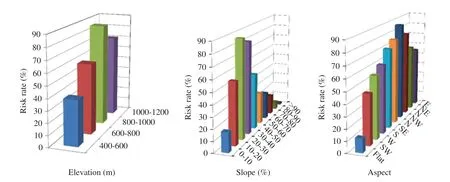
Fig. 8 Storm damage risk rates according to topographical features

Fig. 9 Storm damage risk rates based on climate parameters and soil depth
杂志排行
Journal of Forestry Research的其它文章
- Do increasing respiratory costs explain the decline with age of forest growth rate?
- At what carbon price forest cutting should stop
- Effects of seed moisture content, stratification and sowing date on the germination of Corylus avellana seeds
- Comparison of seed morphology of two ginkgo cultivars
- De novo assembly of the seed transcriptome and search for potential EST-SSR markers for an endangered, economically important tree species: Elaeagnus mollis Diels
- Effect of artificially accelerated aging on the vigor of Metasequoia glyptostroboides seeds
