Graphene nanoplatelets-reinforced magnesium metal matrix nanocomposites with superior mechanical and corrosion performance for biomedical applications
2020-04-29KhurramMunirCuieWenYuncangLi
Khurram Munir, Cuie Wen, Yuncang Li
School of Engineering, RMIT University, Melbourne, Victoria 3001, Australia
Abstract Magnesium (Mg) metal matrix composites (MMCs) reinforced with graphene nanoplatelets (GNPs) have been developed by powder metallurgy(PM).GNPs with different concentrations(0.1,0.2,and 0.3wt.%),layer thicknesses(5nm and 9nm),and particle sizes(15μm and 5μm) were dispersed into Mg powder by high-energy ball-milling processes. The microstructure and mechanical properties of the fabricated composites were characterized using transmission electron microscopy (TEM), scanning electron microscopy (SEM), energy dispersive X-ray spectroscopy (EDX), X-ray diffraction (XRD), Raman spectroscopy (RS), and compression tests. The corrosion resistance was evaluated by electrochemical tests and hydrogen evolution measurements. The cytotoxicity of Mg-GNPs composites was assessed using osteoblast-like SaOS2 cells. The results indicate that GNPs are excellent candidates as reinforcements in Mg matrices for the manufacture of biodegradable Mg-based composite implants. GNP addition improved the mechanical properties of Mg via synergetic strengthening modes. Moreover,retaining the structural integrity of GNPs during processing improved the ductility, compressive strength, and corrosion resistance of the Mg-GNP composites. Cytotoxicity assessments did not reveal any significant toxicity with the addition of GNPs to Mg matrices. This study demonstrates that Mg-xGNPs with x < 0.3wt.%, may constitute novel biodegradable implant materials for load-bearing applications.
Keywords: In vitro cytotoxicity; Biocorrosion; Magnesium-graphene composite; Mechanical properties; Strengthening mechanisms.
1. Introduction
The demand for innovative metallic biomaterials for artificial implants has been rising constantly and is expected to increase to serve the demand by people with bone injuries and degeneration caused by accidents, sports injuries, or the normal process of ageing,which often require biomaterial implants to restore function [1]. In bone implants, bone repair and regeneration are promoted by mechanical loading. This restricts the use of the current choice of conventional metals such as titanium (Ti) and some of its alloys, stainless steels (SS), and cobalt–chromium (Co-Cr) alloys, which exhibit higher elastic moduli than those of natural bone. Because of this mismatch in elastic modulus between metal implant and host bone, the surrounding bone consequently experiences stress-shielding which triggers post-implantation problems such as bone resorption and implant loosening thus requiring additional complicated revision surgery [2].
To address these issues, recent progress in exploring the applications of magnesium (Mg) and its alloys has shown the tremendous potential of these materials for a variety of biomedical applications such as cardiovascular, orthopedic,and other implants [3,4]. The elastic moduli of Mg alloys are closer to that of natural bone than other metals thus addressing the issue of stress-shielding caused by conventional metals. In addition, Mg alloys are of great interest for biodegradable load-bearing bone implants due to their biodegradation property in the physiological environment[5,6]. Therefore, being a lightweight metal with mechanical properties matching those of natural bone, along with its natural presence in the human body in significant biological roles [5,7], materials based on Mg have the potential to be used as biofunctional implants.
Despite the promising prospects of Mg alloys over conventional metallic biomaterials, there are still several challenges in utilizing pure Mg for bone implants. These challenges include the insufficient mechanical strength and ductility of pure Mg and its rapid degradation in the physiological environment before adequate bone healing[8].Once implanted in the body,Mg reacts with the water in the body and corrosion of Mg takes place in such a way that Mg is oxidized to Mg2+and water is reduced to hydrogen (H2) gas and OH−. The human metabolism copes with the released Mg and OH−ions but little is known about in vivo H2production [9]. Rapid degradation of Mg not only adversely affects the mechanical integrity of the implant, but also releases a large volume of H2gas in such a way that the corrosion of 1g of Mg results in the production of 1L of H2gas [5]. Such in vivo production of H2and formation of gas cavities near implantation sites in the body may cause additional complexity in the post-implantation procedures.
Nano-sized reinforcements have the potential to enhance the mechanical properties of metal matrices by Orowan strengthening and load-transfer strengthening mechanisms [10,11]. Among the various nano-sized reinforcements,graphene, a revolutionary two-dimensional (2D) material, has caught the attention of the scientific community since it was isolated and characterized in 2004;it is characterized by a single atomic layer of sp2bonded carbon atoms [12]. Graphene nanoplatelets (GNPs) comprise several graphene sheets held together by strong van der Waal (vdW) force and covalent bonding through neighboring carbon atoms. The intrinsic mechanical strength of monolayer GNPs has been reported as 130GPa with an extremely high surface area of 2630 m2/g that is attributable to the strong covalent bonding between adjacent sp2carbons [13].
From the perspective of corrosion inhibition, recent studies suggested that a single atomic layer of graphene is impermeable to gas molecules and provides an atomic-scale barrier such that not even helium gas can pass through it [14,15].As such, the characteristic honeycomb lattice of GNPs has a high electron density which blocks off all molecules, making graphene an excellent choice of material for corrosion resistance (CR) applications. Previous studies on anodic and cathodic scans of nickel (Ni) and copper (Cu) metals coated with graphene reported significant reductions in current densities, reaction rates, and ionic transfer [16,17]. These studies elucidated that GNPs can be used as a protective layer on underlying metal. Selvam et al. [18] also reported a decrease in the corrosion rate of an AZ91 alloy by coating its surface with a thin layer of GNPs and suggested using such composites as an anode material for Mg battery systems. From these perspectives, GNPs exhibit tremendous potential in not only reinforcing Mg matrices but also reducing corrosion rates and inhibiting the release of H2gas. Recent studies also reported that π-π stacking caused by strong vdW force has been recognized as a prominent adsorption mechanism of proteins onto the surfaces of GNPs [19,20]. Such strong π-π stacking primarily occurs between the strong sp2bonding of carbon atoms in carbon nanomaterials and the benzene rings in amino acids (the building blocks of proteins). Furthermore, the interactions between GNPs and proteins,nucleic acids,and human cells have opened avenues for utilizing this versatile material in biomedical applications [19,21].
Single layer or few layer GNPs improves the ductility of metal matrices as they exhibit remarkable mechanical properties and possess lower tendency to agglomerate than other carbon nanomaterials such as tubular carbon nanotubes (CNTs)and ball-shaped fullerenes [22,23]. For example, 2D planar surfaces of GNPs make them easier to adsorb onto metallic substrates in a face-to-face manner as the Van der Waals forces are much stronger in GNPs structures than CNTs and fullerenes. The contact modes between carbon nanomaterials such as CNTs, GNPs, and fullerenes and metal matrices depend on their morphological features. For instance, nanosized dimensions and high aspect ratios of CNTs make them a difficult reinforcement material in the metal matrices [23]. Recently, Ahmad et al. [22] reported the enhancement in toughness of brittle alumina (Al2O3) matrix with addition of very low concentrations (0.5wt.%) of GNPs.
In general, from biological perspective, the large specific surfaces areas (SSAs) of GNPs (∼2630 m2/g) enhance the adsorption of biomolecules on their surfaces by covalent crosslinking mechanism. The enzyme-catalyzed biodegradation of GNPs and macrophage mediated biodegradation of GNPs have been extensively reported in previous studies[24–28]. Rashad et al. [29–31] reported improvement in mechanical properties of pure Mg and Mg–1%Al–1%Sn alloy by addition of low concentrations (0.18–0.3wt.%) of GNPs.These studies established an understanding of the microstructural changes and the enhancements in both the strength and ductility of the GNPs reinforced composites. Similarly, Xiang et al. [32] reported the formation of heterogeneous bimodal microstructure and subsequent improvements in mechanical properties of Mg-6Zn alloys by addition of 0.7–1.6vol.%GNPs. These studies investigated the mechanical properties of Al- and Zn-containing Mg alloys reinforced with low concentrations of GNPs but did not study any structural changes in sp2graphitic network of GNPs during processing of the composites which significantly impacted the performance of carbonaceous reinforcements such as GNPs in the metallic matrices. However, there is still insufficient study on the effect of the number of layers in GNPs and the defect accumulation in their characteristic sp2carbon structure during various composite processing stages on the reinforcing ability in Mg matrices. Furthermore, the corrosion behavior and in vitro cytotoxicity assessments of GNPs reinforced Mg-based composites are rarely reported. Also, the mechanical and biodegradation behaviors of a pure Mg matrix reinforced with GNPs are still not fully investigated. Here, we report the mechanical, corrosion, and cytotoxicity assessment of Mg matrices reinforced with GNPs fabricated via powder metallurgy. The effects of multiple layered GNPs composed of different numbers of layers and weight fractions (0.1, 0.2,0.3wt.%) in Mg matrices have been studied and compared.Low concentrations of GNPs have been used in this study to avoid their agglomeration in the Mg matrices which may trigger micro-galvanic corrosion by becoming cathodic sites in corrosive environment.
2. Materials and methods
2.1. Starting materials
Pure Mg powder (100μm particle size, 99.9% purity)(Sigma-Aldrich, Australia) and GNPs (G-15: 15μm particle size, 5nm thickness and G-5: 5μm particle size, 9nm thickness) (Sigma-Aldrich, Australia) were used as elemental powders in this study. Stearic acid (SA, C18H36O2, purity ≥99.9%) (Sigma-Aldrich, Australia) was used as the process control agent (PCA) during high energy ball milling (BM).
2.2. Synthesis of Mg-GNP composites
GNPs (G-15 and G-5) were dispersed into Mg powder using a planetary ball mill (QM 3SP2, China). Firstly, BM of the Mg powder was carried out at 300rpm for 9h in an argon(Ar)environment with 0.5wt.%SA added as a PCA.Stainless steel balls to powder mixture ratio was set at 20:1. BM was carried out at intervals of 30min for 30min of milling to avoid overheating of the charged powders.GNPs in weight fractions of 0.1–0.3wt.%were then added to the milled Mg powder and further ball-milled for another 2h under the same milling conditions. Ball-milled Mg-GNP powder mixtures were handled in an Ar environment to prevent any atmospheric contamination.Mg–GNPs powder mixtures were compacted using a uniaxial hydraulic press under a pressure of 760MPa for 30min followed by high temperature sintering in an Ar atmosphere at 610 °C for 120min at a heating rate of 5 °C/min. The density of the sintered samples was measured by Archimedes’principle according to procedures outlined in ASTM B962-15. As a control, pure Mg samples were also fabricated with similar fabrication process which includes BM of Mg powder with 0.5wt.% SA for 9h at 300rpm in an Ar environment followed by compaction and sintering.
2.3. Characterization of powder mixtures and sintered composites
The morphology of elemental powders and Mg-GNP powder mixtures was observed by scanning electron microscopy(FEI Nova NanoSEM) and transmission electron microscopy(TEM, JEOL 1010). Standard particle size distributions were measured using ImageJ software in accordance with ISO 13322–1:2004 [33]. The Feret’s diameter (DF) of at least 300 particles was measured from multiple SEM images of the ball milled powder mixtures.Various phases in Mg-GNP powders,sintered compacts,and corroded samples were observed using X-ray diffractometer (XRD, BrukerAXS D4 Endeavor, Cu–Kα radiation(λ=0.154nm))at a scanning rate of 0.02°/s over the angular range of 10–90°. The microstructures of the pure Mg and Mg-GNP composites were also observed using optical microscope (Leica DM2500M with 3.1MP CCD), SEM,and TEM. Raman spectra of the pristine GNP and Mg-GNP composites were obtained by Raman spectroscope(In-Via Raman microscope, RenishawPlc) using a 514nm laser (laser power=5.63W) in the spectral range of 100–3000 cm−1to characterize the graphitic structure and defects in GNPs during composite processing.For microstructural observation,the sintered samples were etched using a picral reagent (3g picric acid, 2.5ml acetic acid, 50ml ethanol, and 5ml deionized water) and the corresponding grain sizes of the pure Mg and Mg–GNP composites were measured according to ASTM E112-12.
2.4. Mechanical property testing
Mechanical properties of the pure Mg and Mg-GNP composites containing various weight fractions (0.1–0.3wt.%)of GNPs were determined by compression tests on uniaxial 50kN Instron testing machine at displacement rate of 0.5mm/min. Five cylindrical samples from each batch with diameter 5mm and height 10mm were prepared by electric discharge machining (EDM) for compression tests.
2.5. Degradation behavior of fabricated Mg–GNP composites
The degradation behavior of the fabricated Mg–GNP composites was assessed by electrochemical testing and hydrogen gas evolution. Electrochemical testing was performed on disc samples with diameter 10mm and thickness 3mm machined by EDM. One side of the disc sample (working electrode)was attached to copper wire and cold mounted in an epoxy resin while the other flat side of the sample with an exposed area of 0.785 cm2was polished using SiC grinding paper and progressively ground via 240 and 800 grit SiC grinding papers followed by degreasing with ethanol and acetone, and finally dried in stream of hot air. Potentio-dynamic (PD) polarization curves were obtained with scan scope of ± 500mV against open circuit potential (OCP) at scan rate of 1.5mV s−1using an electrochemical workstation (VSP-300, Biologic France). In this study, three-electrode cell consisted of a saturated calomel electrode (SCE) as a reference electrode, a platinum electrode (1.5×1.5 cm2) as a counter electrode, and the cold-mounted samples were chosen as the working electrode. The epoxy mounted samples were then kept in Hanks’solution for 1h to stabilize the open circuit.
Corrosion current density icorr(mA cm−2) and corrosion rates were calculated by Tafel fitting using EC-Lab software(BioLogic). The degradation behavior of the composites was tested by soaking the mounted samples in Hanks’ solution at 37 °C±1°C. Three samples from each composite were used for degradation evaluation via electrochemical testing and H2gas evolution measurements. It is well-established that Mg degradation in a physiological environment is generally associated with the release of H2gas; the degradation rate of the Mg–GNP composite can be calculated by the volume of H2gas generated. For H2release tests and gas evolution testing, epoxy- mounted samples were placed in Hanks’ solution with exposed surfaces facing upwards at 37°C. A funnel and burette were used to cover the samples and collect the generated H2gas in accordance with the procedures mentioned by Anug et al. [34] The degradation rate of Mg–GNP composite samples was calculated from the H2evolution rate, Vh(ml cm−2day−1) using the equation given by Ph=2.279 Vh[35].
2.6. Cytotoxicity assessment of Mg-GNP composites
The in vitro cytotoxicity of the Mg–GNP composite samples was assessed using the human osteoblast-like cells(SaOS2) (Barwon Biomedical Research, Geelong Hospital,Australia) by the indirect contact method according to ISO 10993–5–2009 [36] and the procedures were outlined in previous studies [37–39]. Prior to in vitro assessment, the Mg–GNP composite specimens were polished to 800-grit finish and ultrasonically cleaned with acetone, ethanol, and water, each step for 15min. Extracts of the Mg–GNP composite samples were prepared using Dulbecco’s modified eagle medium (DMEM, Gibco, Life Technologies, Australia) supplemented with 10% fetal bovine serum (FBS) (Bovogen Biologicals, Australia) and 1% penicillin–streptomycin (Gibco,Life Technologies, Australia) to extract each Mg–GNP specimen and pure-Mg specimen with a surface area/supplements DMEM ratio of 0.8 cm2/ml in a humidified environment (5%CO2at 37°C) for 3 days. After that, the supernatant was collected from each incubated sample and filter-sterilized with a 0.22μm filter (Falcon, BD Biosciences, USA). The control extracts were prepared as desired above by incubating supplemented DMEM without the addition of the Mg–GNP composites.
The SaOS2 cells were seeded into a 48-well plate at a density of 10,000 cells per well with 400μl of supplemented DMEM and then incubated for 24h to allow cell attachment on the plate. Then the supplemented DMEM was replaced with 400μl of the respective specimen extracts. The confluency of culture was measured approximately 80%. Then the supplemented DMEM was replaced with 400μl of the respective specimen extracts. The well for the control was also replaced with 400μl fresh supplemented DMEM. After cell culturing for 5 days, the cytotoxicity of the Mg alloys was assessed by MTS assay [39–41]. The optical density (OD) values for the pure-Mg and Mg–GNP composite samples were converted to viable cell counts using a standard curve and a cell viability ratio (CVR) for every sample was measured using the equation: CVR= (viable cell count in experimental extract)/(viable cell count in control extract).
2.7. Statistical analysis
Five repeats of the compression tests, three repeats of the corrosion tests, and five repeats of the in vitro cytotoxicity assessments for each group of the samples were carried out.One-way analysis of the variance (IBM SPSS Statistics) was applied to determine the statistical significance of the differences observed between groups. P < 0.05 was considered statistically significant.
3. Results and discussion
3.1. Evolution of GNPs during dispersion processing
Pure Mg powder exhibited an irregular morphology(Fig. 1a). The morphology of the as-received graphene powders (G-15) and (G-5) is shown in Fig. 1b and c, showing a flake-like morphology with average particle sizes of 15μm and 5μm for G-15 and G-5, respectively. Previous studies on GNPs-reinforced composites have reported that the mechanical, optical, and electronic properties of GNPs are strongly influenced by the number of layers present in their structures [42,43]. Measurement of thicknesses of GNPs by TEM is advantageous over atomic force microscopy (AFM) as it provides a direct measurement of GNP thicknesses, whereas measurements by AFM leaves discrepancies which have been attributed to tip-surface interactions during AFM [43]. Therefore, thickness of the as-received GNPs (G-15 and G-5) was further measured by TEM analysis, as shown in Fig. 1(d–e).The thicknesses of the G-15 and G-5 GNPs were measured as 5nm and 9nm, respectively, as shown in the high-resolution TEM (HRTEM) images in Fig. 1 (d–e).
In the structure of GNPs, the carbon atoms are arranged in a honeycomb lattice with separation of 0.142nm, and the distance between planes is 0.334nm [44]. Considering the inter-layer spacing of 0.334nm in GNPs, the average number of layers in the G-15 and G-5 were measured as 15 and 27, respectively. TEM analyses were carried out for assessment of the dispersion of GNPs in the Mg matrices prior to sintering. The dispersion states of different weight fractions(0.1–0.3wt.%) of G-15 and G-5 GNPs in Mg matrices are shown in Fig. 2. Good adherence of GNPs was observed on PCA-attached Mg powders. The dispersion of G-15 and G-5 in Mg powder is shown in Fig. 2 (a–c) and Fig. 2 (d–f),respectively. Apparently, 0.1wt.% GNPs were homogenously dispersed in Mg matrices via BM. However, increasing their content from 0.1 to 0.3wt.% led to their stacking and clustering in the Mg matrices under similar dispersion processing conditions, as shown in Fig. 2(a–c). Overall, the BM process resulted in adequate wettability and dispersion of the GNPs, and TEM analyses confirmed the effectiveness of the dispersion process adopted in this study. Compared to G-5 GNPs, the BM process resulted in better dispersion of the G-15 GNPs in Mg matrices, as shown in Fig. 2 (d–f).
In sp2hybridized carbon structures, i.e., GNPs and CNTs,three out of four valence electrons form covalent bonding with in-plane neighboring electrons, while the fourth can delocalize within the carbon atoms. Such sp2hybridization in GNPs forms strong in-plane C–C bonds and weaker out-ofplane bonds [10,45]. Structural changes to their characteristic sp2structure in the form of vacancies and open edges adversely affect their unique reinforcing properties. These structural changes in dispersed GNPs were further assessed by Raman spectroscopy and will be discussed below. Because of the high thermal conductivity (KGNP>3000W/ m.K) and lower coefficient of thermal expansion (−8.0×10⁻⁶K−1)[46,47], the presence of dispersed GNPs in the grain boundaries of Mg matrices causes a pinning effect and inhibits grain growth during the sintering stages.

Fig. 1. Morphology of as-received Mg and GNPs powders: (a) SEM images of Mg powder; (b) SEM image of G-15 GNPs; (c) SEM image of G-5 GNPs;(d) TEM and HRTEM images of G-15 GNPs showing average thickness of 5nm; and (e) TEM and HRTEM images of G-5 GNPs showing average thickness of 9nm.

Fig. 2. Bright-field TEM images of Mg–GNP powder mixture: (a) Mg-0.1wt.% G-15; (b) Mg-0.2wt.% G-15; (c) Mg-0.3wt.% G-15 with inset showing SAED pattern collected from powder mixture; (d) Mg-0.1wt.% G-5; (e) Mg-0.2wt.% G-5; and (f) Mg-0.3wt.% G-5.

Fig. 3. Particle size distributions of Mg–GNP powder mixtures with various weight concentrations after ball milling: (a) 0.1wt.% G-15; (b) 0.2wt.% G-15;(c) 0.3wt.% G-15; (d) 0.1wt.% G-5; (e) 0.2wt.% G-5; and (f) 0.3wt.% G-5.
Fig. 3 shows the SEM images and corresponding particle size distributions of the ball milled powder mixtures containing different weight fractions of G-15 and G-5 GNPs.The addition of 0.1wt.% G-5 GNPs into the Mg matrices resulted in relatively fine average particle size as compared to powder processed with G-15 GNPs. This may be attributed to dispersion of fine GNPs (5μm), covering more areas of Mg particles.However,higher weight fractions(0.2–0.3wt.%)of the G-5 GNPs in the Mg matrices resulted in their agglomeration and stacking within Mg matrices, as shown in Fig. 2 (e-f).
Despite the relatively fine particle size distributions obtained in the ball milled powder mixtures containing G-5 GNPs, these powder mixtures also contained considerably larger particles with particle sizes in the range of 80–150μm as shown in Fig. 3 (d-f). Meanwhile, Mg-GNPs powder mixtures containing G-15 GNPs showed homogeneous particle size distributions with least larger particles. The average size of the ball milled Mg-GNP powders was smaller than that of the starting Mg powders, indicating a preferential occurrence of fracturing over cold-welding during ball milling, which may be attributed to the lubricant effect of the GNPs. Because of their high thermal conductivity (<3000W m−1k−1),adsorbed GNPs acted as a heat sink on Mg particles and thus shrinkage of Mg particles took place [48]. These fractured particles improved the green density of Mg matrices during consolidation, therefore enhanced their relative densities.
3.2. X-ray diffraction (XRD) and Raman spectroscopy studies
Characterization of structural changes in sp2hybridized carbonaceous reinforcements such as GNPs in relation to the processing conditions and interactions with the surrounding metal matrices is significant in correlating their reinforcing efficiencies in MMCs. Chemical stability of GNPs, their bonding with surrounding Mg matrices, and phase transformations play a vital role in strengthening Mg matrices. Fig. 4a shows the XRD patterns of the starting powders. Diffraction peak(002) at 2ϴ of 26.5° in the XRD pattern (Fig. 4a) of the as-received G-15 and G-5 powders revealed the crystalline structure of the as-received GNPs. XRD patterns of the powder mixtures of both batches containing 0.3wt.% GNPs revealed additional graphitic diffraction peaks, confirming the presence of GNPs in the powder mixtures (Fig. 4 (b–c)).

Fig. 4. XRD patterns of starting powders and powder mixtures: (a) raw pure Mg, G-15, and G-5 powders; (b) Mg–GNP powder mixtures containing 0.1–0.3wt.% G-15; and (c) Mg–GNP powder mixtures containing 0.1–0.3wt.% G-5 GNPs.
Similarly, Raman spectra of the starting powders (Mg and GNPs) are shown in Fig. 5. Mg, like most metals, does not possess Raman active vibrational modes [48], whereas the Raman spectra of the as-received GNPs (G-15 and G-5)(Fig. 4b) revealed three main peaks at 1343,1580, and 2680 cm−1, showing characteristic D band, G band and 2D band(or Ǵband), respectively, which are generally associated with first-order Raman and double resonance Raman scattering in GNPs.
GNPs are generally characterized as a pristine 2D single atomic sheet of sp2hybridized carbons; as such the coexistence of sp3carbons in the graphitic lattice can be classified as disorders, where these defects can be found on the basal edges of GNPs or in vacancies. A previous Raman spectroscopy study on GNPs has shown that the characteristic D band is associated with non-sp2defects in the C–C bonds of GNPs, whereas the G band is generally attributed to the in-plane stretching mode of C–C bonds in GNPs, or to the degree of graphitization or crystallinity of GNPs [49].In the Raman spectra of GNPs, the characteristic G band represents the first-order Raman scattering, whereas D band and 2D band originate from a second-order Raman scattering process. Changes in the characteristic Raman peak intensity ratio ID/IGare indicative of intrinsic or induced disorders and,in other words, the quality of the graphitization in dispersed carbonaceous reinforcements such as GNPs in metal matrices[50], whereas the intensity ratio of the IG/I2Dband is indicative of the number of layers present in the GNPs. A previous study on the Raman spectroscopy of GNPs with different numbers of layers has established that characteristic intensity ratio (IG/I2D) analyses can be used as a fingerprint to identify single-layer GNPs (SLGs), few-layers GNPs (FLGs), and multi-layered GNPs (MLGs) [49]. As quantitative indicators,the IG/I2Dratios of 0.3–0.5, 0.5–1, and > 1 correspond to SLGs, FLGs, and MLGs, respectively. The IG/I2Dratios of the GNPs used in this study were measured as 1.04±0.02 and 1.16±0.07 for G-15 and G-5 GNPs, respectively, which complements the TEM results.Based on the Raman and TEM results, the G-15 and G-5 GNPs were characterized as MLGs and their ID/IGratios (i.e., the disorder to graphitization) were measured as 0.11±0.03 and 0.16±0.02, respectively.

Fig. 5. Raman spectra of starting pure Mg, G-15 and G-5 GNPs powders.
3.3. Microstructure of Mg-GNP composites
Fig. 5 shows the OM, SEM, and corresponding EDX elemental maps of the Mg–GNP composites containing 0.1–0.3wt.% G-15 and G-5 GNPs. The addition of GNPs caused microstructural changes in the Mg metal matrices. Compared to pure Mg, Mg – (0.1–0.3wt.%) G-15 composites exhibited smaller grains. The grain sizes of the pure Mg and Mg–GNP composites are shown in Fig. 5. The average grain size values for the pure Mg, Mg-0.1wt.% G-15, Mg-0.2wt.% G-15, and Mg-0.3wt.% G-15 were measured as 64.20μm, 40.15μm,37.60μm,and 30.70μm,respectively.The average grain sizes of the Mg matrices reduced with an increase in GNP content.Considering the zero solubility of carbon in Mg [51], dispersed GNPs were mostly distributed at the grain boundaries of the Mg, thus contributing to the grain refinement of the Mg matrices. These results are in agreement with previous studies in which grain refinement of the metal matrices was observed from the addition of GNPs [52,53]. Compared to Mg–GNP composites reinforced with G-15 GNPs, OM of the Mg-G-15 composites revealed larger grain sizes as shown in Fig. 5 (h –j).
Fig.6(e–g)show the SEM images and corresponding EDX elemental maps showing the dispersion G-15 GNPs in Mg.The dark regions in the elemental maps correspond to oxidation in the fabricated composites during the sintering process which increased with an increase in GNP content in the Mg matrices. This is complemented by XRD patterns obtained from the fabricated composites, as will be discussed below.
This may be attributable to the large surface areas of GNPs,which provide them with great affinity towards oxygen. It is evident that uniform distribution of GNPs was achieved in these batches of composites as shown by the C elemental maps. However, addition of GNPs (G-5) with an increased number of layers (27) resulted in the agglomeration with increase in their weight content (0.2–0.3wt.%) in the Mg matrices as shown in Fig. 6 (l–m). The average relative density of the sintered pure Mg compact was measured as 94%. For the sintered Mg–GNP composites reinforced with G-15 GNPs,average relative densities were measured as 97%, 95%, and 93% with the addition of 0.1, 0.2, and 0.3wt.% G-15 GNPS,respectively.Compared to G-15 reinforcements in the Mg matrices, addition of G-5 GNPs resulted in decrease in densification of the Mg–GNP composites fabricated under similar conditions.The average relative densities of the Mg–G-5 composites were measured as 93%, 91%, and 87% by addition of 0.1, 0.2, and 0.3wt.% G-5 GNPS, respectively. The decrease in the relative density of the composites with an increase in GNP content may be attributable to their stacking and reagglomeration in the ravine zones of the Mg particles during high-temperature sintering stages. As shown in Fig. 6 (h–j),average grain sizes values for the Mg matrices with addition of 0.1, 0.2, and 0.3wt.% of G-5 GNPs were measured as 52.15μm, 45.80μm, and 40.24μm, respectively.
Mg-GNPs powder mixtures containing G-15 GNPs revealed more homogenous particle size distributions with larger quantities of fine particles as compared to Mg-GNPs powder mixtures containing same content of G-5 GNPs. For the same concentration of GNP, the finer GNP, the higher dispersivity of GNP in the composite, more effective pinning effect and inhibition of grain growth, so the Mg-GNP composites with 0.1wt.% G5, 0.2wt.% G5 and 0.3wt.% G5 can be expected to show smaller grain sizes than those with 0.1wt.% G15, 0.2wt.% G15, respectively. However, Raman studies on the powder mixtures containing G-5 GNPs revealed more defect concentrations in sp2carbon network of GNPs which may adversely affect their ability to provide a pinning effect to inhibit grain growth. This is in agreement with other carbon nanomaterials such as CNTs in which higher defect concentrations overwhelmed their reinforcing abilities in metal matrices [10].
Fig. 7a shows the Raman spectra obtained from the ball milled powder mixtures and sintered Mg–GNP composites containing 0.1–0.3wt.% G-15 GNPs. The Raman spectra of the powder mixtures and sintered Mg–GNP composites containing G-15 GNPs revealed slightly broadened G bands at 1585 cm−1. It has been established that decrease in intensity and broadening of the G band can be interpreted as presence of defects in the sp2C–C network of GNPs [50]. The average characteristic intensity ratio (ID/IG) was measured as 0.13, 0.16, and 0.18 for powder mixtures containing 0.1, 0.2,and 0.3wt.% G-15 GNPs, respectively.

Fig. 6. Optical microscopy (OM), SEM images, and corresponding EDX elemental maps of fabricated Mg–GNP composites: (a) pure Mg; (b) Mg-0.1wt.%G-15; (c) Mg-0.2wt.% G-15; (d) Mg-0.3wt.% G-15; (e–g) SEM images and corresponding elemental maps of Mg-G-15 composites: (e) Mg-0.1wt.% G-15;(f) Mg-0.2wt.% G-15; (g) Mg-0.3wt.% G-15; (h) Mg-0.1wt.% G-5; (i) Mg-0.2wt.% G-5; (j) Mg-0.3wt.% G-5; and (k–m) SEM images and corresponding elemental maps of Mg-G-5 composites: (k) Mg-0.1wt.% G-5; (l) Mg-0.2wt.% G-5; and (m) Mg-0.3wt.% G-5.
On the other side, a slight broadening of the G band indicated some minor defect accumulation in the dispersed G-15 in the Mg–GNP powder mixtures during the BM process.Within a cluster, agglomerated GNPs interact with each other via friction and impact and such an interaction forms defects in their graphitic structure due to impact energy absorbed by an individual GNP. No significant changes in the intensity ratio of IG/I2D,which is indicative of the number of layers in GNPs, was observed in Batch 1 Mg–GNP composites processed with 0.1–0.3wt.% G-15 GNPs during the BM and sintering stages which is reflective of effective dispersion with minimum layer stacking of GNPs in the Mg matrices. The limited increase in the defect ratio (ID/IG) and presence of an intense 2D peak in all Raman spectra of the Mg–G-15 composites are indicative of ordered graphene in these batches of composites.
However, in the other batches of Mg–GNP composites which processed with 0.1–0.3wt.% G-5 GNPs, significant changes in the intensity ratio of ID/IGand IG/I2Dwere observed during ball milling and sintering stages as shown in Fig. 6b. This may be attributable to higher defect accumulation and layer stacking (agglomeration) in the G-5 GNPs during the composite processing stages. In the Mg–GNP composites processed with 0.3wt.% G-5 GNPs, the intensity ratio of ID/IGincreased to 0.37 during ball milling, showing a significant increase of 185% compared to that of the asreceived GNPs. This characteristic ratio further increased to 0.82 during high temperature sintering (Fig. 6b). Similarly, a broadening and decrease in intensity of 2D band further suggested that the accumulation of non-sp2defects was triggered due to layer stacking and re-agglomeration of the 0.3wt.%G-5 GNPs in the Mg matrices at elevated sintering temperature. Compared to G-15 GNPs, the G-5 GNPs revealed a higher content of defects in the Mg-GNPs powder mixtures(Fig. 6a-b). This may be attributed to higher amount of stacking faults due to increased number of layers in G-5 GNPs.The strengthening mechanisms in composites containing carbon nanomaterials such as GNPs and CNTs strongly depend on the structural integrity of these nano-reinforcements in metal matrices. Depending on the nature and intensity of defect accumulation in sp2carbon network in GNPs, these strengthening mechanisms act differently in the composites and it becomes difficult to accurately predict their contributions to the yield strength (σys) of Mg-GNP composites.

Fig. 7. Raman spectra of Mg–GNP composites: (a) Raman spectra of powder mixtures and sintered Mg composites containing 0.1–0.3wt.% G-15 GNPs; and(b) Raman spectra of powder mixtures and sintered Mg composites containing 0.1–0.3wt.% G-5 GNPs.

Table 1 Changes in intensity ratios of ID/IG and IG/I2D of G-15 and G-5 GNPs during various composite processing stages measured from corresponding Raman spectra.
TEM images (Fig. 2 (d-f)) also showed agglomeration in Mg-G-5 GNPs powder mixtures. The higher amount of these defects may occur in sp2graphitic network in GNPs due to agglomeration, layer stacking, and due to their interaction with neighboring GNPs in the agglomerate via friction and impact. The changes in intensity ratios of ID/IGand IG/I2Dof G-15 and G-5 GNPs during various composite processing stages are summarized in Table 1.
Fig. 8 (c–d) show the XRD patterns of the sintered pure Mg and Mg–GNP composites containing 0.1–0.3wt.%G-15 and G-5 GNPs. The XRD patterns revealed intense peaks associated with Mg along with a less intense peak at 2θ=43.12°associated with magnesium oxide(MgO).The intensity of the MgO phase increased with increasing content of G-15 and G-5 GNPs dispersed in the Mg matrices. GNPs have a high affinity to absorbing available oxygen atoms in the atmosphere during the processing of Mg–GNP composites. SEM and EDX maps also confirmed the presence of oxygen in the grain boundaries as shown in Fig. 6 (e–g) and Fig. 6 (k–m). Compared to the Mg–GNP composites processed with G-15
GNPs, the intensity of MgO peaks in the composites containing G-5 GNPs was observed to be slightly higher, as shown in Fig. 6d. This may be attributable to increased defect accumulation in the G-5 GNPs during composite processing,as confirmed by Raman spectroscopy of these batches of composites. It has been established in previous study that defects in GNPs in the form of broken edges and vacancies become active sites for the attachment of functional groups such as oxygen [54]. Oxygen attachment on GNPs is capable of inducing sp3defects in their structure by distorting λ-conjugated system which can adversely affect the resultant strength of the composites [55]. However, the presence of elemental oxygen on GNP surfaces is advantageous in such a way that these oxygen atoms preferentially react with reactive Mg matrices during high temperature sintering and develop a good bond between the matrices and dispersed GNPs.
3.4. Mechanical properties of Mg-GNP composites

Fig. 8. XRD patterns of sintered Mg–GNP composites: (a) Mg-GNPs composites containing 0.1–0.3wt.% G-15 GNPs and (b) Mg-GNPs composites containing 0.1–0.3wt.% G-15 GNPs.
During the loading conditions, the ductile metal matrix transfers the load to stiffer GNPs. It has been established that addition of GNPs, up to a certain content, improved the mechanical properties of metal matrices such as hardness and yield strength [56]. However, during composite processing, structural changes in dispersed GNPs occur in the form of re-agglomeration, layer stacking, exfoliation, and subsequent accumulation of defects due to their interaction with neighboring GNPs in the agglomerate via friction and impact, which results in ever-changing mechanical and functional performance of MMCs. Fig. 9 shows the compressive stress–strain curves of the pure Mg and Mg–GNPs composites containing 0.1–0.3wt.% G-15 and G-5 GNPs. The average 0.2% compressive yield strength, ultimate compressive strength, and strain to failure for the pure Mg were measured as 59MPa, 85MPa, and 6%, respectively. As shown in Fig. 7a, compared to pure Mg, addition of G-15 GNPs resulted in significant improvements in the mechanical properties of the Mg matrices which was measured as 99MPa,130MPa, and 126MPa for Mg–GNP composites containing 0.1, 0.2, and 0.3wt.% G-15 GNPs, showing improvements of 67%, 120%, and 113%, respectively. Addition of G-15 GNPs, exhibiting lower number of layers and minimum defects in their graphitic structure, simultaneously improved the ductility and compressive strength of the Mg matrices.
However, compared to the G-15 GNPs, the same content of G-5 GNPs in Mg resulted in moderate improvement in the mechanical properties as shown in Fig. 7b. The yield strength of Mg–GNP composites containing 0.1, 0.2,and 0.3wt.% G-5 GNPs was 76MPa, 97MPa, and 110MPa,showing improvements of 28%, 64%, and 86%, respectively,as compared to the pure Mg. The ultimate compressive strength and%compression to failure of the Mg–0.3wt.% G-15 GNP composite were measured as 246MPa and 14% respectively, showing the promising mechanical performance of these batches of composites. On the other hand, the ultimate compressive strength and strain to failure of the Mg–0.3wt.%G-5 GNP composite were measured as 169MPa and 9%, respectively. These values were significantly lower than those of Mg composites containing same concentrations of G-15 GNPs (246MPa and 14%), showing that the number of layers in GNPs plays an important role in their mechanical performance. Fig. 9c shows the comparison of compressive yield strength of pure Mg-0.1–0.3wt.% GNPs from this study with other as-cast Mg alloys and Mg-CNT/GNP composites reported in other studies fabricated by various preparation methods.
The improvements in mechanical properties by addition of GNPs were further investigated in terms of their strengthening efficiencies by considering their volume fractions in the Mg matrices. This approach clarifies their strengthening role in conjunction with their state of graphitization in metal matrices [57,58]. The strengthening efficiency of GNPs containing different defect concentrations in the fabricated Mg–GNP composites can be measured using [58]:
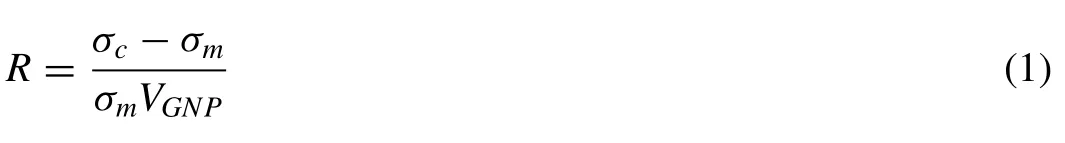
where R is the strengthening efficiency, σcis the compressive yield strength of the composite, σmis the compressive yield strength of the Mg matrix, and VGNPis the volume fraction of GNPs in the Mg metal matrix. Considering the bulk density of 2.1g/cm3for GNPs, VGNPs were measured 0.08, 0.17, and 0.25vol.% for 0.1, 0.2, and 0.3wt.% GNPs, respectively.
The average strengthening efficiencies of G-15 GNPs were measured as 8.26%, 4.54%, and 3.01% in the Mg matrices containing 0.1, 0.2, and 0.3wt.% of these GNPs, respectively.It should be noted that the strengthening efficiencies of G-15 GNPs reduced in increasing their content in the Mg matrices, which may be attributable to their agglomeration when dispersed in higher concentrations (0.3wt.%). The strengthening efficiency of G-15 GNPs in Mg–GNP composites fabricated from powder mixtures was considerably improved by addition of 0.1wt.% GNPs compared to Mg–GNP composites containing the same concentrations of G-5 GNPs. This is mainly attributable to the defect concentrations in G-5 GNPs due to their agglomeration in Mg during dispersion processing.The Raman spectra of these batches of composites(Fig. 7b) revealed increased intensity of the D band and broadened 2D bands of the G-5 GNPs, which reflects severe defect concentrations in their graphitic structures. The mechanical properties along with average values of the strengthening efficiencies of G-15 and G-5 GNPs in the Mg matrices are presented in Table 2.

Fig. 9. Mechanical properties of pure Mg and Mg–GNP composites: (a) compressive stress–strain curves of pure Mg and Mg–GNP composites containing 0.1–0.3wt.% G-15 GNPs; (b) compressive stress–strain curves of pure Mg and Mg composites containing 0.1–0.3wt.% G-5 GNPs; and (c) compressive yield strength of pure Mg-GNPs in this study in comparison with other as-cast Mg alloys and Mg-CNT/GNP composites from other studies.
The fractured surfaces of pure Mg and Mg–GNP composites containing 0.1–0.3wt.% G-15 and G-5 GNPs are shown in Fig. 10. As shown in Fig. 10a, the fracture surface of the pure Mg predominantly revealed the typical presence of flat surfaces and cleavage features thus exhibiting brittle fractures. However, addition of GNPs resulted in mixed modes of failure in the Mg matrices. The fracture surfaced of the Mg–GNP composites with addition of 0.1, 0.2, and 0.3wt.%G-15 GNPs are shown in Fig. 10 (b–d), respectively. Dimple features and uneven lines in the Mg matrices containing G-15 GNPs revealed evidence of their ductile behavior upon compressive loading. These results compliment the studies which showed a transition from brittle to mixed modes of fractures in metal matrices with addition of GNPs [59,60].
Dispersed and pulled-out G-15 GNPs were observed in the dimpled regions of the fracture surfaces as shown in inset of Fig. 10 (b–d). Pulled-out GNPs indicate an effective loadtransfer between the Mg matrices and GNP reinforcements.Uniform dimple features were observed on the fracture surface of Mg–0.3wt.% G-15 composites, indicating thepreferentially ductile fractures of this batch of composites.Fig. 10 (e–g) show the fracture surfaces of Mg–GNPs composites containing 0.1–0.3wt.% G-5 GNPs. As shown in Fig. 8e, the fracture surfaces of the Mg–GNPs composites revealed cleavage features along with dimple features, indicating mixed modes of failure in the Mg matrices reinforced with 0.1wt.% G-5 GNPs. However, agglomerated GNPs were found on the fracture surfaces of the composites containing 0.2–0.3wt.% G-5 GNPs. This is attributable to the fine particle size of G-5 GNPs and increased defect concentration in their graphitic structures during composite manufacturing,resulting in their further clustering during sintering, thus adversely affecting their reinforcing ability when dispersed in large concentrations (0.3wt.%). Fig. 11 shows the EDX elemental mapping result of GNPs dispersed in the dimpled region of the fractured surface of Mg-0.3wt.% G-15 GNPs.

Table 2 Comparison of the mechanical properties of the pure Mg and Mg-GNPs composites containing different concentrations of G-15 and G-5 GNPs.YS=compressive yield strength, UCS=ultimate compressive strength, R=strengthening efficiency.

Fig. 10. SEM images of fracture surfaces of pure Mg and Mg–GNP composites after compression testing: (a) pure Mg; (b) Mg–GNP composite containing 0.1wt.% G-15; (c) Mg–GNP composite containing 0.2wt.% G-15; (d) Mg–GNP composite containing 0.3wt.% G-15 GNPs; (e) Mg–GNP composite containing 0.1wt.% G-5; (f) Mg–GNP composite containing 0.2wt.% G-5; and (g) Mg-GNP composite containing 0.3wt.% G-5.
3.5. Strengthening mechanisms in Mg-GNP composites
Improvement in the mechanical properties of metal matrices with addition of secondary-phase carbonaceous reinforcements such as CNTs and GNPs are mostly attributed to combination of strengthening mechanisms in the fabricated MMCs [10,61–63]. Being a 2D material, GNPs exhibit a unique geometry that can contribute to the improvement of the mechanical and corrosion performance of the nanocomposites. Recently, Ahmad et al. [22] reported the wrapping and an anchor-type intricate locking of matrix grains which further hindered the pulling-out of dispersed GNPs from the metal matrices. It was proposed that during loading, the outermost layer of GNPs undergoes elastic deformation and subsequently transfers the load to the inner layers which hinders the pulling-out due to matrix grain anchoring. The major strengthening mechanisms with addition of GNPs in Mg matrices include: (i) prismatic punching of dislocations at the Mg/GNP interface due to mismatch in coefficients of thermal expansion between the Mg and dispersed GNP which leads to strain hardening of Mg matrices;(ii)grain-refinement strengthening or Hall–Petch strengthening triggered by the introduction of dispersed fine particles such as GNPs into Mg matrices; (iii) dispersion strengthening by Orowan looping across secondary-phase reinforcements in Mg matrices such as GNPs which inhibits dislocation motions, thus contributing to strengthening of the metal matrices; and (iv) interfacial load-transfer strengthening contribution from the Mg matrix to the reinforcing GNPs. In this study, the contributions by these various strengthening mechanisms to yield strength of Mg–GNP composites were quantified.

Fig. 11. EDX elemental mapping result of Mg-0.3wt.% G-15 GNPs: (a) SEM image showing the GNPs in dimpled region of fractured surface, (b) EDX spectra obtained from the GNPs and Mg matrix marked “X” and “Y” in (a), respectively, and (c) EDX layered map result of GNPs in Mg matrix and the corresponding elemental maps of Mg and C.
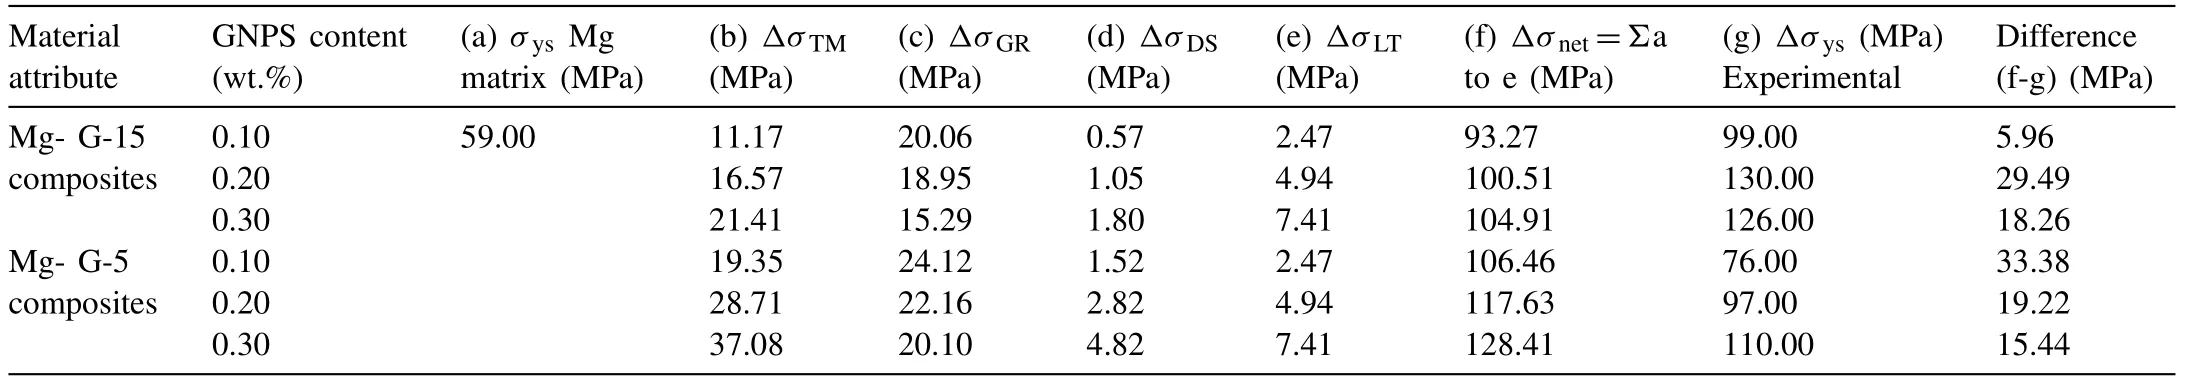
Table 3 Contribution of various strengthening mechanisms in the compressive yield strength of 0.1–0.3wt.% GNPs reinforced Mg composites fabricated via powder metallurgy (average values are reported).
3.5.1. Thermal mismatch strengthening
The contribution of thermal-mismatch strengthening(△σTM)mechanism in the compressive σys of Mg–GNP composites can be quantified by [64]:

where k (material constant) is 1.25 for Mg, G=16.60GPa(shear modulus of Mg),b=0.321nm(Burgers vector for Mg),△T (difference in sintering and property testing temperatures,△C (difference in coefficient of thermal expansion between GNPs, CTEGNPs=5×10⁻⁶ K−1and CTEMg=25×10–6 K−1[29,30], VGNPs(volume fraction of GNPs in Mg matrix),and dGNPs(particle size of GNP reinforcements) ∼15μm for the G-15 and 5μm for the G-5 GNPs used in this study. The contributions to the strengthening of the Mg matrices from thermal-mismatch strengthening modes are summarized in Table 3. It should be noted that thermal-mismatch strengthening in Mg–GNP composites mainly depends upon the particle sizes and volume fraction of the GNPs in the Mg matrices.The contributions to the compressive yield strength of the composites from thermal-mismatch strengthening mode were measured as 21MPa and 37MPa with addition of 0.3wt.% of G-15 and G-5 GNPs in the Mg matrices, respectively.
3.5.2. Grain refinement strengthening

The contribution of grain-refinement strengthening(△σGR)in the σysof Mg–GNPs composites can be measured using[10]:where ϭo(friction stress for Mg) and k (materials constant for Mg) been reported in previous studies as 11MPa and 0.21MPa/m−1/2, respteively [65] and D is the (average grain size) of the Mg-GNP composites.
The values of △σGRof Mg–GNP composites containing 0.1–0.3wt.% G-15 GNPs were calculated higher to be higher for the Mg matrices reinforced with lower content (0.1wt.%)of GNPs in both batches of composites.It is worth mentioning that a lower content (0.1wt.%) of GNPs in the Mg matrices resulted in minimum defects in their graphitic structure and their uniform dispersion in the Mg matrices which enabled them to disperse homogeneously along the grain boundaries thus contributing to the grain refinement of the Mg matrices.
3.5.3. Dispersion strengthening
Reinforcing metal matrices with carbon nanomaterials,i.e.,GNPs exhibit the potential to strengthen Mg matrices by hindering dislocations by forming Orowan loops around dispersed GNPs. The dispersion strengthening (△ϭDS) contribution to σysof Mg–GNPs composites can be evaluated using[66]:
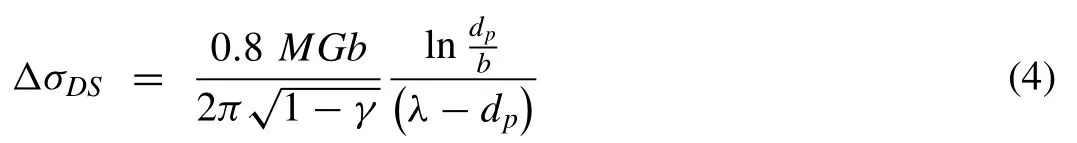
where M=6.5 (Taylor factor for a-Mg), G=16.60GPa,b=0.321nm, dp (particle size of reinforcing GNPs) was 15μm for the G-15 and 5μm for the G-5 GNPs, υ=0.35(Poisson’s ratio of the Mg matrix), and λ (the distance between two GNPs particles in the Mg matrix). The distance between individual GNP particles can be estimated using[67,68]:

The contributions to the σysof Mg-GNP composites from dispersion strengthening by G-15 and G-5 GNPs in the Mg matrices are summarized in Table 3 along with the other strengthening mechanisms. It should be noted that the minor contributions from dispersion strengthening to the σys of the Mg–GNPs composites were due to the presence of largesized GNPs(15μm and 5μm)in the Mg matrices as previous studies have shown that strengthening effects are mainly triggered by the presence of nano-scale reinforcements in metal matrices [10,57].
3.5.4. Load-bearing capabilities of GNPs in Mg matrices
In MMCs, load is transferred from metal matrix to the dispersed reinforcements. Interfacial bonds between the matrix and reinforcements play major role in strengthening the matrices through effective load transfer to the reinforcements. The contribution of load-bearing capabilities of GNPs (△ϭLT)) in the σysof Mg–GNP composites can be estimated using [30]:

Results from the contributions of the load-transfer strengthening modes to compressive yield strength revealed that these contributions are directly associated with the content of GNPs in the Mg matrices, irrespective of their particle size, structural integrity, and quality of their dispersions in the Mg matrices. Measurements of these strengthening modes in Mg–GNP composites are helpful in estimating the improvements in yield strength of the Mg matrices with addition of GNPs.The net strengthening of the Mg matrix by considering the mentioned strengthening mechanisms can be given by:

From the results summarized in Table 3, it should be noted that addition of GNPs strengthened the Mg matrices by several strengthening mechanisms; however, the contributions from thermal-mismatch and grain-refinement strengthening modes play major roles in improving the mechanical properties of these composites. As shown in Table 3, contributions from several strengthening modes to the compressive yield strength of the Mg–GNP composites revealed a close match with the experimental values which complements the validity of these strengthening mechanisms.
3.6. In vitro corrosion behavior of Mg–GNP composites
The poor CR of Mg alloys impedes their application as biodegradable medical implants. Three main reasons for the poor CR of Mg and its alloys are: (i) Mg is reactive; (ii) Mg alloys have inadequate ability to protect surface film formation during their immersion in chloride containing aqueous solutions; and (iii) the secondary phases in Mg alloys, i.e.,intermetallic phases, trigger micro-galvanic reactions by becoming cathodic sites during their corrosion testing in aqueous solutions. The overall corrosion mechanisms of Mg and formation of corrosion products are governed by the following anodic and cathodic reactions and subsequent formation of corrosion products [69]:

Fig. 12a shows the Tafel polarization curves of the pure Mg and Mg–GNP composites reinforced with 0.1– 0.3wt.%G-15 GNPs after 2h immersion in Hanks’solution.As seen in Fig. 12a, corrosion potential decreased with the addition of 0.1–0.3wt.% G-15 GNPs in the Mg matrices showing the potential of dispersed GNPs to improve the CR of Mg matrices.The CR of the pure Mg and Mg–GNP composites can be observed from the values of icorrand CR, as listed in Table 4.CR from the analysis of PD polarization curves can be calculated from [70]:

Where icorris the corrosion current density, M is the molecular weight, V is the valence number, and ρ is the measured density of the fabricated composites.
The parameters from electrochemical tests were measured for pure Mg and Mg–GNP composites from the Tafel fits of potentiodynamic polarization curves using EC Lab software.A low Icorrrepresents high CR in electrochemical corrosions tests. Compared to Mg–GNP composites reinforced with 0.1 and 0.2wt.% G-15 GNPs, CR of Mg–0.3wt.% GNPs was observed to be the lowest. These results are in agreement with previous studies which reported improvements in CR of metals containing GNPs [70,71]. Enhancements in CR in metals with addition of GNPs has mainly been attributed to the formation of excellent passivation layers. Fig. 10b shows the electrochemical polarization curves of the pure Mg and Mg–GNP composites reinforced with 0.1– 0.3wt.% G-5 GNPs.Compared to the Mg–G-15 GNP composites,addition of 0.2–0.3wt.% G-5 GNPs in the Mg matrices resulted in increased values of corrosion current densities at increased potentials and the CR of these composites was measured to be lower than that of the composites reinforced with same concentrations of G-15 in the Mg matrices. This is mainly attributable to agglomeration and subsequent defects in the G-15 GNPs when dispersed in higher concentrations (0.2– 0.3wt.%) in the Mg matrices. Agglomeration of GNPs in metal matrices adversely affects their anti-corrosion abilities.
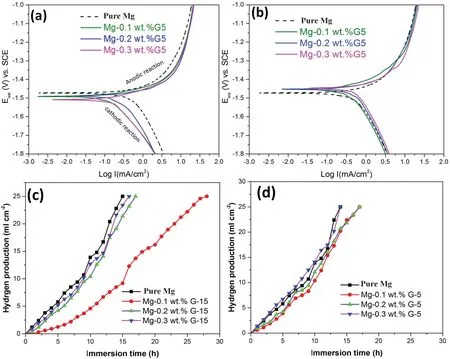
Fig. 12. Corrosion behavior of the pure Mg and Mg–GNP composites containing various concentrations of G-15 and G-5 GNPs: (a) polarization curves of pure Mg and Mg-0.1–0.3wt.% G15 composites; (b) polarization curves of pure Mg and Mg-0.1–0.3wt.% G5 composites; (c) hydrogen production by pure Mg and Mg-0.1–0.3wt.% G-15 composites on soaking in Hanks’ solution; and (d) hydrogen production by pure Mg and Mg-0.1–0.3wt.% G-5 composites on soaking in Hanks’ solution.
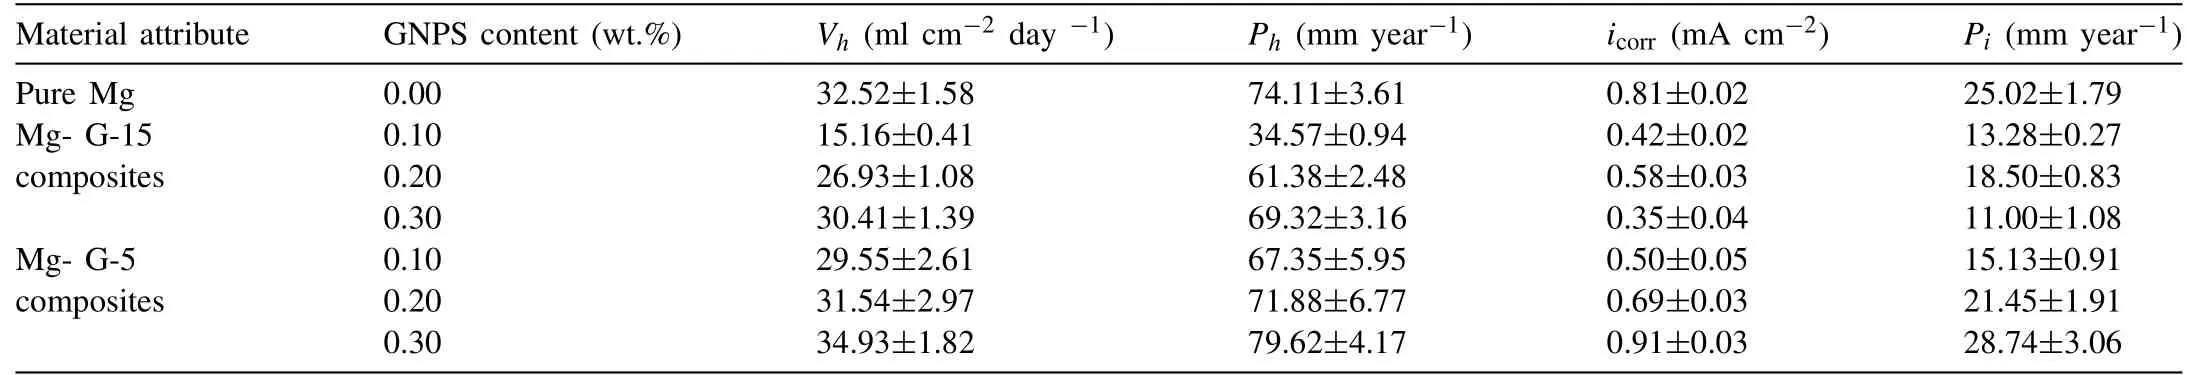
Table 4 Corrosion rates of the pure Mg and Mg-GNPs composites reinforced with 0.1–0.3wt.% G-15 and G-5 GNPs in Hank’s solution calculated from hydrogen evolution and electrochemical tests.
As discussed in earlier sections, defect concentrations in the G-5 GNPs were measured to be higher than in the G-15 GNPs as shown in the Raman spectra obtained from these composites (Fig. 7). Defect zones in GNPs in the form of vacancies and broken edges carry the potential to become reactive sites on which neighboring GNPs preferentially attach and form agglomerates in metal matrices. In this study,a higher concentration of GNPs contributed to a more effective strengthening the Mg matrices by various strengthening mechanisms, however, a higher concentration of GNPs also leads to more stacking faults and localized agglomerations of GNPs which adversely affect the corrosion resistance (CR) of Mg matrices. Thus, Mg matrices containing a lower concentration of GNPs (0.1wt.%) showed a higher corrosion resistance. Considering the high electrical conductivity of GNPs,these aggregates in metal matrices can trigger galvanic coupling between reinforcements and surrounding metal matrices by forming a conductive network. These results are in agreement with previous studies in which higher concentrations of GNPs (0.5–3wt.% GNPs) adversely affected the CR of metal matrices [72,73]. As shown in Eq. (9), the cathodic partial reaction in Mg corrosion evolves hydrogen (H2) gas and localized passivation by forming hydroxide (OH) layers.Therefore, in situ H2evolution during in vitro corrosion tests of Mg alloys can be calculated as their degradation rates (PH)in Hanks’ solution using [35]:

Where VH(ml cm−2day−1) is the total volume of hydrogen evolved over the total immersion GNPs are generally characterized as a pristine 2D single atomic sheet of sp2hybridized carbons; as such the coexistence of sp3carbons in the graphitic lattice can be classified as disorders,where these defects can be found on the basal edges of GNPs or in vacancies. A previous Raman spectroscopy study on GNPs has shown that the characteristic D band is associated with nonsp2defects in the C–C bonds of GNPs, whereas the G band is generally attributed to the in-plane stretching mode of C–C bonds in GNPs, or to the degree of graphitization or crystallinity of GNPs [49].
Hydrogen evolution tests of the pure Mg and Mg–GNP composites reinforced with 0.1–0.3wt.% G-15 and G-5 GNPs were conducted to investigate the variations in corrosion rates as shown in Fig. 12 (c–d), respectively. The Mg–0.1wt.% G-15 composite displayed the lowest H2evolution rate in Hanks’solution, while the other Mg-(0.2–0.3) wt.% G-15 composites showed lower H2evolution rates as compared to pure Mg. These results are consistent with results of corrosion current density (Icorr) measurements from polarization tests which revealed the evolution of H2gas bubbles increased at lower electrochemical potentials. The unique graphitic structure of GNPs provides them with extraordinary ability to store H2gas. There are two underlying mechanisms in the H2absorption by GNPs: (i) physisorption mechanism, in which H2molecules attach onto GNPs due to the presence of strong vdW attracting forces; and (ii) chemisorption, in which H2atoms form chemical bonds with the C atoms in GNPs [74].The results of slower hydrogen release in Mg–GNP composites are well-supported by recent advances in which GNPs have been established as impermeable atomic membranes to inhibit release of gas molecules. It has been established that thin membranes like GNPs allow atomic-level sieving of gases, liquids, and dissolved ions [14,75]. Therefore, GNPsdecorated Mg particles assist in H2uptake due to their underlying surface modifications at particulate levels.
Compared to Mg–GNP composites reinforced with 0.1–0.3wt.% G-15 GNPs, the Mg–GNP composites with same concentrations of G-5 GNPs showed slightly higher H2production rates as shown in Fig.12d.This may be attributable to defects in GNPs due to their agglomeration in these batches of composites thus adversely affecting their corrosion properties.Increased non-sp2defect concentration in the Mg-0.3wt.% G-5 composites adversely affected their molecular sieving ability eventually leading to slightly higher H2evolution rates.Fabricated pure Mg and Mg–GNP composites containing 0.1–0.3wt.%G15 and G-5 GNPs were soaked in Hanks’solutions at 37°C for 24h and the morphologies of corroded samples are shown in Fig. 13. Pure Mg (Fig. 13a) suffered severe attacks from the Hanks’ solution as most of the central regions on the surfaces of the samples were dissolved leaving deep grooves on the samples. However, the Mg–GNP composites reinforced with 0.1wt.%G-15 and G-5 GNPs showed the best CR in the same corrosion environment. Although pitting corrosion occurred on the surfaces of the Mg–GNP composites reinforced with 0.1wt.% GNPs, these composites revealed intact surfaces.

Fig. 14. Corrosion products on pure Mg and Mg–GNP composites: (a) XRD patterns of corroded pure Mg and Mg–GNP composites reinforced with 0.1–0.3wt.% G-15 GNPs; (b) XRD patterns of corroded pure Mg and Mg–GNP composites reinforced with 0.1–0.3wt.% G-5 GNPs; (c) evolution of DSC curve of corroded Mg-0.1wt.% G-15 GNP composite.
The corroded pure Mg and Mg–GNP composites were further characterized by XRD (Fig. 14) to identify the corrosion products on the corroded surfaces. The XRD patterns of the corroded samples revealed characteristic Mg(OH)2and MgO peaks in the corroded Mg-0.1–0.3wt.% G-15 and Mg-0.1–0.3wt.% G-5 composites as shown in Fig. 14 (a,b), respectively. These results are in agreement with previous studies on the corrosion of Mg alloys which showed the formation of a thin inner layer of MgO covered with a porous Mg(OH)2layer externally formed on corroded Mg alloys surfaces on their exposure to chloride-containing mediums [69,76]. In addition to characteristic Mg(OH)2, MgO, and Mg peaks,the XRD patterns (Fig. 14a) obtained from the corroded Mg–0.1wt.% G-15 composites revealed peaks at 2θ=27.99°,35.80°, 40.01°, and 54.59° associated with the stable tetragonal crystalline structure of magnesium hydride (β-MgH2)phases. Recent studies on MgH2,have reported the tremendous potential of this phase for solid-state H2storage applications[77,78].However,the structure of MgH2itself and its instability impede its utilization in practical applications.Huang et al.[79]also demonstrated that MgH2particles nucleate and uniformly grow on GNPs via the hydrogenolytic transformation of a di-n-butyl magnesium ((C4H9)2Mg) phase thus providing stability to MgH2phases. Their study established that the corrosion of Mg in chloride-containing solutions triggers the production of soluble ions. The release of Mg ions and H2from corroded Mg substrates triggered the formation of(C4H9)2Mg on GNPs surfaces and its decomposition under H2pressure generated from the substrates initiated in situ MgH2formation during the corrosion of the Mg–0.1wt.%G-15 composites. These results are in agreement with previous studies which reported the application of carbon reinforcements such as graphite and exfoliated GNPs in Mg matrices to be used as substrates for the anchoring of MgH2particles [79,80].
Because of MgH2formation, the Mg–0.1wt.% G-15 composites revealed slower H2evolution rates as shown in Fig.12c.However,clustering and subsequent defect formation in the G-15 and G-5 GNPs adversely affected their H2storage capabilities due to the lack of MgH2phases as revealed by the XRD patterns obtained from these samples (Fig. 14(a,b)). The formation of a MgH2phase in the Mg–0.1wt.%G-15 GNPs was further investigated by its thermal decomposition through differential scanning calorimetry (DSC)study of this composite as shown in Fig. 14c which resulted in endothermic events at 400°C and 440°C, corresponding to the decomposition of β-MgH2[80] and Mg(OH)2[81],respectively. Fig. 15 shows a schematic illustration of the process involved in the in situ formation of the MgH2phase in Mg–GNP composites during their corrosion in Hanks’solutions. This process involves: (i) H2and Mg++evolution in Mg–GNP composites because of their exposure to cations,organic substances, and anions in Hanks’ solutions; (ii)degradation of Mg matrices and formation of corrosion products in the form of Mg(OH)2and MgO; and (iii) formation of (C9H4)2Mg on GNP surfaces and subsequent formation of MgH2phases and their anchoring on GNPs. This study has explicated a systematic manufacturing route for GNP addition into Mg matrices and their promising contributions to the mechanical and corrosion properties of Mg-based composites.

Fig. 15. Schematic illustration of corrosion mechanism of Mg–GNP composites, in situ MgH2 phase formation, and its anchoring on GNP surfaces during evolution of H2 from Mg immersed in Hanks’ solution.
3.7. Cytotoxicity assessment of Mg- (0.1– 0.3wt.%) G-15 composites

Fig. 16. Cell viability (CVR) of pure Mg and Mg-(0.1–0.3wt.%) G-15 composites. CVR values presented as relative to the control.
The in vitro cytotoxicity of the pure Mg and Mg-(0.1–0.3wt.%) G-15 composites was investigated by evaluating the viability of SaOS2 cells.Fig.16 shows the cell viability ratios(CVR)for various extracts.For comparison,the control group(empty well) was considered as non-toxic, with a CVR=1.From CVR analysis it is evident that G-15 GNPs additions did not significantly affect the cytotoxicity of the pure Mg,however, a statistically significant (P < 0.05) increase in the Mg–GNP composites reinforced with 0.2–0.3wt.%GNPs was noted for the composites reinforced with lower concentrations of GNPs (0.1wt.%). The CVR values for the pure Mg and Mg-0.1wt.% G-15 composites were measured as 1.01 and 1.13, respectively, showing an increase of 12% in cell viability by addition of 0.1wt.% GNPs in Mg matrices. The Mg–0.1wt.% G-15 exhibited higher cell viability than the Mg–GNP composites containing higher G-15 content (0.2–0.3wt.%) which may be attributable to lower H2evolution rates in the Mg–0.1wt.% G-15 composites thus not significantly altering the pH value of the cell culturing medium.Low corrosion rates of Mg-G-15 GNPs composites are also associated with the lower release of metal ions in the cell culturing medium. These results are in agreement with previous studies [82,83], which have reported the positive biological impact of GNPs as they exhibited nontoxicity and significantly promoted the adhesion and differentiation of osteoblasts and MSC type human cells even in the absence of commonly used growth factors, e.g., bone morphogenetic protein 2 (BMPs-2).
4. Conclusions
This study has investigated the microstructure, mechanical, corrosion, and biological properties of newly developed Mg–GNP composites containing different concentrations(0.1–0.3wt.%) of two different GNP systems fabricated via powder metallurgy routes. The effects of various GNP additions, changes in their characteristic sp2graphitic structures,and subsequent strengthening mechanisms in the Mg matrices have been established in conjunction with their mechanical,corrosion, and biological properties. Efforts have been made to establish relationships between the structural integrity of GNPs during synthesis of Mg-GNP composites and the resultant mechanical, corrosion, and biological properties, and underlying strengthening mechanisms in fabricated Mg–GNP composites processed by PM. The strengthening efficiency of GNPs was evaluated in conjunction with their content and the degree of their graphitization in the fabricated composites.Conclusions are as follows.
(1) Addition of GNPs enhanced the mechanical properties and corrosion resistance of Mg–GNP composites as compared to pure Mg fabricated under similar processing conditions. No intermetallic phases (carbides)were observed in the fabricated composites which illustrates the chemical stability of GNPs in Mg matrices under the adopted processing conditions.
(2) The graphitization-induced nano-structural transformations in GNPs reinforced in Mg matrices influence the resultant microstructures and mechanical,corrosion,and biological properties of the Mg–GNP composites.
(3) Enhancement of the mechanical and corrosioninhibiting performances and biological properties of GNPs are associated with their initial layer thickness,dispersion in Mg matrices, and retention of their structural integrity during composite-processing, and dispersion stages in the Mg matrices.
(4) Compared to pure Mg, Mg–GNP composites reinforced with 0.1wt.% G-15 and G-5 GNPs showed the best corrosion resistance in the same corrosion environment.
(5) In situ formation of a MgH2phase in Mg–GNP composites containing lower concentrations (0.1wt.%) of G-15 GNPs in the Mg matrices resulted in slower H2production rates and lower Icorrvalues.
(6) Synergetic contributions from various strengthening mechanisms were quantitively measured in the fabricated Mg–GNP composites. Contributions to thermal mismatch and grain refinement were observed as the major strengthening factors in the Mg matrices reinforced with GNPs.
(7) In vitro cytotoxicity assessment of the fabricated Mg–GNP composites revealed no significant adverse effects with addition of GNPs in Mg matrices. The Mg matrices containing uniformly dispersed GNPs with lower defect concentrations exhibited higher values of CVR as compared to the pure Mg and Mg–GNP composites containing higher concentrations (0.2–0.3wt.%) of GNPs.
Considering the mechanical, corrosion, and in vitro biological properties of the Mg–GNP composites, the present study encourages further studies to be carried out on the use of GNPs as a candidate reinforcing material for pure Mg. In particular, further in vivo studies are necessary to validate the suitability of these materials for orthopedic applications.
Declaration of Competing Interest
None.
Acknowledgments
The authors acknowledge the financial support for this research by the Australian Research Council(ARC)through the Future Fellowship (FT160100252) and the Discovery Project(DP170102557). The authors also acknowledge the scientific and technical assistance of RMIT University’s Microscopy and Microanalysis Facility (RMMF), a linked laboratory of the Australian Microscopy & Microanalysis Research Facility.
杂志排行

Journal of Magnesium and Alloys的其它文章
- Influence of trace As content on the microstructure and corrosion behavior of the AZ91 alloy in different metallurgical conditions
- Active corrosion protection of super-hydrophobic corrosion inhibitor intercalated Mg–Al layered double hydroxide coating on AZ31 magnesium alloy
- The role of recrystallization and grain growth in optimizing the sheet texture of magnesium alloys with calcium addition during annealing
- Fatigue strength evaluation of self-piercing riveted joints of AZ31 Mg alloy and cold-rolled steel sheets
- Corrosion fatigue of the extruded Mg–Zn–Y–Nd alloy in simulated body fluid
- On the dynamically formed oxide films in molten Mg