Spatiotemporal Change of Agrometeorological Flood Disasters in Heilongjiang Province
2020-04-28ShiFengmeiPeiZhanjiangLuBinyuWangSuGaoYabingLiuJieWangQuanhuiandHuangBo
Shi Feng-mei ,Pei Zhan-jiang ,Lu Bin-yu ,Wang Su ,Gao Ya-bing ,Liu Jie *,Wang Quan-hui,and Huang Bo
1 Rural Energy and Environmental Protection Institute,Heilongjiang Academy of Agricultural Sciences,Harbin 150086,China
2 Key Laboratory of Combining Farming and Animal Husbandry Ministry of Agriculture,Harbin 150086,China
3 Key Laboratory of Energy Utilization of Main Crop Straw Resources,Harbin 150086,China
4 Rural Energy and Environment Agency,Ministry of Agriculture and Rural Affairs,Beijing 100125,China
5 Center of International Cooperation Service,Ministry of Agriculture and Rural Affairs,Beijing 100125,China
Abstract: Agrometeorological disasters severely impact agriculture in Heilongjiang Province. Flood is one of the main agrometeorological disasters in Heilongjiang Province. The temporal change in flood events in Heilongjiang Province from 1986 to 2015 was studied using Mann-Kendall and Morlet wavelet methods,respectively. The results of Mann-Kendall analysis showed that the disaster rates of flood gradually stabilized from 1986 to 2015 with a confidence level of 99%. The Morlet wavelet variance analysis revealed that disaster rates of flood changed periodically at time scales of 3a,7a and 18a in Heilongjiang Province during 1986-2015. The dominant period of the variation of flood disaster rate was about 18a over the past 30 years. The flood disaster rates were indicated in a positive phase during the period of 2016-2020 by the fitting curve of Morlet wavelet analysis. The annual average flood disaster indexes of single station,during 1986-2015 years were calculated,according to the precipitation data at 31 stations in Heilongjiang Province and the GIS software was used to analyze the spatial change in flood disasters in Heilongjiang Province from 1986-2015. The results demonstrated that the southwest area of Heilongjiang Province was highly hazardous region of flood. The flood indices in the northern part of Songnen Plain and southwest of Heilongjiang Province presented the increment trends.
Key words: flood disaster rate,temporal and spacial change characteristic,Mann-Kendall method,Morlet wavelet method
Introduction
Agrometeorological disasters generally refer to abnormal climate events resulting in dramatic decrease of crop yield. Meteorological disasters include drought,flood,hail,chilling injury,typhoon and so on (Wanget al.,2011; Liet al.,2010). Heilongjiang Province is one of the major agricultural provinces in China.The agrometeorological disasters affect the economic development and food security (Zhou,2010; Tang and Zhang,2013; Liet al.,2010). Present studies showed that flood is the main agrometeorological disaster in Heilongjiang Province (Tang and Zhang,2013;Guo and Zhang,2014; Wanget al.,2016). At present,the flood disaster frequency (Yanget al.,2016; Guet al.,2017) and flood index (Zhanget al.,2015; Juet al.,1997) are usually used to assess flood disasters or divide flood disaster zones. The frequency of flood disasters can not reflect the real damage intensity,and the weight assignment can affect the reasonable expression of flood damage level. Hence,most of the studies failed to reveal the regularity and multi-scale changes of the agrometeorological flood disasters in Heilongjiang Province. Therefore,in this study,Mann-Kendall (M-K) and Morlet wavelet methods were used to investigate the multi-scale temporal variation in flood disasters,during the 1986-2015 in Heilongjiang Province. Then,the relationship between the flood number and flood disaster rate was established to determine the weight according to the percentage of abnormal precipitation. The flood indexes were later calculated. Therefore,the flood index could reasonably reflect the damage intensity of flood. Finally,the spatial change in agrometeorological flood disasters in Heilongjiang Province was analyzed using GIS software. The results could provide theoretical supports for the sustainable agriculture and the alleviation of flood disasters in Heilongjiang Province.
Data Collection and Analysis Methods
The precipitation data at 31 stations from 1986 to 2015 in Heilongjiang Province were provided by Heilongjiang Province Meteorological Station. The data of flood disaster were mainly obtained from "Database of Plantation Management of Ministry of Agriculture and Rural Affairs of the People's Republic of China".The disaster rate was estimated as the ratio of the areas with crop yield reducing by less than 90% of normal yield to the sown areas (Jiang,2000). The disaster rate could avoid the influence of the sown area over the past years and reflect the extent of damage of flood disasters (Yanget al.,2014).
According to the disaster data over the past 30 years in Heilongjiang Province,the temporal change in flood disaster rate was studied by M-K and Morlet wavelet methods. The flood indexes were calculated and the spatial change characteristics were fitted by GIS software.
Mann-Kendall method
M-K method was used to analyze the change trend and abrupt change points of flood disaster rates in Heilongjiang Province during the last 30 years. The method had been deployed in some studies (Zhanget al.,2014). It was assumed thatH0was a time sequence {Xi|i=1,2,…,n}.Xiwas a random,independent variable with the same distribution probability.H1was the alternative hypothesis: for all thei,whenj≦Nandi≠j,theXiandXjhad different distributions. Then the statisticSwas calculated as the followings:

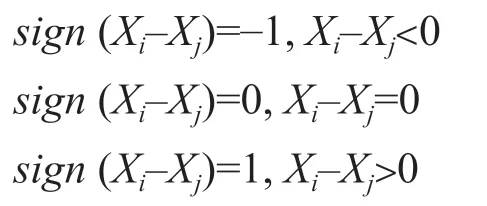
The value ofsign(Xi-Xj) might be 1,0 or 1:

The variance of the statisticSwas:

The statistic check digit (Z) could be calculated as the followings:

The flood disaster rates increased ifZwas greater than 0. While the flood disaster rates decreased ifZwas less than 0. If |Z|was equal to or greater than 1.28,1.64 and 2.32,the change trends of flood disaster rate were significant at thep=0.1,0.05 and 0.01 levels,respectively.
M-K method could be used to investigate the abrupt change points of flood disaster rates in Heilongjiang Province during 1986-2015. The disaster rate was supposed to be time sequence {Xi|i=1,2,…,n},andmiwas the accumulative number of samples withXi>Xj

The combination of (k,dk) was constructed with differentk(2≤k≤n). If the original sequence was randomly independent,the mathematical expectationE(dk) and varianceVar(dk) were calculated according to the following equation,respectively:

Anddkwas standardized as the following:

The original time sequence changed in an increasing trend ifUFwas greater than 0. Otherwise,it declined with times. If |UF| was equal to or greater than 1.96,the change trend was significant at the confidence level of 0.99.UBwas obtained by applying this method to the inverse sequence. The abrupt change point was defined as the intersection between curves ofUFandUBin [1.96,1.96].
Morlet wavelet method
Morlet wavelet method was widely used in geoscience,atmospheric science,numerical analysis and signal processing. Morlet wavelet functionφ(t) could be expressed as (Zhanget al.,2014):

Where,twas time,a;ω0was wavelet center frequency,dimensionless.
The wavelet coefficient with the time scaleaand timex(t) could be expressed as:

Where,α-time scale,a;b-time shift factor,a;φ(t)-the complex conjugate function ofφ(t).
The greater the absolute value ofWx(a,b) at a time scale was,the more significantly the time series changed at this time scale. The abrupt was the point withWx(a,b)=0 (Juet al.,2008).
Wavelet variance analysis was often used to analyze the relative fluctuation intensity and periodic variation characteristics of time series on time scales:

Calculation of flood index
The agricultural flood was evaluated using the percentage abnormal precipitation in precipitation events(Wanget al.,2008; Li and Zhou,2014),Zindex(Wanget al.,2017) and standardized precipitation index SPI (Yanget al.,2016). A study by Zuet al.(1996) showed that floods mainly occurred during the period from May to August in Heilongjiang Province.According to their results on the drought assessment standard,the abnormal precipitation percentage during April-August at 31 stations in Heilongjiang Province in recent 30 years were calculated. The percentage of abnormal precipitation was calculated according to the equation as the followings (Wanget al.,2008):

Where,Ri- the abnormal precipitation percentage in theith year,%;Pi- the observed precipitation in theith year,mL;the value of precipitation,mL.
Referring to Table 1,the number of floods at all the levels at each site was obtained (Dinget al.,2017).Secondly,multiple linear fitting was carried out by using the flood disaster rates of Heilongjiang Province and the number of disasters at all the levels:

Where,Y-flood disaster rate,%;
a0-constant;a1,a2,a3anda4-coefficients of flood at mild,moderate,severe and catastrophic levels,respectively,which were above zero;N1,N2,N3andN4-the numbers of flood at mild,moderate,severe and catastrophic levels,respectively.
Then weight coefficientwi,annual average flood index at single station f and annual average flood index of provinceFcould be calculated as the followings(Zhanget al.,2015):

Where,wi-weight coefficient of floods at every level;f,F-flood index of single station and the whole province,respectively;ni,Ni-flood frequency at every level of single station and the whole province,respectively;k,M-number of years and stations,respectively.
Then,the spatial distribution of flood index in Heilongjiang Province was analyzed by GIS software.

Table 1 Flood grade classification of precipitation anomaly percentage index (monthly and seasonal scale)
Results
Temporal distribution characteristics of agrometeorological flood disaster rates in Heilongjiang Province
M-K test of flood disaster rates
The interannual variation of the disaster rate of flood in Heilongjiang Province in the last 30 years is shown in Fig. 1a. The flood disasters had a decline trend with the rate of 5.1%/10 year. The flood disaster rate had strong amplitudes during 1986-1998 and weaker amplitudes in 2000-2012. Agricultural flood disasters mainly occurred in 1980s and 1990s. The maximal flood disaster appeared in 1988,which was 40.5%,the minimal one was 0.32% in 2000. The statisticsSandZwere both less than 0,and |Z| equaled 2.43 which was little above 2.32. It meant that the flood disaster rates decreased at 99% confidence level.
The abrupt change point of flood disaster rate is shown in Fig. 1b.UFintersectedUBon the domain[1.96,1.96],which meant that the "sudden change"of flood disaster rates in Heilongjiang Province took place during 1994-1995. From the value ofUF,it was concluded that the flood disaster rates decreased since 1989,and decreased remarkably in 1999-2015.The fluctuation of flood disaster rates had close connection with precipitation of that period. The precipitation in 1986-1998,1999-2007 and 2007-2014 had the trends of markedly increasing,descending and slightly increasing,respectively (Guet al.,2017).The air temperature was higher and the precipitation became less than those in normal years in Heilongjiang Province since 1990s (Wanget al.,2016; Su and Zhang,2011). In addition,in recent years,the construction of water conservancy facilities and the ability of disaster prevention in Heilongjiang had been significantly improved. Thus,the disaster rates had notable decrease since 1999 (Liet al.,2010; Zhang,2011).

Fig. 1 M-K analysis of disaster rate of flood in Heilongjiang Province during 1986-2015
Wavelet analysis of flood disaster rates in Heilongjiang Province
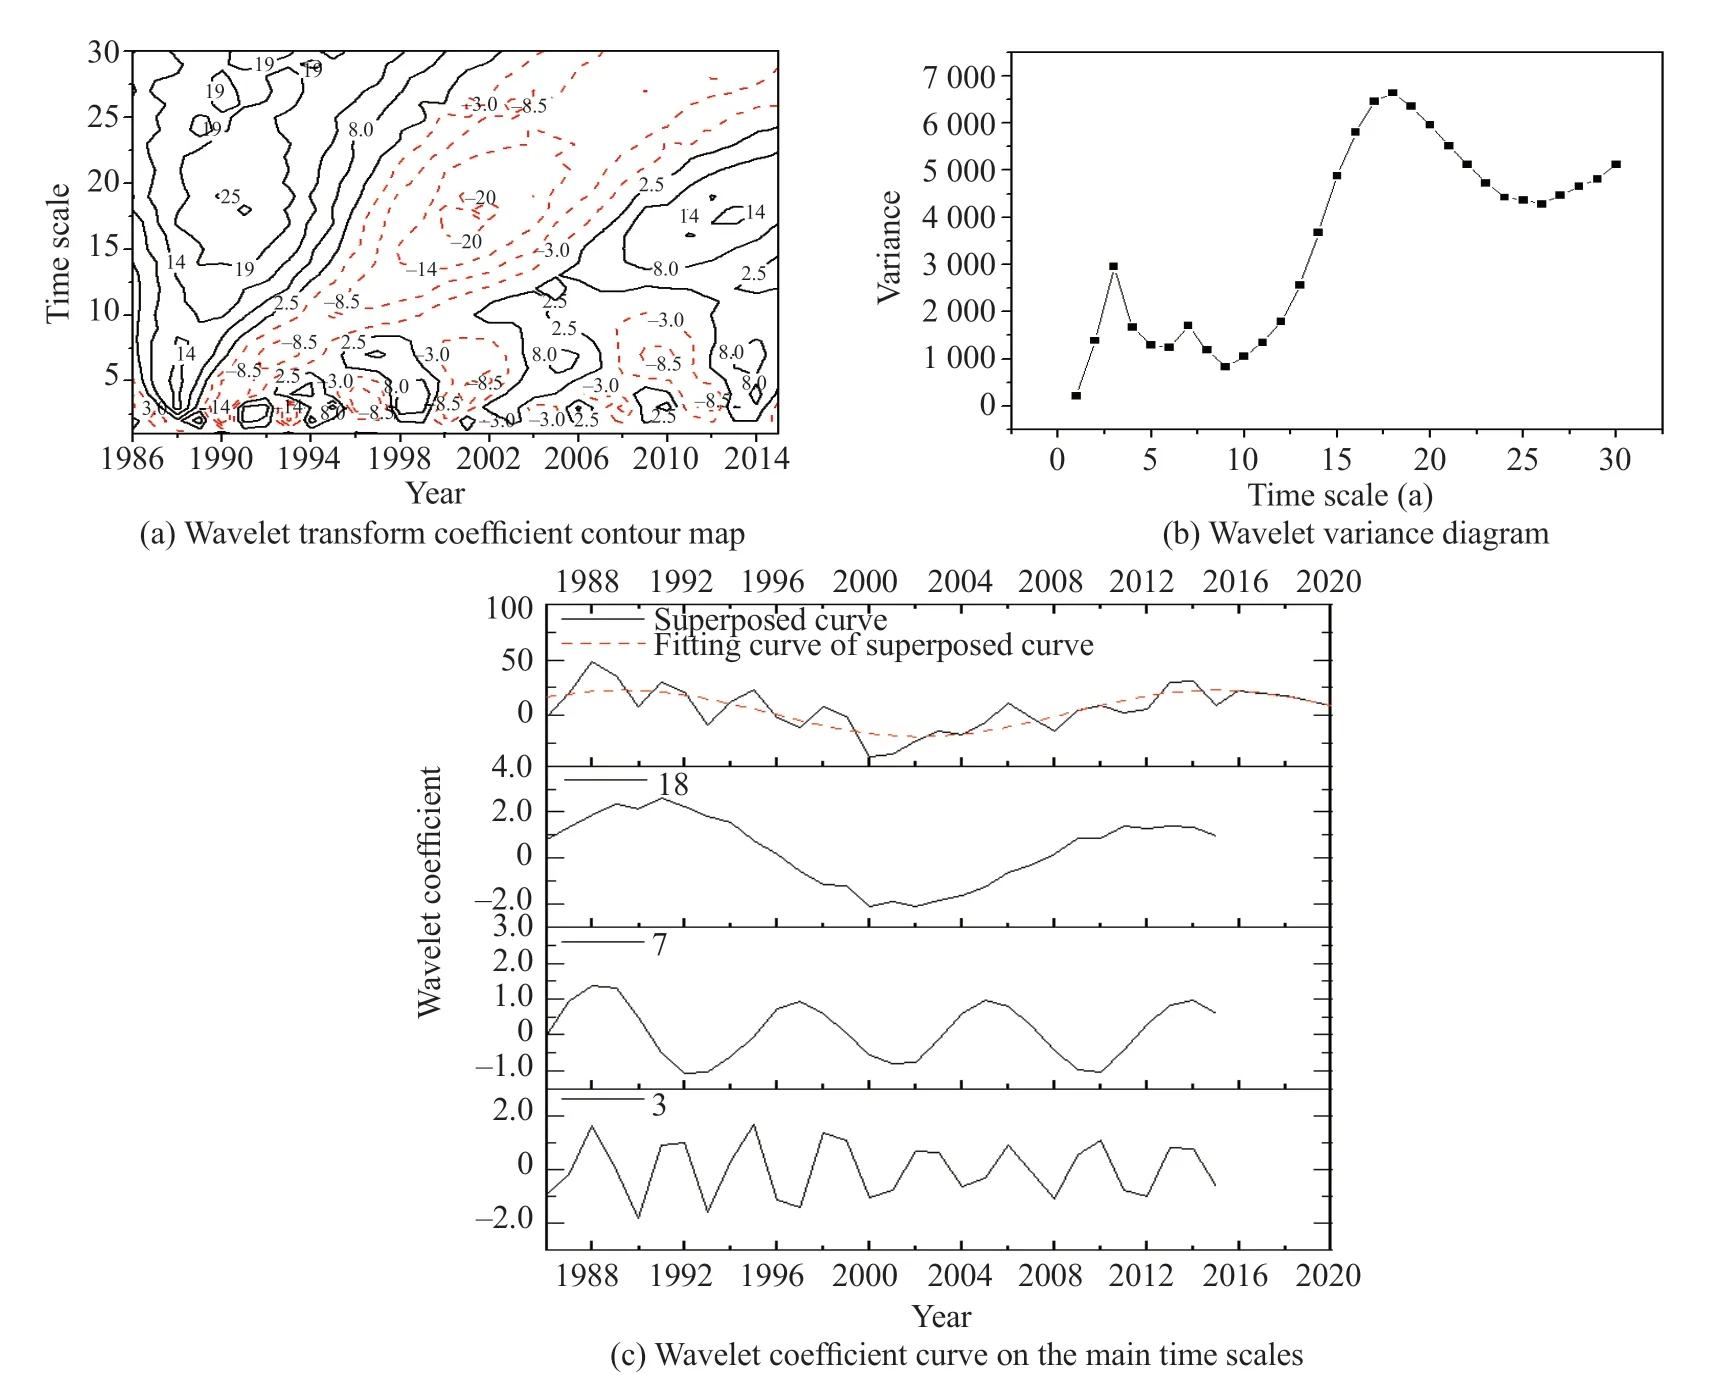
The Morlet wavelet coefficient,change period and the dominant period of flood disasters during 1986-2015 in Heilongjiang Province are shown in Fig. 2.According to Fig. 2 (a),there were periodic oscillations with time scales of 14a-25a,5a-9a and 0a-4a.The agricultural flood disaster rates changed on time scales of 10a-25a and 0a-4a during the whole research period,and the oscillation changed more periodically with a principal period of about 18a and 3a. On the time scale of 5-9a,the agricultural flood disaster rates showed strong and regular periodical change with principal period of 7a since 1994. The disaster rate of agricultural flood experienced nearly one oscillation of negative phase-positive phase on the time scale of 10-25a,and it was in positive phase from 2006 to 2015. The disaster rate of agricultural flood experienced nearly two oscillations of negative and positive phases on the time scale of 5-9a and it was in positive phase during 2012-2015. The periods of agricultural flood disaster rates were 3a,7a and 18a (Fig. 2b). The dominant period was 18a. The fitting curve wasy=2.04+20.83sin(0.245x-40.73)(Adj.R2=0.57),which was obtained by fitting the Morlet wavelet coefficients of flood disaster rates on the time scales of 3a,7a and 18a. The flood disaster rates were in the positive phase based on the fitting curve.It predicted that floods might occur during 2018-2020 and authorities should take precautions against floods.

Fig. 2 Morlet analysis results of flood disaster rates in Heilongjiang Province during 1986-2015
Spatial distribution of agrometeorological flood disaster index in Heilongjiang Province
Based on the precipitation anomaly percentage at 31 stations from 1986 to 2015 in Heilongjiang Province,the relationship between flood occurrence frequency and flood disaster rates was estimated at the confidence level of 99%,and it was expressed as the following:y=-1.93+0.024N1+0.153N2+0.33N3+0.98N4(R2=0.45).According to the formula 12-14,annual average flood disaster indexes of single station in 1986-2015 years were calculated. Then the spatial distribution characteristics of agrometeorological flood disaster rates were fittedviaGIS software (Fig. 3). The flood disaster indexes decreased gradually in the regions of Tailai County,Heihe City and Tangyuan County,respectively. The flood disaster indexes were maximum in the southwestern Qiqihar City and all of the single flood disaster indexes in this area were above 0.35,indicating that these areas were in the greatest danger of flood disasters. The annual average flood index of Heihe City,Fuyu County,Qinggang County,Anda City,Jiamusi City and Tangyuan County were all higher than 0.3,which were in the greater danger of flood. The area in yellow and light red colour could be regarded to be in moderate danger of flood. Other areas with the annual average flood index of single station less than 0.25 were in slight danger of flood. The change rate of flood disaster indexes from 1986-2015 was also calculated. If the change rate was less than 0,the area had less precipitation. The precipitation in the area with change rate more than 0 increased substantially. As shown in Fig. 3b,the risk of flood disaster in the southern,eastern and north-eastern area of Heilongjiang Province had the decrease trend with the change rate of flood disaster indexes less than 0,suggesting that the precipitation in these areas became less from 1986-2015. The change rate of more than 0 in other parts implied that the flood possibility increased in these areas.

Fig. 3 Spatial characteristics of flood indexes in Heilongjiang Province
Discussion
The relationship between the flood frequency and flood disasters was described based on the percentage of precipitation anomaly. Then,the weight coefficients and flood index were calculated. The flood disaster indexes were more suitable to reflect the flood harm than flood frequency. Hence,it could provide the theoretical supports for the agricultural production in Heilongjiang Province to adapt to the climate change.In addition,the flood disasters could be affected by topography,geology,crop species and local water conservancy facilities besides the local precipitation.It should make a comprehensive consideration of the above factors to provide recommendations to reduce local disasterand agricultural production loss effectively.
Conclusions
According to the agricultural flood disaster data during 1986-2015 in Heilongjiang Province,the interannual variation of agricultural flood disasters in Heilongjiang Province was studied with M-K test and Morlet wavelet methods. The number of flood disasters and the flood index were calculated based on the percentage of precipitation anomaly and the flood levels. Then the GIS software was used to simulate and analyze the spatial variation of the agricultural flood disasters in Heilongjiang Province. The conclusions were as the followings:
(1) The flood disaster rates in Heilongjiang Province showed a downward trend from 1986 to 2015 at the confidence level of 99%. Flood mainly occurred during 1986-1998. The flood disaster rates declined significantly after 1999,and the mutation point occurred during 1994-1995.
(2) Morlet wavelet analysis showed that the flood disaster rates changed periodically during 1986-2015,and the main period was 18a. The flood disaster rates in Heilongjiang Province would be in positive phase during 2018-2020.
(3) The southwest of Heilongjiang Province was a high hazard area of flood disasters based on the GIS simulation. Flood possibility could increase in the north and southwest of Songnen Plain. The authorities should take precautions against the risks.
杂志排行
Journal of Northeast Agricultural University(English Edition)的其它文章
- Genetic Diversity of Maturity Related Genes of Soybean During One Centurial Artificial Selection in Northeast China
- Effects of Lanthanum and Cerium on Chlorophyll Content,Yield and Components of Soybean in Northeast China
- Visualizing Patterns and Differences in Fine Particulate Matter(PM2.5) Research Between the USA and China over Last 25 Years: A Bibliometric Analysis
- Effects of Different Feeding Methods on Behaviors,Immunities and Growth Performances of Suckling Calves
- Effects of Facultative Anaerobic Cellulolytic Bacteria and Nitrogen-fixing Bacteria Isolated from Cow Rumen Fluid on Rumen Fermentation and Dry Matter Degradation in Vitro
- Effect of Zinc Acetate on Broiler Nutrient Metabolism and Skeleton Characteristic
