Visualizing Patterns and Differences in Fine Particulate Matter(PM2.5) Research Between the USA and China over Last 25 Years: A Bibliometric Analysis
2020-04-28ShanDexinGaoJiananLiuXiaoZhaoYueSunMengruiLiuLuandXuZhenxuan
Shan De-xin,Gao Jia-nan,Liu Xiao, ,Zhao Yue,Sun Meng-rui,Liu Lu,and Xu Zhen-xuan
1 College of Resources and Environment,Northeast Agricultural University,Harbin 150030,China
2 Yellow River Gaoqing Bureau,Gaoqing 256300,Shandong,China
3 Lanzhou Information Center,Chinese Academy of Sciences,Lanzhou 730000,China
Abstract: To reveal patterns in scientific research results and compare differences in studies on fine particulate matter (PM2.5)between China and the USA,6 608 publications from 1992 to 2016 were collected from the Science Citation Index Expanded (SCI-E)database and analyzed by bibliometrics. HistciteTM,BibExcel1.0.0.0,NetDraw and VOSviewer were used for statistical and visual analysis during this study. Publication outputs,journals,institutions,authors and author keywords were all analyzed to identify publication patterns,research hotspots and research trends. Based on this study,the number of publications produced in future years is expected to be at least twice that in 2016. The number of publications in China and the USA increased annually from 1992 through 2014,promoted by improved social and economic conditions. Gross domestic product (GDP) was significantly positively correlated with the number of annual articles published in China and the USA (p<0.05). Through comparative analysis,it was observed that the output of publications in the USA before 2014 was larger than that in China. The total output of PM2.5-related publications in China increased rapidly and far exceeded that in the USA after 2014. It is predicted that the leading region for research on PM2.5 in the future would be China. Analysis of author keywords indicated that "chemical composition" and "source allocation" were the main research hotspots in China and the USA. This research on exposure would be valuable in the future because of the pollution problem in China.Moreover,patterns and differences in scientific outcomes were revealed in this study and this study might provide potential guidelines for future research and management.
Key words: PM2.5,bibliometric analysis,web of Science,USA,China
Introduction
Fine particulate matter is a general term for all small airborne particles with aerodynamic diameters equal to or less than 2.5 μm (EPA,2009). Because of the detrimental and toxic effects of particulate matter on the lungs (Raaschouet al.,2013; Almeidaet al.,2010;Milara and Cortijol,2012),PM2.5pollution leads to two million deaths per year according to World Health Organization statistics (WHO,2005). Therefore,many studies with varying perspectives have been conducted by many researchers worldwide (Charron and Harrison,2005; Lelieveldet al.,2015; Duanet al.,2017). However,the characteristics of PM2.5research are rarely studied and there are few specific data supporting a bibliometric analysis. At present,there has been no bibliometric analysis to assess research differences between China and the USA. Therefore,the differences in outcome models and contributions between China and the USA were compared in this bibliometric study and the number and quality of scientific publications during the period 1992-2016 were assessed. The relationships among gross domestic product (GDP),researchers and expenditures for articles were determined and analyzed to clarify the relationship between socioeconomic factors and results. To understand the characteristics and hotspots of research in these countries,journals,institutions,authors and author keywords were analyzed to identify the differences. This study provided a reference to understand the differences between China and the USA for scientific research management departments and scientific researchers and would serve as a potential guide for future research directions.
Materials and Methods
Data collection
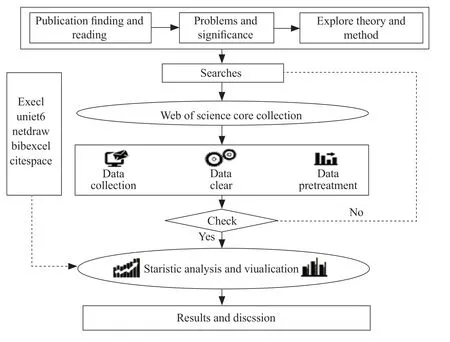
Fig. 1 Method flow chart
The main steps of data collection and analysis of this study are described in Fig. 1. Scientific output information was extracted from the Science Citation Index Expanded Database of the Thomson Reuters' ISI Web of Science (WOS; http://apps.webofknowledge.com/). The impact factor (IF) was obtained from the Journal Citation Reports (JCR) of Thomson Reuters 2015 (http://www.jcr-explorer.org/). GDP data were obtained from the National Accounts Main Aggregates Database (https://Unstats.un.org). Data for researchers and expenditures were obtained from the World Bank (http://data.worldbank.org/indicator). "PM2.5","PM-2.5*" or "PM (2.5)" was used as a search phrase to identify all the publications containing these terms in the titles,abstracts or keywords on January 20,2017.The contributions of different countries,institutions and authors were based on the affiliation of at least one author of the published papers. Documents from Hong Kong were included in China. Based on the online versions of SCI and SSCI,a total of 13 311 PM2.5-related publications were identified.
Data analysis
Five data analysis methods were implemented in this study. First,the numbers of publications were determined. Second,the average number of citations of publications was analyzed as a proxy for the quality of the research results. Third,correlational analyses were conducted among GDP and researchers,expenditures and annual numbers of articles. Using this analysis,whether socioeconomic factors (GDP) were associated with the number of published articles was clarified.Fourth,the number of articles published in the top 20 highest-impact-factor journals,the authors of the articles and the institutions of the authors were compared and analyzed. Finally,the differences in the research hotspots between China and the USA were compared.
Document output,type,journal,institution,author and author keywords were all analyzed by HistciteTM(Bornmann and Marx,2012) and Microsoft Excel 2010. A frequency analysis was conducted using BibExcel 1.0.0.0 (Perssonet al.,2009). Network diagrams for author cooperation and an author keyword cooccurrence analysis were calculated by UCINET 6(Borgattiet al.,2002) and visualized with NetDraw(Borgatti,2002). A heat map of author keywords was supported by the VOS viewer. Least significant difference (LSD) and Pearson correlation analysis were performed by SPSS 16.0. LSD was used to measure the quantity and quality differences between the two countries and Pearson's correlation was determined to assess the GDP-related correlations. All the statistical tests were two-tailed,with the possibility of a certain size being represented by thepvalue andp<0.05 was considered statistically significant.
Results
Publication outputs worldwide
Several publication output characteristics of PM2.5research from 1992 to 2016 were summarized in Table 1. A total of 12 document types were found among the 13 311 publications. These document types included 11 781 articles (the most common document type,representing 88.51%),meeting documents (838;6.3%) and reviews (254; 1.91%). Less importance was placed on other components. On average,16 articles were contained in each proceeding's paper and 52 articles were contained in each review article. Over time,the annual number of countries,institutions,journals and authors that participated in PM2.5research increased rapidly,indicating that researches on the impact of PM2.5received more attention in many national organizations. In addition,the total citation counts also increased and the research article that was most frequently cited was 'Particulate Matter Air Pollution and Cardiovascular Disease: An Update to the Scientific Statement From the American Heart Association' (Brooket al.,2010),which was published in Circulation. This article provided a comprehensive review of the new evidence linking PM exposure to cardiovascular disease.
The number of publications increased annually from 1992 to 2016. The cumulative annual number of articles from 1992 to 2016 was described by a power function model (Fig. 2).y=0.8391x2.9182(R2=0.9717)was used as the equation,the cumulative number of publications was represented byyand the year was represented byx. By 2020,the number of publications would reach 4 371,which indicated that the number of publications would continue to increase and the number of publications in 2020 would be twice that in 2016,which was predicted by us.
Publication outputs in China and the USA
Types and trends of publications
A total of 6 910 publications were from China and the USA,among which articles (6 608) were by far the most common document type (95.6%),the numbers of other document types were insignificant. Therefore,the 6 608 articles were used as research objects in the following analysis. As shown in Fig. 3,the total number of various types of publications from the USA was larger than that from China. As shown in Fig. 4,the percentage of publications was higher in the USA.Over time,the number of publications in China and in the USA increased rapidly. The output of publications in the USA before 2014 was larger than that in China (p=0.005,p<0.05) and the researchers from the USA were more prolific during that period. The total output of PM2.5publications in China increased rapidly and far exceeded that of the USA after 2014.The number of publications issued annually in China increased by 2.2 times (375 to 820),while that in the USA increased by 0.42 times (519 to 646) during 2014-2016. The progress made in China,a dominant producer of research in this field,meant that positive policies to resolve air pollution issues had been made by the Chinese government. For example,after the 2008 Beijing Olympic Games,more environmental awareness was obtained and haze in the Beijing-Tianjin-Hebei region was mitigated. Therefore,studies associated with PM2.5showed a sudden increasing trend in China after that period. In contrast,the annual number of PM2.5publications in the USA showed a steady rise.

Table 1 Scientific outputs descriptors from 1992 to 2016
Impact factors and citations
Because strong correlations between citations and the total number of articles had been observed in other fields,the total citations and average number of citations were both computed to assess the quality of the published articles. The total citation rate for the USA articles per year was much higher than that for China(Table 2) (p=0.000,p<0.05). However,the average number of citations per article per year in China was higher than that in the USA. There was no statistically significant difference in the average citation count between the two countries (p=0.083,p>0.05).

Fig. 2 Relationship between cumulative number of publications and year since 1992
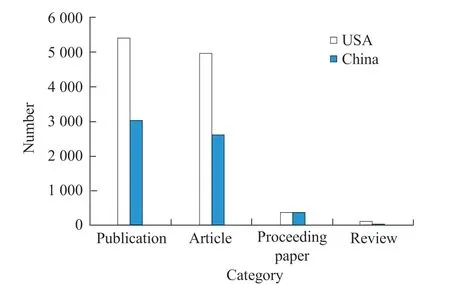
Fig. 3 Numbers of publications,articles,proceeding paper and reviews from China and the USA during 1992-2016
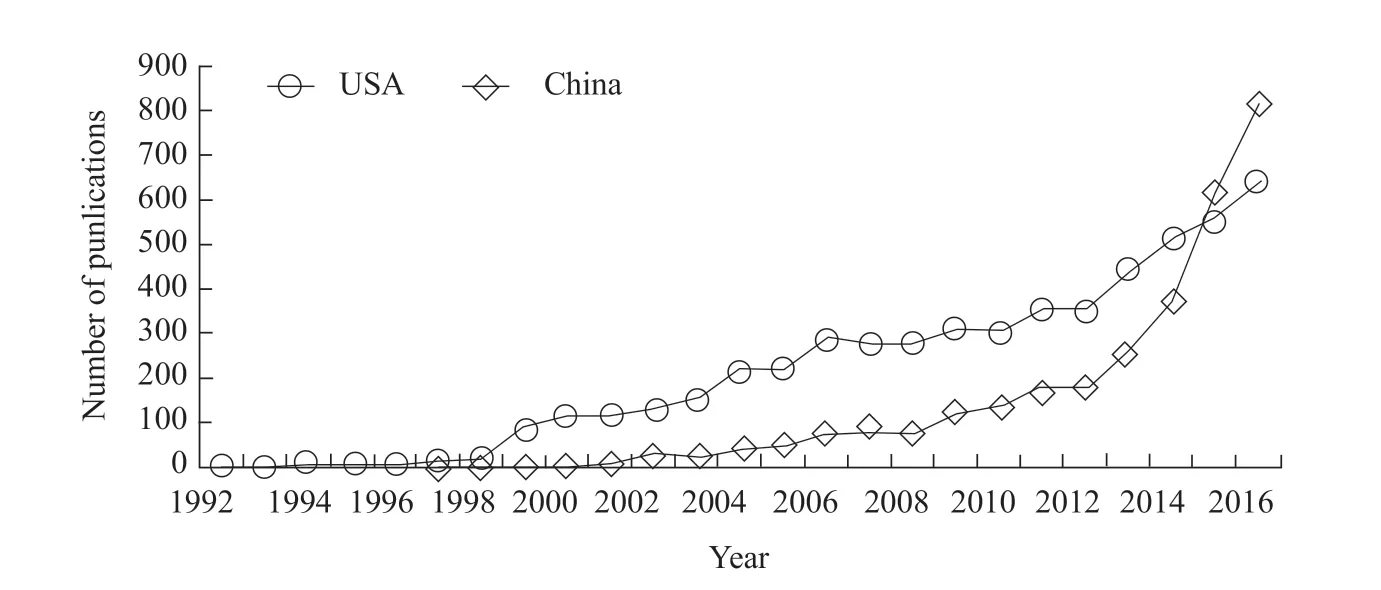
Fig. 4 Changes in number of publications in China and USA
Relationship between publication activity and socioeconomic factors
The relationship between the annual number of articles and socioeconomic factors is shown in Fig. 5. In China,the number of articles per year was significantly positively correlated with GDP (r=0.960**,p<0.05),researchers (r=0.880**,p<0.05) and research expenditures (r=0.904**,p<0.05). There was also a correlation between the annual number of articles in the USA and GDP (0.967**,p<0.05). However,no significant correlation between the number of articles per year and researchers or research expenditures was observed in the USA.
High-impact journals,institutions and authors
A total of 6 608 articles from China and the USA were published in 616 journals. Among them,67.07%(4 432 of the 6 608) were published in the top 20 journals (Table 3). The largest number of publications in high-impact journals came from the USA,with 3 343 articles; in addition,eight of the articles in the 20 most productive journals were from the USA and only two were from China. Furthermore,the countries with the largest number of articles in their own local journals were China and the USA. For example,the Journal of the Air & Waste Management Association was located in the USA and the number of articles from the USA was 13.27 times (398 vs. 30) that from China. The Journal of Aerosol and Air Quality Research was located in China and the number of articles from China was 1.72 times (122 vs. 71)that from the USA. Therefore,in PM2.5studies,the national journals were more likely to be used by local researchers.
A total of 6 608 articles came from 3 689 institutions. The top 20 institutions were analyzed in Table 4.Eleven institutions with 2 678 (54.32%) articles were in the USA and nine institutions (2 252; 45.68%) were in China. The Chinese Academy of Sciences was the most productive institution,with 743 articles. The value of institutional productivity could be biased by the fact that the Chinese Academy of Sciences was a general institution with hundreds of branches (Liuet al.,2011).

Table 2 Number of articles,total citations and average impact factor of PM2.5 articles from China and the USA during 1992-2016
In addition to the Chinese Academy of Sciences,the US Environmental Protection Agency published 600 articles,Harvard University published 510 and Peking University published 321. The total number of citations and average citations for a single agency publication were also collected. The institutions with the highest average citation rate and absolute quality advantages were the University of Southern California (8 853; 48.64%) and Harvard University (22 421; 43.96%).
The 20 most prolific authors during 1992-2016 were summarized in Table 5. Eleven authors were from the USA,with 1 264 articles. The total number of articles by the top 20 authors was greater in the USA than that in China (821). The largest number of articles and average citations originated in the USA (Hopke PK and Chow JC). In China,the highest quantity and quality values were associated with Cao JJ and Zhang YH. In the USA,the highest quantity and quality values were associated with Hopke PK and Chow JC. The LSD of the top 10 authors from China and the USA was analyzed,indicating that the difference in articles from the top 10 authors was statistically significant between the two countries (p=0.012,p<0.05). The difference in the average number of citations was also statistically significant (p=0.05,p≤0.05). As shown in Fig. 6,the collaboration network among the authors of more than 50 articles was also visualized by NetDraw. An author was represented by one point and the number of published articles was represented by the size of the point. The connections among authors were represented by the lines,and the strength of the collaboration was indicated by the thickness of the line.

Fig. 5 Relationships between socioeconomic factors and articlesGDP (×109 USA dollars); researchers (per million people); research spending (% of GDP).

Table 3 The 20 most prolific journals in terms of articles by researchers from China and the USA
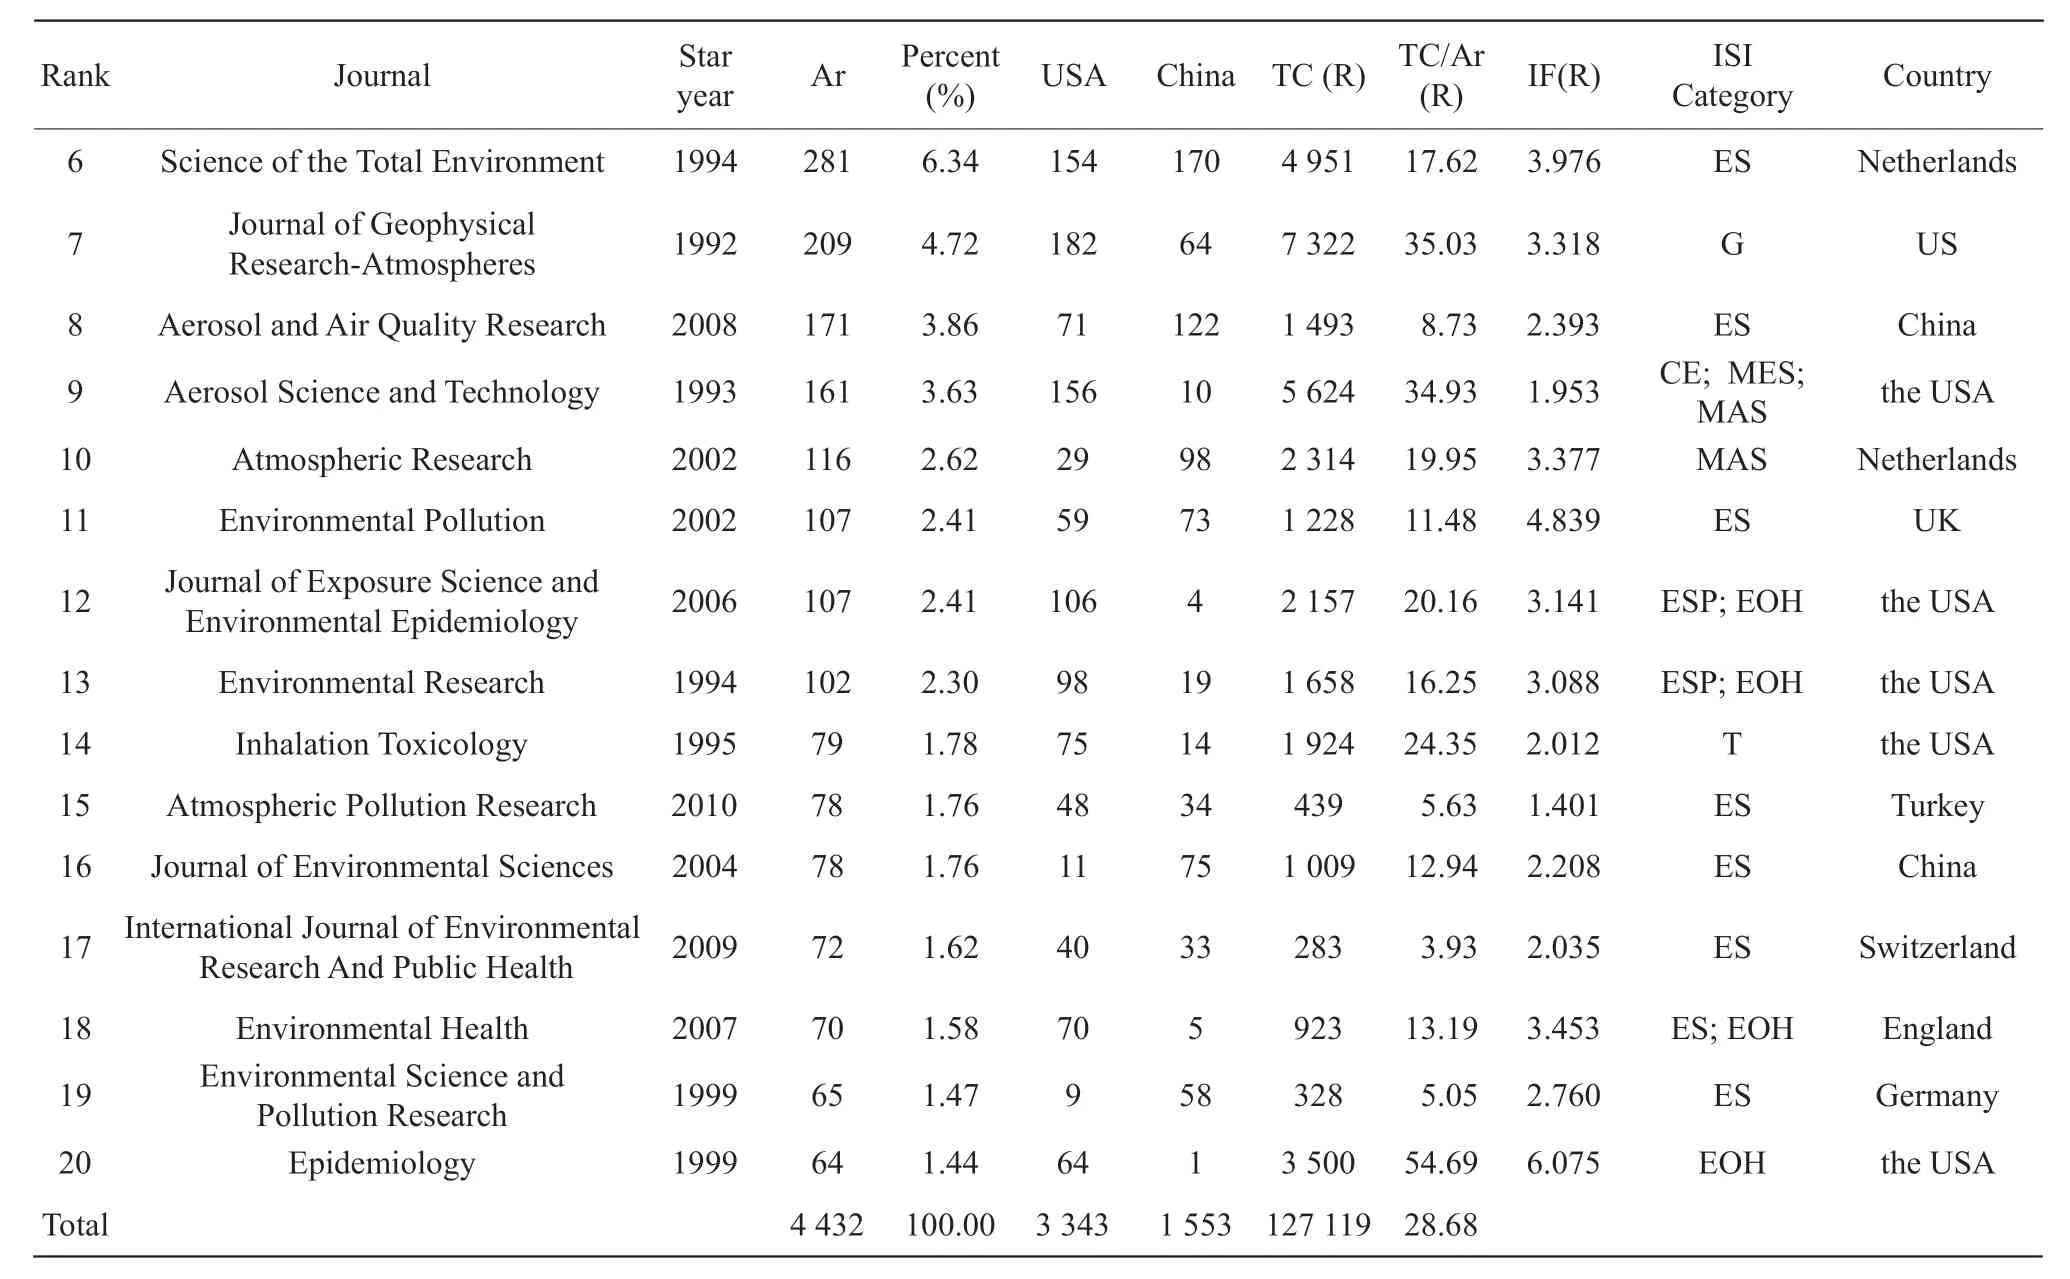
Continued
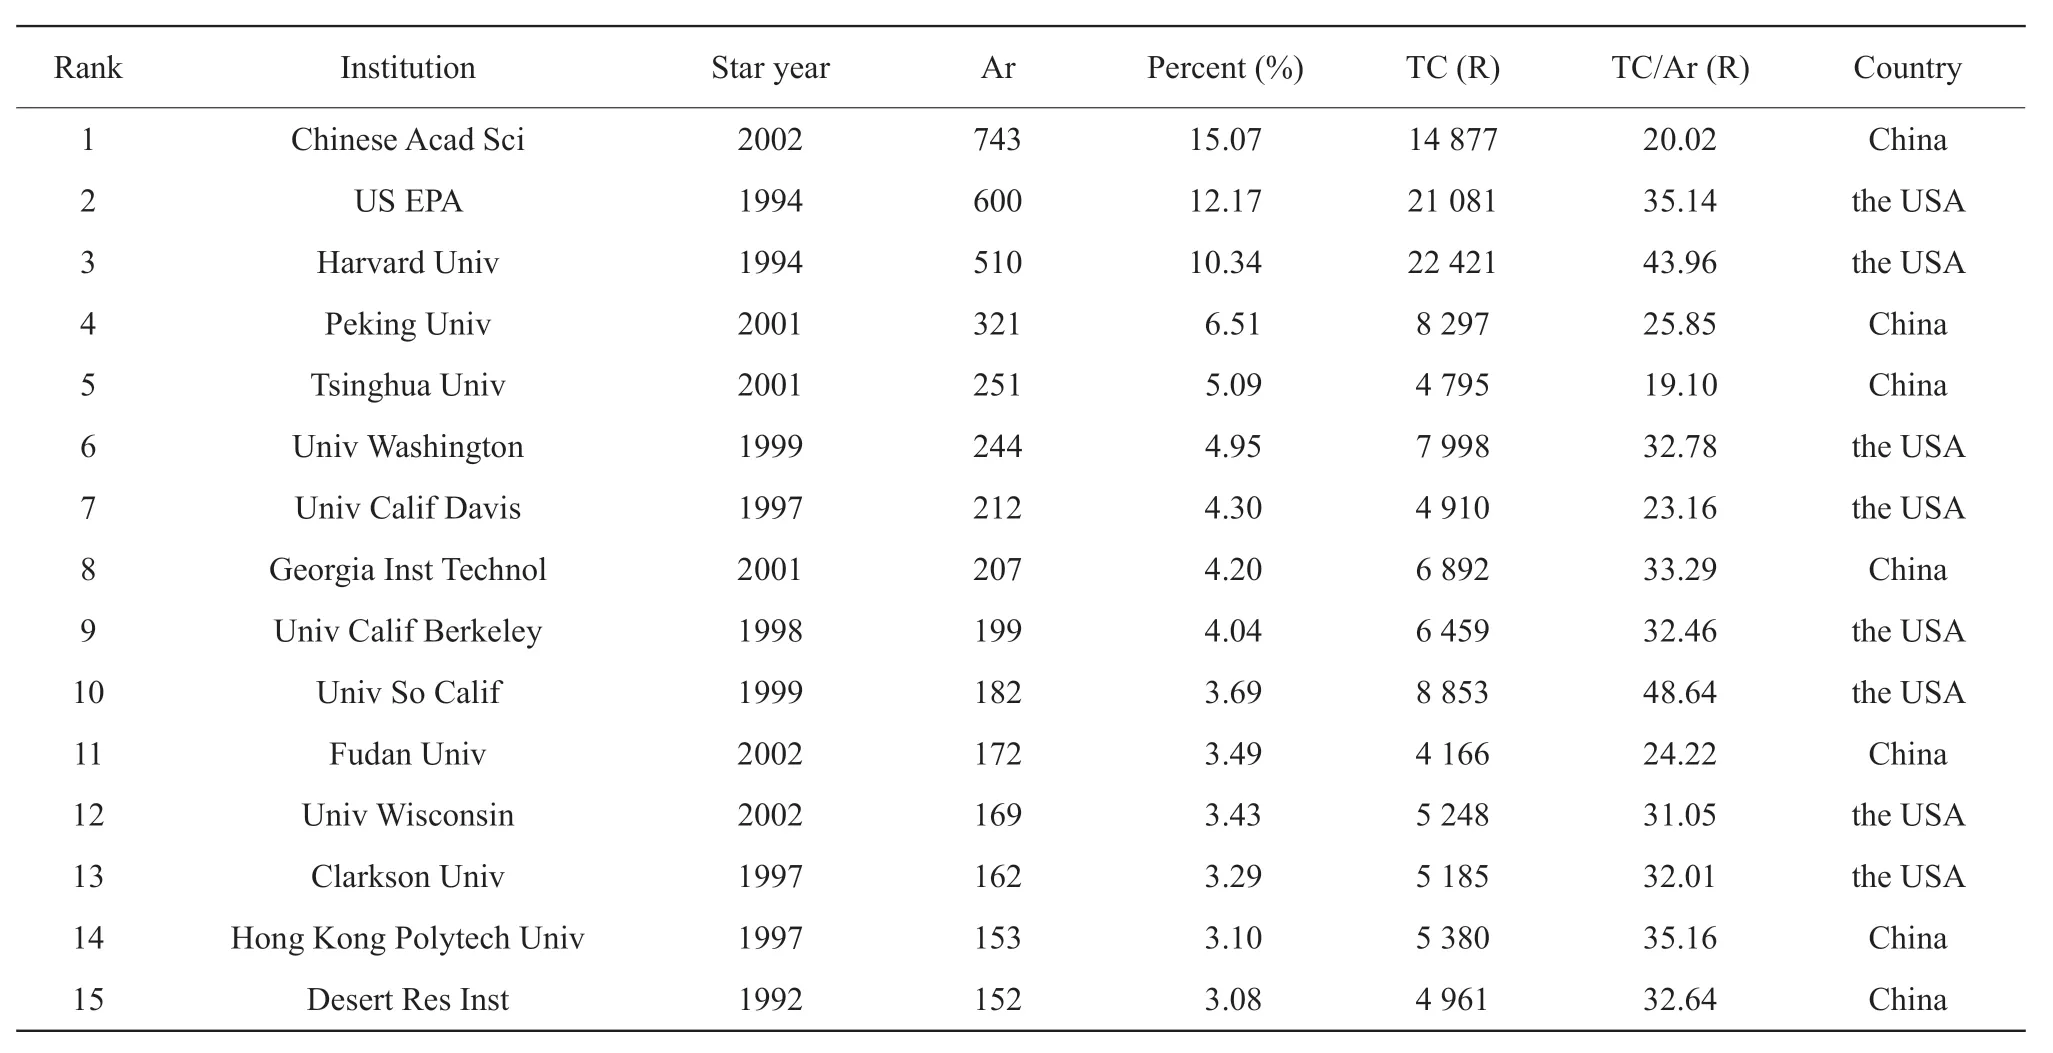
Table 4 The 20 most prolific institutions in terms of articles by researchers from China and the USA

Continued
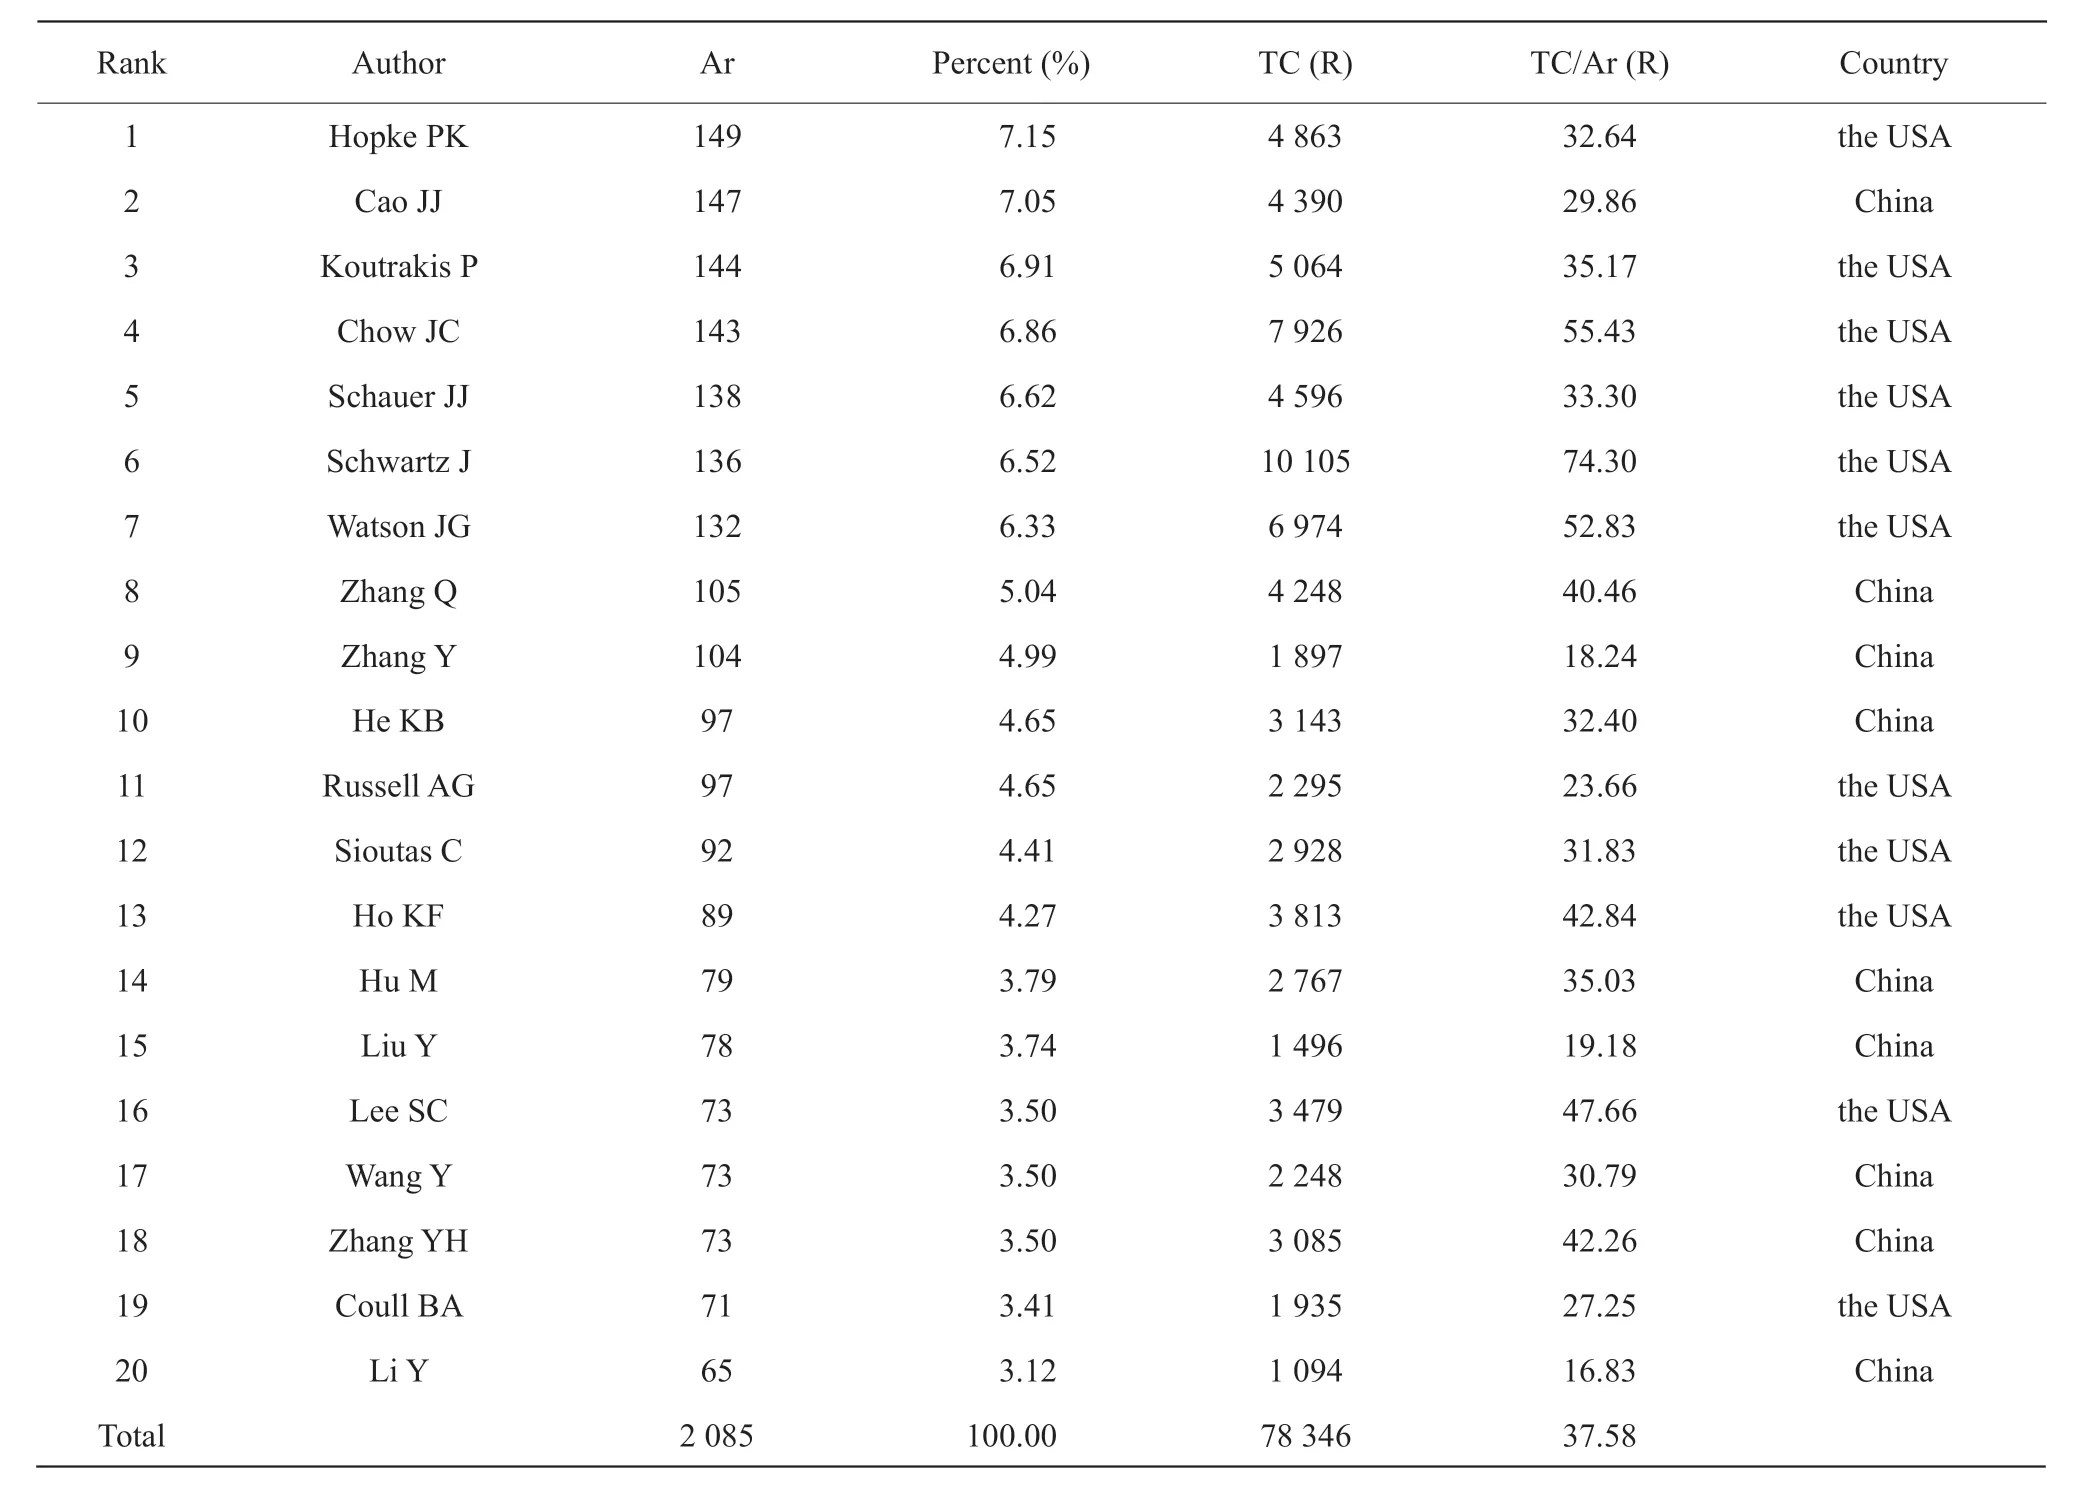
Table 5 The 20 most prolific authors in terms of articles by researchers from China and the USA during 1992-2016
Research situation,hotpot and otherness
Author keywords were important sources in comprehending research emphases and frontiers (He,1999;Wang and Ho,2016; Liuet al.,2016). From 1992 to 2016,8 716 author keywords were recorded as being used in articles. The 55 most frequent author keywords during 1991-2016 were presented in Table 6. "PM2.5","Particulate Matter" and "Air Pollution" were the most frequently used keywords. According to the author keywords,research situations for PM2.5were extracted and separated into four categories,including "basic characteristics and formation mechanism","monitoring and analysis method","impact on human health" and"impact on environment". Basic characteristics and formation mechanism research included the study of particle size distribution (PM1,PM2,PM2.5and PM10),chemical composition (aerosols,second organic aerosols,organic carbon,elemental carbon,polycyclic aromatic hydrocarbons and metals),variability and evolution characteristics (seasonal variation and spatial variation) and source apportionment (longrange transport,biomass burning,traffic and emission inventory). Monitoring and analysis method research included the study of monitoring methods (ICP-MS,PIXE,MODIS and remote sensing) and analytical methods (cluster analysis,factor analysis,GIS,RS,CMB,PCA and PMF). The main author keywords for impacts on the environment were air quality and air pollution,and the major author keywords for impacts on human health were personal exposure,health risk assessment,epidemiology and toxicology,mortality,asthma,heart rate variability and lung function. The top 15 author keywords were used to generate radar maps to reveal the research hotspots over the last five years (Fig. 7). The results showed that particulate matter and source apportionment were the main research hotspots.

Fig. 6 Network diagram showing collaboration among authors of more than 50 articlesEach point represents one author. The size of the point represents the strength of degree. The thickness of the lines represents the strength of the collaboration.

Table 6 The 55 most frequently used author keywords in 11 783 articles
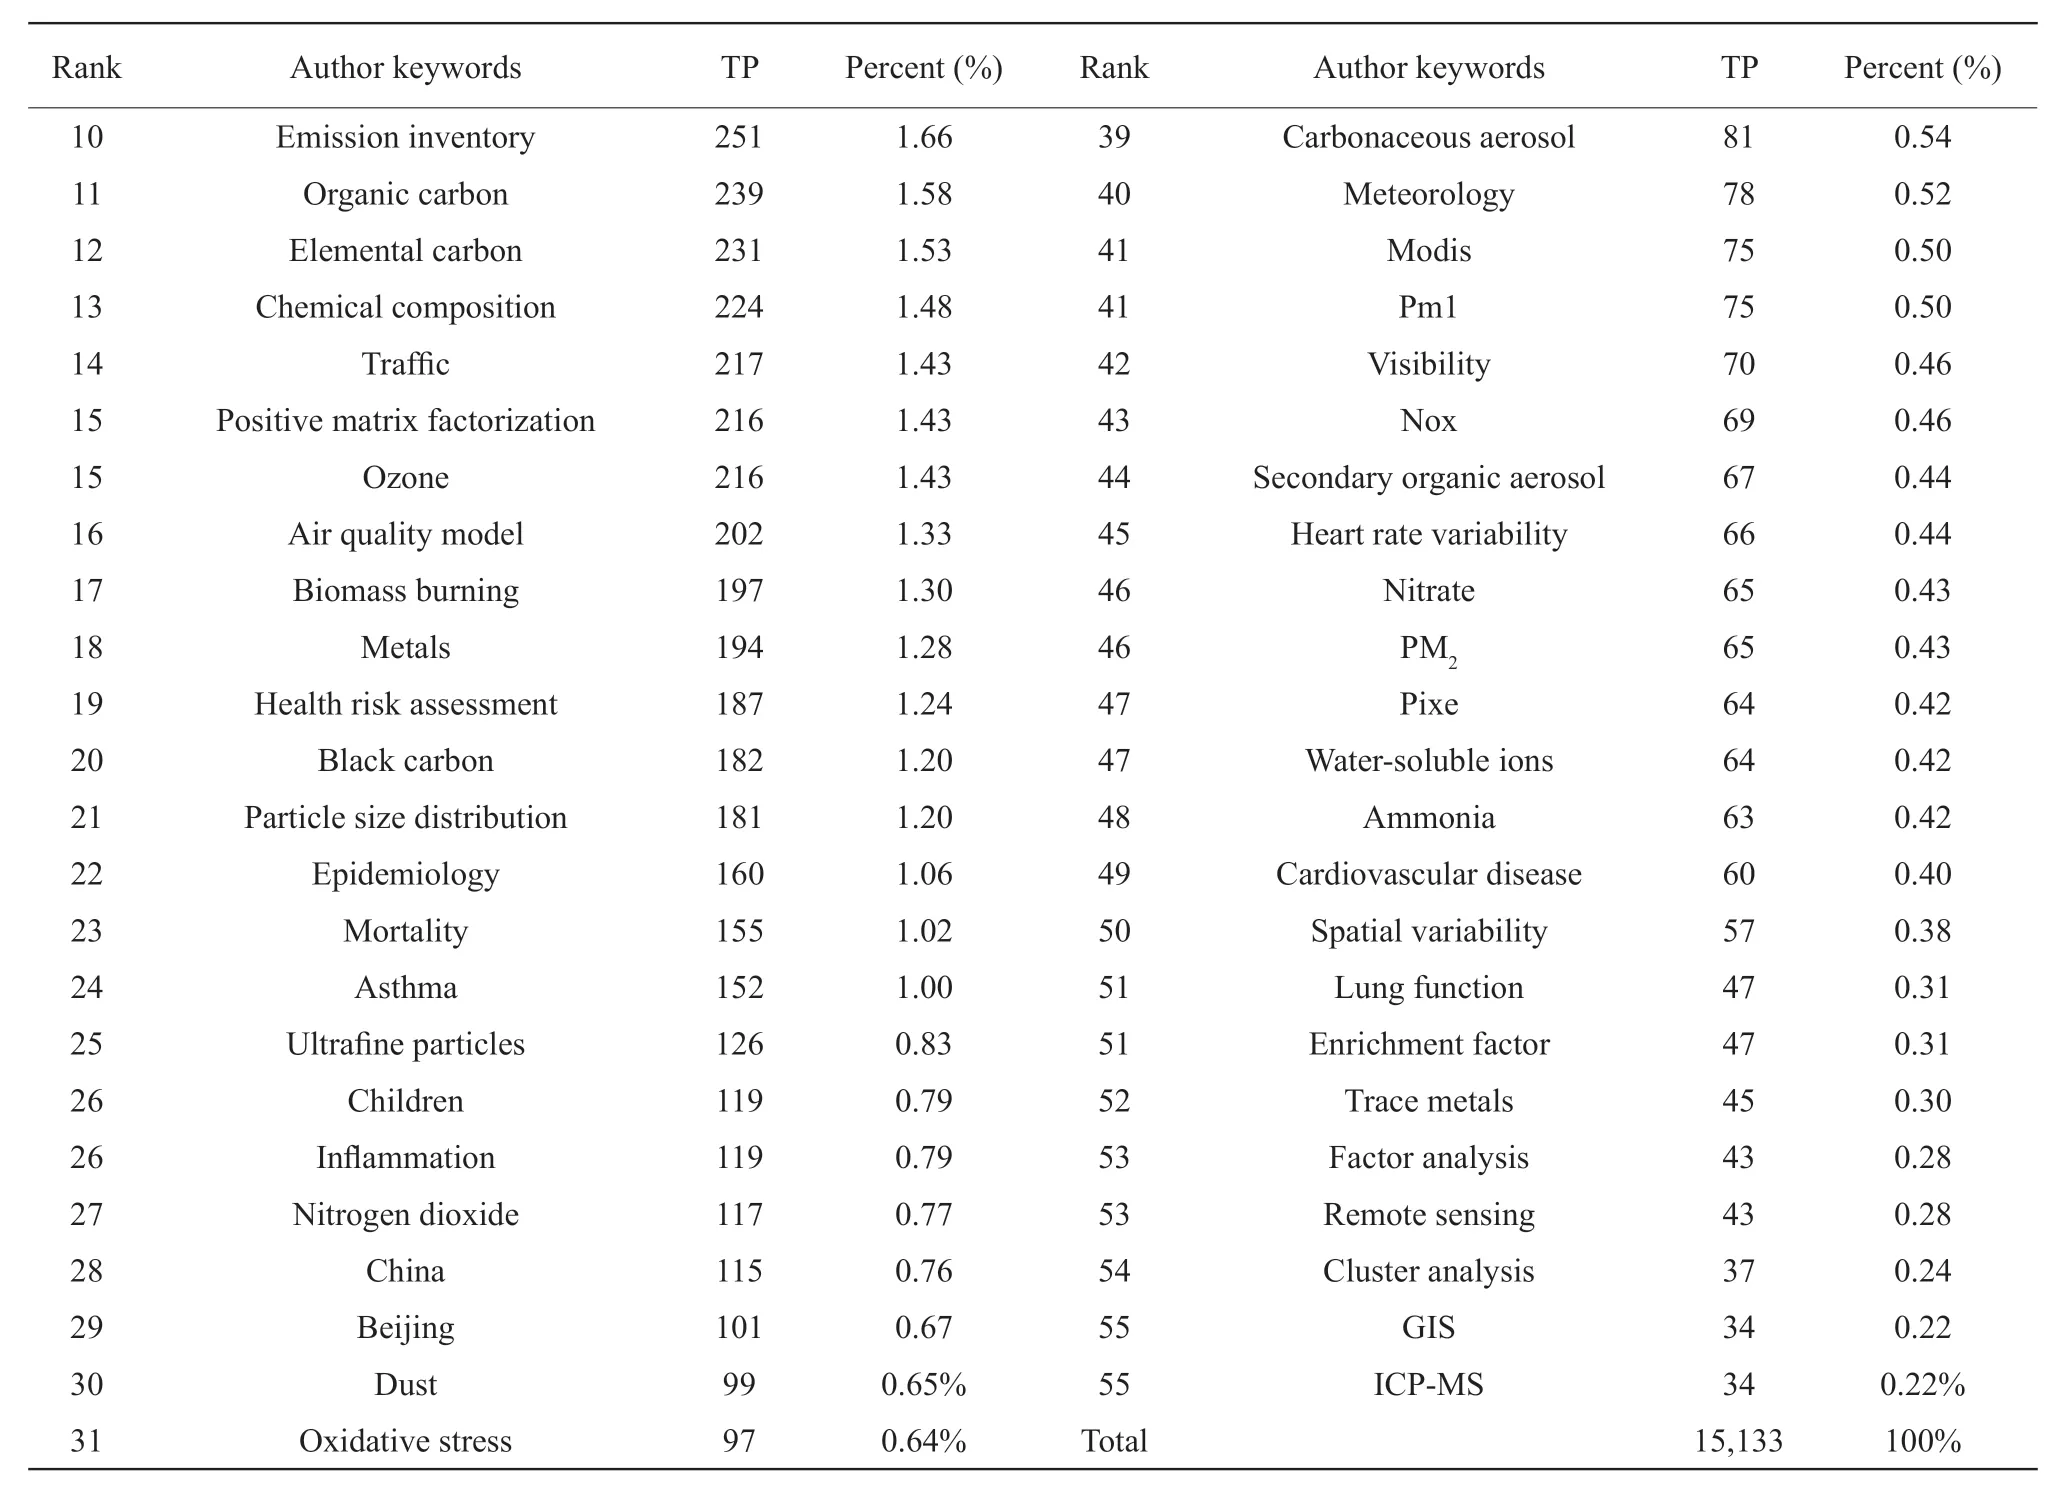
Continued
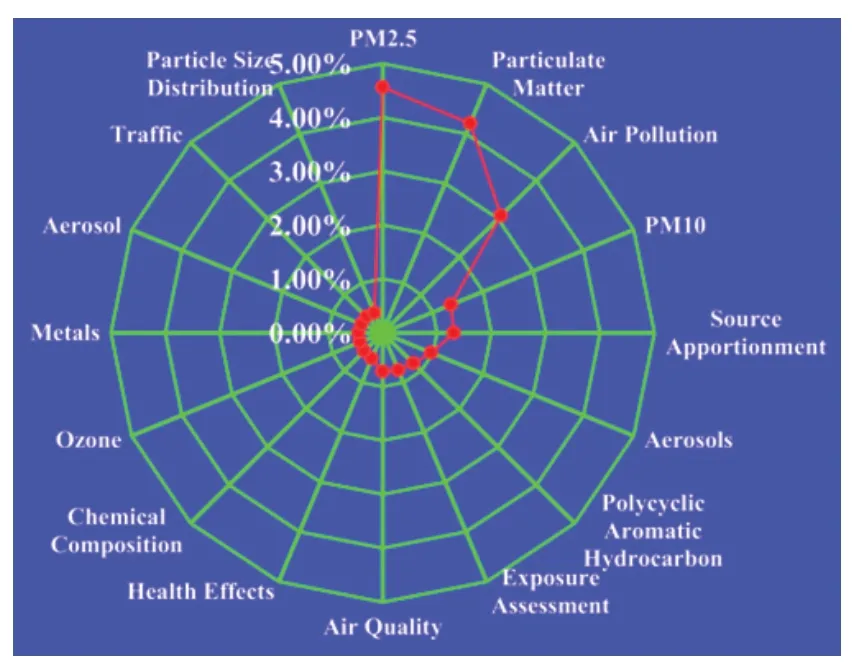
Fig. 7 Radar map of the 15 most frequently used author keywords from 2012 to 2016 in 11 783 articles
Based on the WOS dataset and with the support from the VOS viewer,two heat maps (Fig. 8) were created to show the "hot" emerging areas of PM2.5research in China and the USA. Each point on the map was expressed with a color along a spectrum ranging from red and blue,and the color was dependent on the density of the item at that point. By default,the more items that were close to a point,the greater the weight was and the closer the color of the point was to red.Conversely,the lower the number of items around a point,the smaller the weight was and the closer the color of the point was to blue. The research frontiers were similar between China and the USA,focusing on air quality,chemical compositions and source apportionment. Although chemical compositions and source apportionment were more popular in China than in the USA,health research and personal exposure were relatively weak,whereas comprehensive research in both source apportionment and personal exposure was strong in the USA. Based on the VOS viewer,a cooccurrence analysis by author keywords was also performed to reveal the overall structure and keyword relationship in PM2.5research (Fig. 9).
In China,the strongest cooccurrence relationship was between air pollution and particulate matter,followed by PM2.5with source apportionment and PM2.5with haze. In the USA,it was observed that the strongest relationships were associated with air pollution as the followings: air pollution → particulate matter,air pollution → PM2.5,air pollution → PM10,air pollution → O3,air pollution → epidemiology,air pollution → heart rate variability and air pollution →inflammation.

Fig. 8 Different distributions of author keywords in publications from China and the USA


Fig. 9 Cooccurrence analysis of more than 50 author keywords in publications from China and the USAEach point represents one keyword phrase. The thickness of lines represents the strength of the cooccurrence relationship.
Discussion
This was the first paper to compare the PM2.5research from China and the USA by bibliometric analysis.The results showed that researchers from the USA published more articles than those from China,thus showing the country's overall advantage in terms of quantity of PM2.5research. Based on the correlation analysis,GDP,number of researchers and expenditures were significantly positively correlated with the annual number of articles in China and correlation was the highest for GDP (0.960**).However,only GDP was significantly positively correlated with the number of articles in the USA each year. Therefore,the number of papers were closely related to the GDP in both China and the USA. A similar influence was observed in the growth trend of publications. The output of publications increased steadily from 1992 to 2016 in the USA. The output of publications in China increased rapidly and the publication rate was significantly higher in China than that in the USA from 2003 to 2016,eventually resulting in China exceeding the USA in the number of articles published annually in 2014. Interestingly,the USA's GDP increased by 15.14% from 1992 to 2002(from 10 602.381 to 12 207.738) and China's GDP increased by 51.88% (from 1 294.314 to 18 824.084).However,China's GDP increased by 206.11% during 2003-2015,a four-fold increase,and the degree of growth in the number of publications was not significant; conversely,the GDP increased by only twofold in the USA during 2003-2015. As a result,the dramatic increase in the GDP of China lead to a significant increase in the number of publications per year,which might provide an explanation for this study's results.
The average number of citations was calculated to assess differences in research quality. The results showed that the differences in average number citations were not statistically significant between the two countries. Interestingly,a statistically significant relationship was observed when the average number of citations for the top 10 authors in these countries were used as a test variable. In China,5 869 authors participated in PM2.5research,with 23 authors (0.39%)contributing to at least 50 articles and 322 authors(5.49%) contributing to at least 10 articles. In the USA,12 337 authors participated in PM2.5research,but only 3.96% of these authors contributed to more than 10 articles. Therefore,this information was easily obscured because the sample size was too small (10),leading to bias in the results. In addition,because English was the standard language of WOS,many high-quality works published by Chinese authors in local languages had not yet been considered (Lyuet al.,2017). Therefore,the quality assessment results for the top 10 most prolific authors were not reliable.This finding indicated that there was no significant difference between China and the USA in terms of the quality of articles.
The highest publication pattern percentage was from journals and institutions in the USA,indicating that PM2.5research was led by the USA in the past. At the journal level,articles from China were greatly favored by journals from China. A similar trend was observed in the USA. One reason for this pattern was that many high-quality works in China were published in Chinese because of language restrictions,resulting in the omission of Chinese literature in the data collection.On the other hand,the research of Chinese researchers received more attention and the associated intellectual property was protected in China. At an institutional level,clear advantages in quantity and quality were held by the Chinese Academy of Science and the University of Southern California. The author analysis showed that Hopke PK was the most prolific author and that Zhang Q and Cao JJ had the highest degree of cooperation with other researchers.
As shown in Fig. 8,two research hotspots were focused on source apportionment and personal exposure in the USA. Chemical compositions and source apportionment received more attention in China. Research on personal exposure was less common in China than in the USA. With the worsening of haze conditions in the Beijing-Tianjin-Hebei region,Yangtze River Delta and Pearl River Delta,the incidence of respiratory and cardiovascular system problems in Beijing,Shanghai and Guangzhou grew significantly due to the increasing in PM2.5(Beijing Health Care Association). Considering the toxicity of pollution and the improvement of environmental awareness in the wake of the 2008 Beijing Olympic Games(Zhu and Hua,2017),new research emphases and trends developed in China. Moreover,many research documents had focused on basic theory. However,there remained many problems regarding pollution reduction and public health protection due to the lack of understanding of the sources,transmission,receptors and meteorological conditions associated with pollution.
There were some limitations in this study. First,only publications from SCI-E were selected,while some relevant publications were excluded. However,the conclusions regarding the assessment of published articles were unlikely to change if articles published within other databases were considered (De Jong and Schaper,1996; Lyuet al.,2017) based on many bibliometric analyses in other disciplines. Therefore,the results were trustworthy and effectively represent the activity in the field of PM2.5research. Second,due to the diversification of social and economic factors,only the relationships of GDP,researchers and expenditures with publications were analyzed.Environmental investment,educational background and other factors also determined the quantity and quality of publications. The depth of analysis was limited because of the limitations of the data. Third,many research results published in China,such as How Net (CNKI: http://www.cnki.net/),were not considered. Therefore,the consistency of the results between SCI-E and CNKI remained unknown.Finally,despite these shortcomings,the study was still considered to provide sufficient information and a deeper understanding of the research differences between China and the USA in the field of PM2.5.
Conclusions
A total of 6 608 publications from 1992 to 2016 were analyzed by bibliometrics. Based on this study,the number of publications produced in 2020 is expected to be at least twice that in 2016. More articles were published in the USA than in China,and a clear advantage in terms of quantity in PM2.5research was also shown for the USA. GDP was significantly positively correlated with the number of annual articles in China and the USA (p<0.05). Through comparative analysis,it was observed that the output of publications in the USA before 2014 was larger than that in China. China would be the leading region for PM2.5research in the future. It is predicted that the leading region for PM2.5research will be in China in the future. The average number of citations was used to assess differences in research quality. There was no significant difference between China and the USA in terms of the quality of articles. Additionally,analysis of author keywords indicated that "chemical composition" and "source allocation" were the main research hotspots in China and the USA. Research on personal exposure in China was less common than in the USA. More researches on exposure will be valuable in the future because of the pollution problem in China. Finally,despite some limitations in this study,it still provided sufficient information on and a deeper understanding of the differences between China and the USA in the field of PM2.5. Patterns and differences in scientific outcomes were revealed in this study.Moreover,this study provided potential guidelines for future research and management.
杂志排行
Journal of Northeast Agricultural University(English Edition)的其它文章
- Genetic Diversity of Maturity Related Genes of Soybean During One Centurial Artificial Selection in Northeast China
- Effects of Lanthanum and Cerium on Chlorophyll Content,Yield and Components of Soybean in Northeast China
- Effects of Different Feeding Methods on Behaviors,Immunities and Growth Performances of Suckling Calves
- Effects of Facultative Anaerobic Cellulolytic Bacteria and Nitrogen-fixing Bacteria Isolated from Cow Rumen Fluid on Rumen Fermentation and Dry Matter Degradation in Vitro
- Effect of Zinc Acetate on Broiler Nutrient Metabolism and Skeleton Characteristic
- Prokaryotic Expression of IBV N Protein and Development of Indirect IBV N Protein-mediated ELISA
