Genetic Diversity of Maturity Related Genes of Soybean During One Centurial Artificial Selection in Northeast China
2020-04-28ChengJiyaoWangWanpengLiWenbinandJiangZhenfeng
Cheng Ji-yao,Wang Wan-peng,Li Wen-bin,and Jiang Zhen-feng
Key Laboratory of Soybean Biology in Chinese Ministry of Education (Northeastern Key Laboratory of Soybean Biology and Genetics & Breeding in Chinese Ministry of Agriculture),Northeast Agricultural University,Harbin 150030,China
Abstract: Maturity period is a critical trait in soybean breeding and determines the particularly ecological region of a cultivar. In present study,118 soybean varieties spanning three artificial breeding periods (1923-1970,the early breeding period; 1971-1990,the mid-breeding period; and 1991-2010,the current breeding period) in northeast China were selected. Fourteen DNA-specified markers including cleaved amplified polymorphic sequences (CAPS),derived CAPS (dCAPS) and fragment length polymorphism(FLP) markers were filtered to analyze the genetic diversity from E1 to E4. The results were as the followings: the soybean varieties with more gene frequencies showed more gene diversities. Among the E genes,E1 and E3 genes showed more allelic diversities than E2,and E4 only had diversity in the early breeding period. During the artificial process,some alleles of E genes disappeared and some new ones were generated. More gene diversities were observed in soybean germplasms,and new excellent germplasms could be explored to improve yield traits in artificial breeding programs. Furthermore,six different E gene combinations were observed in the early breeding period,five in the mid-breeding period and 11 in the current breeding period. Three elite genotypes were identified through a century artificial selection,while new genotypes were also found in different breeding periods. Of them,e1-nle2e3-trE4 was a new soybean genotype of extremely early maturity in the current breeding period,which was widely suitable for planting in 00 and 000 maturity groups. Moreover,significant correlation was found between E2 and E3,suggesting that light length and light quality were two key factors for soybean maturity in northeast China. The understanding of the E genes variation underlying soybean maturity could facilitate the procession to breed elite varieties adapted for diverse regions.
Key words: soybean,one centurial artificial selection,genetic diversity,maturity gene
Introduction
Soybean is a typical shortday crop and its maturity duration diversified significantly (Jianget al.,2014;Xiaet al.,2012a; Liuet al.,2010; Tianet al.,2010).Till now,nine maturity loci (E1-E9 and J) had been reported (Bernard 1971; Buzzell,1971; Buzzell and Voldeng,1980; McBlain and Bernard,1987; Rayet al.,1995; Bonato and Vello,1999; Elroyret al.,2010; Luet al.,2017; Yueet al.,2017). Among them,E1 toE4 have been cloned (Xiaet al.,2012b).E1 is designated as a transcription factor functioned as a flowering suppressor (Thakareet al.,2010,2011; Xiaet al.,2012a,b);E2 is classified into a G1GANTEA homologue ofGmGIa(Watanabeet al.,2011; Jianget al.,2014);E3 andE4 are named asGmphyA3 andGmphyA2,functioned as phytochromes,respectively. Reports about the allele diversities of those genes have been published (Liuet al.,2008; Watanabeet al.,2009; Xiaet al.,2012b). Among them,E1 gene inhibits soybean flowering under long-day condition,and oneE1 mutation,e1-as,is reported to control early flowering (Xiaet al.,2012a). Another dysfunctional mutation ofE1 gene,e1-nl,is also identified to regulate traits,such as early flowering and early maturity(Tsubokuraet al.,2014; Kuraschet al.,2017),which is a necessary allele for a soybean variety to adapt to higher latitudes.E2 has two alleles,the functional dominantE2 and the recessivee2. TheE2 allele promotes early flowering by up-regulating the expression ofGmFT2a(Watanabeet al.,2011).E3 gene promotes flowering,but delays maturation,andE4 has a greater importance thanE3 for adaption to high latitude environments (Jiaet al.,2014).E3 andE4 alleles are reported to respond to pre-flowering and post-flowering photoperiod,whileE4 ande1-astogether withE3 alleles result in earlier flowering and maturity (Xuet al.,2013; Jianget al.,2014).
As maturity related genes are very important to plant growth and yield potential,further work,such as allelic variation,has been well documented. Zhaiet al. (2014)genotyped 180 soybean cultivars withE1 toE4 genes and concluded that allelic variations at each of the four loci have a significant effect on maturity,and the 180 cultivars are classified into eight genotypic groups with different maturity periods,according to the allelic variation ofE1 toE4. Of them,soybean varieties from Heilongjiang Province are found in seven genetic groups includinge1-nf,e1-as/E4,e1-as/E3/E4,e1-as/E2/(E3)/E4,E1/E4/(E3),E1/E3/E4 andE1/E2/E3/E4 with different developmental periods. Xuet al. (2013)genotyped 53 early-maturing photoperiod-insensitive soybeans,and classified them into six different maturity groups,includinge1/e3/e4,e1-as/e3/e4,E1/e3/e4,e1/E3/e4,e1/e3/E4 ande1-as/e3/E4. Seventyone cultivars and four wild soybean accessions are genotyped based on four maturity loci (E1,E2,E3 andE4),and conclude that these fourEgenes significantly determine the ecological-economical adaption of the cultivars. Based on more works,different independent or combinedEalleles have varied effects on soybean flowering and maturity. While no knowledge about allelic variation of the fourEgenes in different breeding periods in northeast China which should also facilitate new elite variety releasing.
Soybean is a highly inbred crop,as its self-pollinated characteristic. Now,in most soybean production countries (United States,Brazil,China,India and Japan),most soybean varieties widely cultivated in the world are bred from limited ancient soybean lines,resulting in a narrow genetic base. Reports showed that 28 ancestors and seven first progenies contribute 95%of the genes identified in modern cultivars of north America (Gizliceet al.,1994; Chung and Singh,2008).Therefore,an attempt to increase yield potential is hampered. Thus,introducing different genetic germplasms and broadening genetic bases is a suitable way to breed new elite soybean varieties. The genetic base of the soybean germplasm in China is much wider than that in the US and other countries. Scientists have reported that 339 ancestors are identified in 651 Chinese soybean cultivars released from 1923 to 1995(Cuiet al.,2000). With the continuing efforts of introducing vary genes to the modern soybean varieties,the genetic base has been remarkably expanded (Carteret al.,2004).
While more efforts are emphasized on the breeding of new soybean varieties that are widely cultivated and show high yield,gene diversity analysis can facilitate this procession. Many related works that focus on the artificial selection across decades in crops has been reported. For example,genotypic diversity between Chinese and north America soybean cultivars is evaluated using random amplified ploymorphie DNA (RAPD) markers,and elite genetic sources for broadening the diversity of important agronomic traits are discovered (Cuiet al.,2000;Liet al.,2001; Wenet al.,2009). Similar works are also been conducted in other crops. Reifet al. (2005)concluded that open-pollinated varieties of maize can be useful sources for broadening the genetic base of elite maize breeding germplasm using Simple sequence repeat (SSR) markers. The nucleotide diversity of important maturity gene of sorghum is detected by using 252 cultivars and wild sorghum lines. The results can help to better understand the genetic diversity and the evolution of sorghum maturity (Wanget al.,2015).
The maturity period of soybean varieties had been shortened greatly after threedecade efforts by the breeders in northeast China,based on widening the genetic diversity of soybean breeding materials. In current,extra-early soybean cultivars with 85 days maturity period (from planting to physiological maturity) have been released in Heilongjiang Province of China and can be planted far north than latitude 50°.However,the maturity period has met bottleneck. To continually shorten the maturity period,it is essential to reintroduce new elite genes and broaden the genetic base of soybean. The aim of the present study was to clarify the genetic diversities fromE1 toE4 genes in the soybean varieties released,during near one century based on polymorphic markers,to explore the changes ofEgenes in different breeding eras,and to compare the diversities ofEgenetic loci to find new elite germplasm.
Materials and Methods
Plant materials
A total of 118 soybean accessions released during 1923 to 2010 in northeast China were selected. These cultivars were widely cultivated during different ages.Most of them were core collection germplasms and the representatives of different eras of soybean breeding in northeast China. According to the released years of the accessions,the 118 soybean varieties were categorized into four groups (Zhanget al.,2008). Group 1 comprised 16 soybean varieties released before 1970,Group 2 was consisted of 19 soybean varieties released between 1971 and 1990,Group 3 included 80 soybean varieties released from 1991 to 2010,and Group 4 consisted 36 soybean germplasms collected from China and abroad.
DNA extraction
Approximately 10 seeds of each soybean cultivar were selected and grown in the chamber room with temperature 25℃. Young trifoliate leaves were collected from five seedlings and bulked for each cultivar and grounded to a fine power in a 1.5 mL tube on the ROTATOR machine (MM301,RETSCH,Germany).Genomic DNA was extracted by using CTAB method(Doyle and Doyle 1990). Extracted DNA was screened with spectrum Nanodrop 2000 and diluted for SSR analysis.
CAPS and dCAPS analysis
Based on DNA specified markers reported by Xuet al. (2013) and Zhaiet al. (2014),14 DNA-specified markers consisted of five CAPS markers and five dCAPS markers and four FLP markers were synthesized in Sangon Biotech Co.,Ltd. (Shanghai,China)to genotype the soybean varieties. The length information for the products of these markers were as the followings: two was forE1 gene (Glyma.04G156400),namedE1-1(222 bp) andE1-2 (444 bp),one forE2 gene (Glyma.10g221500) namedE2-1 (110 bp),five forE3 gene (Glyma.19G224200) namedE3-1-1(1 339 bp),E3-1-2 ((558 bp)),E3-1-3 (275 bp),E3-2(759 bp) andE3-3 (163 bp),and five forE4 gene(Glyma.20G090000) namedE4-1 (535 bp),E4-2(355 bp),E4-3 (494 bp),E4-4 (494 bp) andE4-5-1(1 229 bp). Each PCR reaction contained 25 ng of the total genomic DNA as template andTaqpolymerase(Tiangen,China). Amplification conditions were 30 cycles at 94℃ for 30 s,56 to 60℃ for 30 s and 72℃for 30 to 90 s. PCR products were digested with appropriate restriction enzymes and were separated by electrophoresis in 1% to 3% (w/v) agarose gels,stained with ethidium bromide and visualized under UV light.
Data analysis
To generate a dataset of polymorphic allele counts for each cultivar,DNA fragments were amplified by CAPS,dCAPS and FLP primer pairs were identified according to the molecular weight measured with a 2.5 kb DNA ladder (Tiangen,China) and compared with the fragment sized reported by Xuet al. (2013)and Tsubokuraet al(2014). To verify the accuracy of products of different primers,PCR products were sequenced except those of which the marker weights were lower than 200 bp. The dataset was conducted to Popgene32 Software version 1.31 to clarify the gene diversities.
Results
E gene diversity and group genetic distances
A total of 118 soybean varieties contained four main maturity genes (E1,E2,E3 andE4) were genotyped using allele-specified DNA markers. Of them,four alleles withE1 gene were identified and the alleles were named ase1-nl(CAPS marker),e1-null-asandE1 (CAPS marker),when PCR products of primer E1-1 were digested using restriction enzymeHinfⅠ,respectively,andE1 ore1-as,when PCR products of primer E1-2 were digested using restriction enzymeTaqⅠ(dCAPS marker). Two alleles withE2 gene were detected and named asE2 ande2,when PCR products of primer E2-1 were digested using restriction enzymeDraⅠ(dCAPS marker),respectively. Three alleles withE3 gene were measured and named asE3-Harosoy(FLP marker) ande3-tr(FLP marker),when PCR products of primer E3-1 were amplified,ande3-fsorE3,when PCR products of primers E3-2 and E3-3 were digested using restriction enzymeAleⅠ(CAPS marker) andMfeⅠ(dCAPS marker),respectively. Two alleles withE4 gene were identified and named asE4 for most of the varieties determined by the PCR products of primers of E4-1,E4-2,E4-3,E4-4 and E4-5-1 andet-tsuonly for Fengshou 2,when PCR products of primers of E4-2 were digested using restriction enzymeEcoRV.
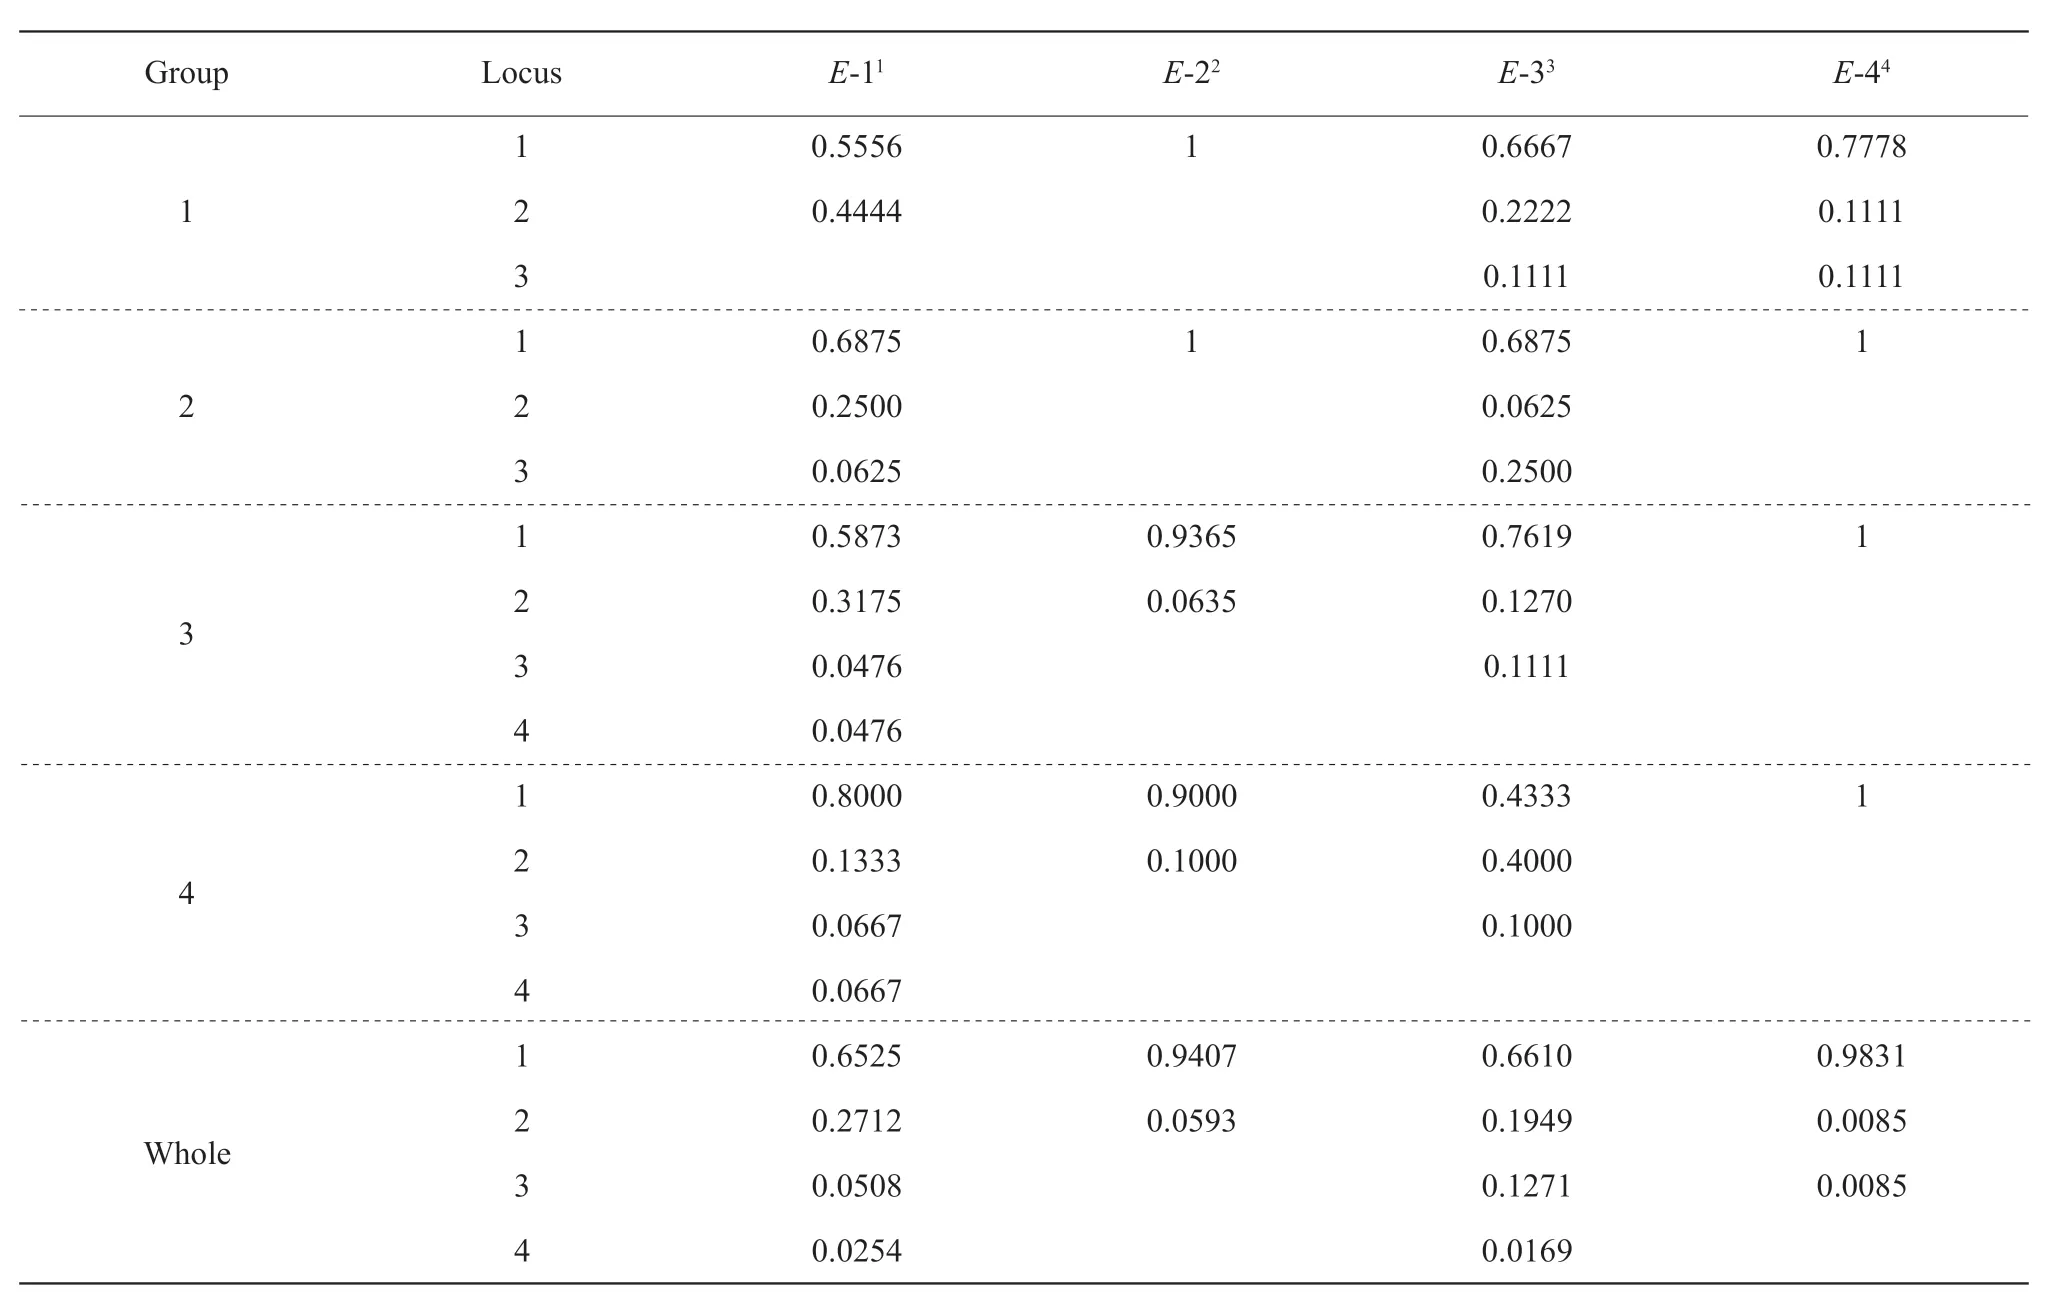
To analyze the diversity of the fourEgenes,allelic frequencies ofE1,E2,E3 andE4 were calculated based on all the 118 accessions using the Popgene32 Software. The results showed the soybean variety with larger allelic frequency had more gene diversities. For example,E3 gene identified with four alleles showed the largest gene diversity,0.5086.E4 gene with three alleles showed the smallest gene diversity,0.0355.Similar results were also observed by shannoris information index (Table 1). In details,forE1 gene,E1/e1-asshowed the largest gene frequency,0.6875,whilee1-nlshowed the smallest gene frequency,0.0476. The gene frequency ofE2 gene was 1 forE2 and 0.0635 fore2. The largest gene frequency ofE3 was 0.7619 contributed bye3-tr,and the smallest one was 0.0625 frome3-fs. ForE4 gene,the gene frequency was 1 and 0.1111 forE4 ande4-tsu,respectively (Table 2).
Significant difference in allelic frequency and diversity were observed among the three groups of the tested varieties. Minor allelic locus showed large gene frequency,while major ones showed low gene frequency. In all the four groups,e1-as,e3-trandE4 were observed with high allelic frequency above 0.4333,and the allelic frequency of other 10 alleles were below 0.4,except thate1-nlande3-fswere detected with relatively low gene frequency below 0.0169 (Table 2).e4-tsuwas observed with the lowest gene frequency in the present study. Among them,E3 gene showed the largest gene diversity,whileE4 gene showed the smallest gene diversity,indicating thatE3 gene had the most gene diversity,whileE2 gene showed no diversity with only one genotype in the early breeding period between 1923 and 1970. Groups 2 and 3 exhibited different gene frequencies.e1-asande3-trwere all observed,e1-null-fsande3-fswere also been detected (Table 2).e3-trgene possessed the highest gene frequency,0.7619,followed bye1-asgene,0.6875. Similar results could be seen in Group 3.Group 4 comprised of alien germplasm and core collection of Chinese soybean germplasm,more balanced gene frequencies were observed than other three groups,suggesting Group 4 was more diversity and should include elite germplasm available to improve the maturity and yield of the soybean variety.

Table 1 Summary of genic variation statistics for all the loci of Group 1

Table 2 Gene frequency from Groups 1 to 4 and the whole population
In the tested breeding eras,theEgene diversity fluctuated obviously. For example,E1 gene showed only two alleles,E1 ande1-asin Group1,and another allele,e1-null,appeared in Group 2 and a new allelee1-nl-asonly appeared in Group 3. Two alleles ofE2 gene were detected only in Group 3,but only one allele existed in Groups 1 and 2,suggesting that new variation occurred. Similar results could be seen for geneE3,in which Groups 1 and 3 containede3-trandE3,whilee3-fswas only identified in Group 3.However,contrary change was found in geneE4,three alleles were identified in Group 1,E4,e4-tsuandE4-null,while only one allele was detected in Groups 2 and 3,suggesting that a declining allele diversity occurred. The results suggested that not all theEgenes changed with artificial selection,someEgene alleles were disappeared and some newEalleles were generated based on the breeding goal.
Genetic distance for the 118 soybean cultivars was calculated,usingk-means clustering algorithm method. Groups 1 and 2 were clustered firstly. Then,clustered with Group 3. At last,Group 4 was clustered.These results showed more common genetic bases of soybean varieties released early than recently ones.Early released soybean varieties showed significantly vary diversities from maturityE1 toE4.
Allelic combination contrast among different maturity groups
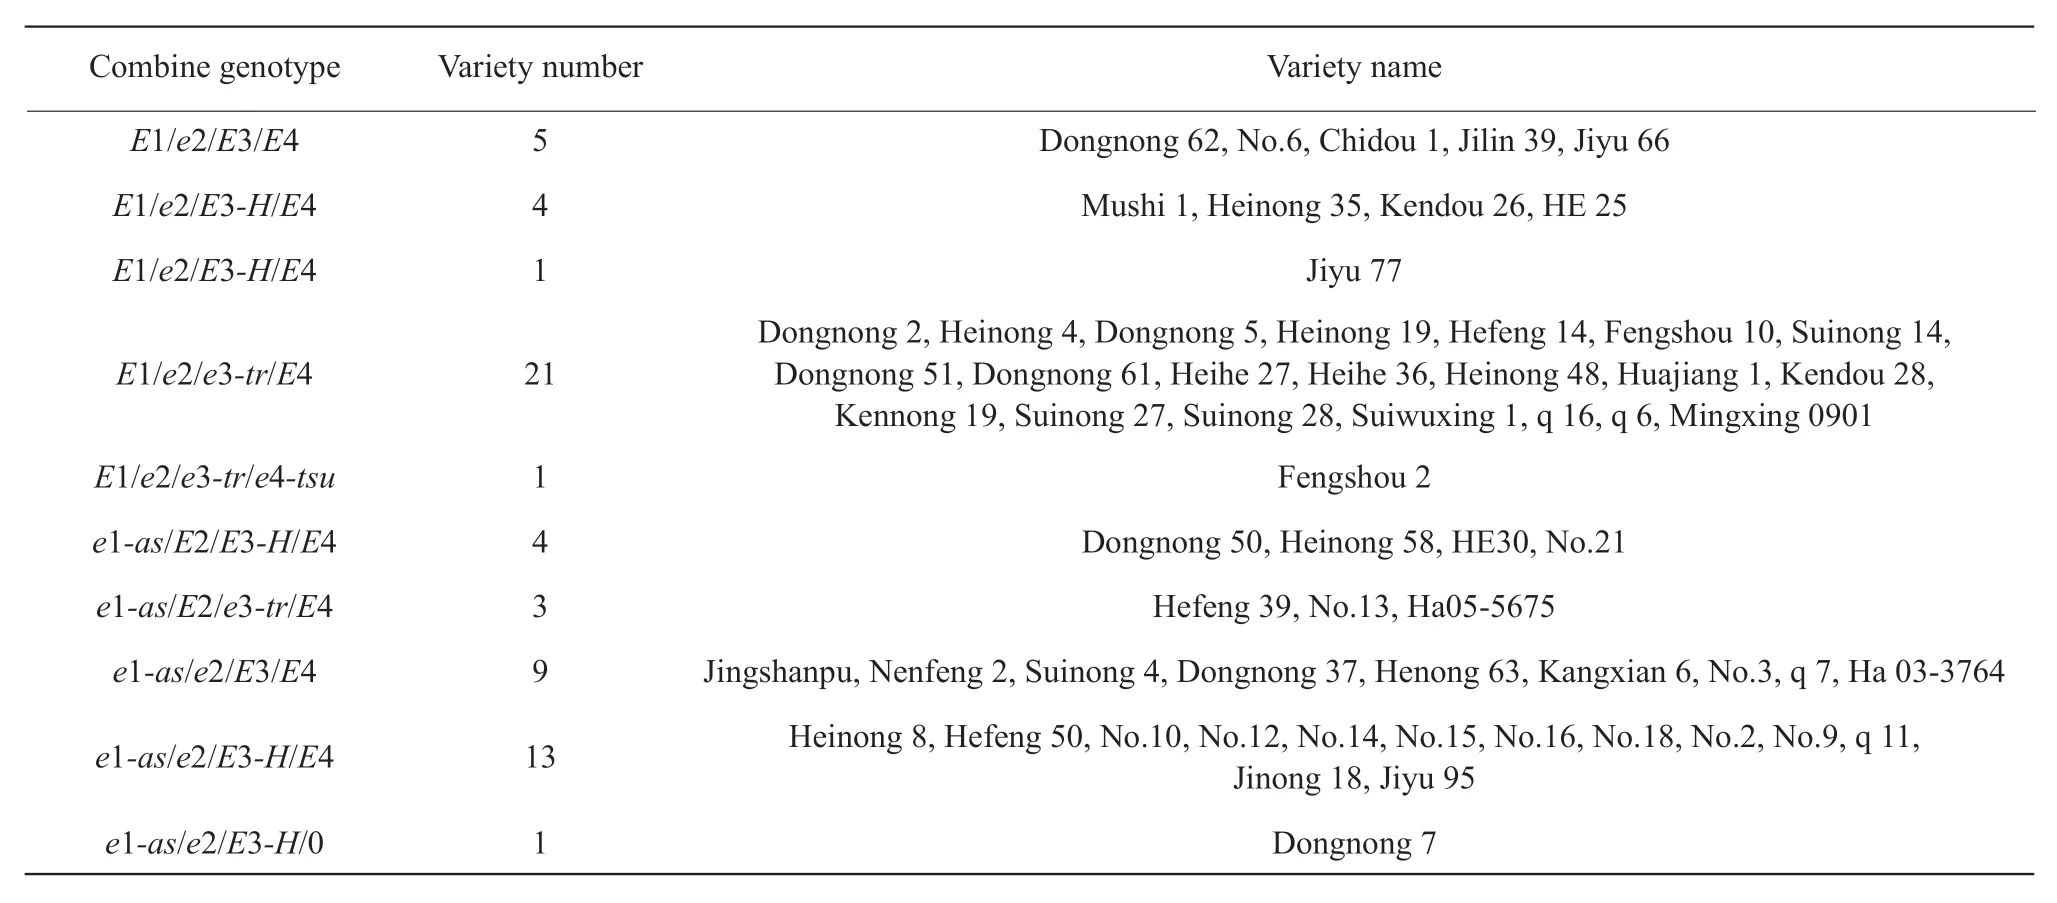
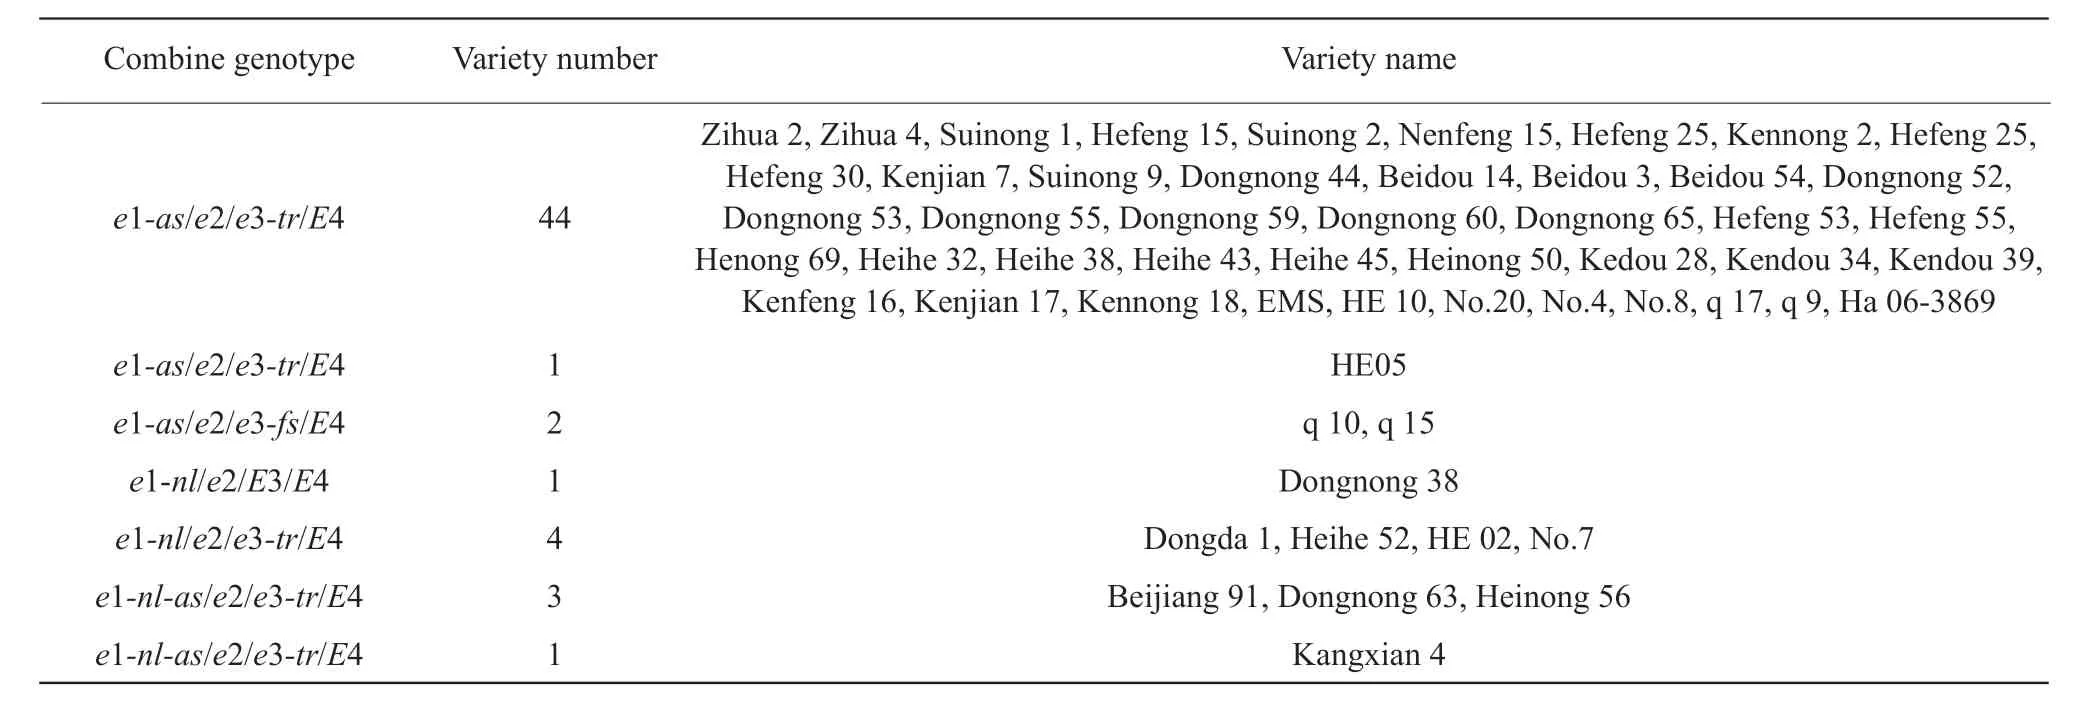
The allelic combinations of all the soybean varieties forEgene were determined. Three elite allelic combinations dominated the soybean genotypes released from Groups 1 to 3. In Group 1,six allelic combinations were observed,includingE1/e2/e3-tr/E4,e1-as/e2/E3-H/E4-null,e1-as/e2/E3-H/E4,e1-as/e2/E3/E4,e1-as/e2/e3-tr/E4 andE1/e2/e3-tr/E4. There was no hybrid soybean variety that was cultivated in north China up to latitude 50°,during the early breeding period. In Group 2,five allelic combinations were detected consisted ofe1-as/e2/e3-tr/E4,e1-as/e2/E3/E4,E1/e2/e3-tr/E4,E1/e2/E3-H/E4 ande1-nl/e2/e3-tr/E4. While in Group 3,10 allelic combinations were observed,containing allelese1-as/e2/E3/E4,e1-as/e2/e3-tr/E4,e1-as/E2/e3-tr/E4,e1-nl/e2/e3-tr/E4,E1/e2/e3-tr/E4,e1-as/e2/E3/E4,e1-as/E2/E3/E4,e1-nl-as/e2/e3-tr/E4,E1/e2/E3-H/E4 ande1-as/e2/e3-fs/E4 (Table 3). Among them,allelic combinations,E1/e2/e3-tr/E4,e1-as/e2/E3/E4 ande1-as/e2/e3-tr/E4,were observed as dominant genotypes and their genic frequencies were 0.33,0.11 and 0.22,respectively(Table 4),suggesting that these three genotypes were elite candidate lines for new soybean variety releasing in the future. Moreover,new allelic combinations were also identified in different breeding groups,such ase1-as/e2/E3-H/E4-nlin Group 1,e1-nl/e2/E3/E4 in Group 2 ande1-nl-as/e2/e3-tr/E4 in Group 3(Table 5),suggesting that new genotypes could be released,according detail demand in different breeding periods which might also be potential benefit to release new soybean lines.

Table 3 Combined allele groups of E gene of different breeding periods

Continued

Table 4 Gene frequency of combined genotypes in four groups

Table 5 Correlation related to E1 to E4 genes
Correlation analysis
Vary correlations were observed in the current study.CombinedEgenes were correlated significantly withE1,E2 andE3 genes,respectively. O'clockE2 gene was correlated with light sensitive gene,E3 (Table 5),suggesting that light length and light quality were key factors for soybean maturity in northeast China,and more efforts should be paid to these two genes to breed new early maturity soybean varieties.
Discussion
Clarification of genetic base of important agronomic traits was essential for planning further plant breeding strategies,such as parent selection (Jinet al.,2010;Hoisingtonet al.,1999). Many reports had well documented in crops,such as winter wheat (Austinet al.,1980; Brancourt-Hulmel 2003),maize (Reifet al.,2005; Castleberryet al.,1983; Tollenaar 1991;Duvick and Cassman 1999; Masukaet al.,2017) and soybean (Wilcoxet al.,1979; Boerma 1979; Jinet al.,2010).
Northeast China is the main soybean producing ecology in China. Some work had been conducted to understand the genetic shift of important agronomic traits (Liuet al.,2008). For example,agronomic and physiological changes had contributed to the yield improvement through analyzing soybean varieties released from 1950 to 2006 in northeast China (Jinet al.,2010). Yield and yield components,such as dry matter,LAI and LAD of soybean in northeast China,were documented and concluded that soybean maturity was significantly correlated to yield,yield components and harvest index (Liuet al.,2005). Upon this,information about molecular variation could also help to deeply understand the effect ofEgene variation on soybean maturity and ecological adaptation. In the present study,Egene combination ofe1-nl-as/e2/e3-tr/E4 was observed in the breeding stage of the current study and showed a new germplasm with excellent agronomic traits suitable to be widely planted in extremely early maturity region. Moreover,evident variation happened toE1,E2 andE3 gene,whileE4 gene was not,all these results suggested that artificial selection in soybean did not change all the genes,hotspot region responding to breeding selection should exist and should be pay more attention in future breeding work in soybean.
As maturity was significantly correlated with plant height,lodging resistance,seed yield and quality,maturity related traits and was not suitable to calculate genetic distance. While the molecular characteristic of soybean genotype was not shift with environmental fluctuation and could determine genetic information.So,the genotypes of 118 soybean varieties were determined using 14 DNA-specified markers. The results showed that with the development of artificial selection,the genetic distance of Groups 1,2 and 3 decreased and Group 4 kept the largest genetic distance as it's complex germplasm sources.
Soybean is important edible plant oil and protein sources. In Heilongjiang Province of China,soybean seed production occupied nearly one third of China.If the maturity period of soybean plant was too long,the soybean plants could not mature normally and get a low yield. With the help of artificial pollination,Dongnong 36 with the allele of early maturity was released with evidently shortened maturity in 1983.Later,more and more early maturity soybean varieties were released with shortened maturity and achieved a high soybean seed production. While the molecular mechanism underlying this phenomenon was not clear.
Molecular markers based on gene could benefit the clarification of adaption mechanism to different ecoregions. Nine loci related maturity plus J had been reported and four main maturity genes (E1,E2,E3 andE4) had been cloned (Liuet al.,2008; Watanabeet al.,2009; Xiaet al.,2012a,b; Thakareet al.,2010; 2011;Watanabeet al.,2011; Luet al.,2017; Yueet al.,2017). Gene-specified markers had been explored and used to clarify the maturity groups of the genotypes of soybean varieties collected from different ecological regions (Xuet al.,2013; Zhaiet al.,2014; Jianget al.,2014). In the present study,14 gene-specified DNA markers were employed to genotype the genotypes of soybean varieties released from 1923 to 2010 and widely cultivated in northeast China,which should help to clarify genetically allelic shift fromE1 toE4 genes and facilitate to introduce new germplasms from ancient soybean lines to improve the adaptation to continued changed environments in northeast China.
The genetic bases and diversities were narrow for released soybean varieties which had been well documented in China,United States,Japan,Canada,Indian and Korea using RAPD markers or SSR markers or inter-simple sequence repeat (ISSR) markers in the whole genome-wide level (Cuiet al.,2000; Donget al.,2001; Liet al.,2001; Liet al.,2008; Wanget al.,2008; Wenet al.,2009). Few gene-specified DNA markers had been explored to observe gene diversity except maturity genes conducted by Xiaet al(2012a).With the help of this method,maturity groups had been divided by Xuet al. (2013) and Zhaiet al.(2014) using soybean varieties collected from China and Japan. A few varieties with the same allelic combinations were identified,such as Heihe 45 withe1-as/e2/e3-tr/E4 in the present study and Zhaiet al(2014). Moreover,primary allelic combinations suitable for specific regions were identified. For example,e1-as/e2/E3/E4 was identified as the suitable combination to cultivate in the centraleastern Europe (Miladinovićet al.,2018),whileE1/e2/e3-tr/E4 ande1-as/e2/e3-tr/E4 occupied most the genotypes of the tested varieties in the present study. To our knowledge,no reports were published to observe the gene diversity of important traits,such as maturity of soybean varieties released in different breeding periods. In the present study,E4 showed a decreased diversity from Group 1 (the early breeding stage),to Group 3 (the current breeding stage)suggesting genetic base became narrow,while the genetic base of other threeEgenes showed a reverse change. ForE1 gene,only two different loci were identified in Group 1 (early breeding stage),while two in Group 2 (mid-breeding stage in the present study) and four in Group 3 (current breeding stage),suggesting the genetic base was broadened. Similar results could be seen inE2 andE3. The results above suggested that some genetic loci became narrow as reported by Liet al. (2001) and Liet al. (2008),while the genetic bases of some agronomic traits like maturity gene loci,E1,E2 andE3,became more diversities than before. This might result from the efforts of the continued expansion of many breeding programs. During this progress,many new germplasms appeared (Carteret al.,2004).
Conclusions
The most gene diversities were observed in soybean germplasms,suggesting that in Group 4,and new excellent germplasms could be explored to improve yield traits in artificial breeding programs. Furthermore,six differentEgene combinations were observed in the early breeding period,five in the midbreeding period and 11 in the current breeding period.Three elite genotypes were identified through a c entury artificial selection,while new genotypes were also found in different breeding periods. Of them,e1-nle2e3-trE4 was a new soybean genotype of extremely early maturity in the current breeding period,which was widely suitable for planting in 00 and 000 maturity groups. Moreover,significant correlation was found betweenE2 andE3,suggesting that light length and light quality were key factors for soybean maturity in northeast China. The understanding of theEgene variations underlying soybean maturity could facilitate the procession to breed elite varieties adapted for diverse regions.
杂志排行
Journal of Northeast Agricultural University(English Edition)的其它文章
- Spatiotemporal Change of Agrometeorological Flood Disasters in Heilongjiang Province
- Technical Parameter Optimization for Straw Fibre Mulching Film Raw Material from Corn Stalk
- Prokaryotic Expression of IBV N Protein and Development of Indirect IBV N Protein-mediated ELISA
- Effect of Zinc Acetate on Broiler Nutrient Metabolism and Skeleton Characteristic
- Effects of Facultative Anaerobic Cellulolytic Bacteria and Nitrogen-fixing Bacteria Isolated from Cow Rumen Fluid on Rumen Fermentation and Dry Matter Degradation in Vitro
- Effects of Different Feeding Methods on Behaviors,Immunities and Growth Performances of Suckling Calves
