Rapid estimation of soil heavy metal nickel content based on optimized screening of near-infrared spectral bands
2020-04-26······
· · · · · ·
Abstract In near-infrared spectroscopy, the traditional feature band extraction method has certain limitations.Therefore, a band extraction method named the three-step extraction method was proposed. This method combines characteristic absorption bands and correlation coefficients to select characteristic bands corresponding to various spectral forms and then uses stepwise regression to eliminate meaningless variables. Partial least squares regression(PLSR)and extreme learning machine(ELM)models were used to verify the effect of the band extraction method.Results show that the differential transformation of the spectrum can effectively improve the correlation between the spectrum and nickel (Ni) content. Most correlation coefficients were above 0.7 and approximately 20%higher than those of other transformation methods. The model effect established by the feature variable selection method based on comprehensive spectral transformation is only slightly affected by the spectral transformation form. In five types of spectral transformation,the RPD values of the proposed method were all within the same level. The RPD values of the PLSR model were concentrated between 1.6 and 1.8,and those of the ELM model were between 2.5 and 2.9, indicating that this method is beneficial for extracting more complete spectral features. The combination of the three-step extraction method and ELM algorithm can effectively retain important bands associated with the Ni content of the soil. The model based on the spectral band selected by the three-step extraction method has better prediction ability than the other models. The ELM model of the first-order differential transformation has the best prediction accuracy (R2P = 0.923, RPD = 3.634). The research results provide some technical support for monitoring heavy metal content spectrum in local soils.
Keywords Heavy metal · Band extraction · Partial least squares regression · Extreme learning machine · Near infrared spectroscopy
1 Introduction
Soil is the natural basis for human activities and survival and an important resource for agricultural production.Heavy metal nickel (Ni) is one of the essential micronutrients for tall plants and certain microorganisms.However,it is also a toxic element at high concentrations and causes serious harm to the environment and human health(Achary et al.2016;Pu et al.2019).The traditional measurement of heavy metal in soils is accurate but expensive and timeconsuming because it requires sample treatment.Rapid and cheap methods are necessary for predicting and monitoring changes in heavy metals in soils in specific areas and for overcoming the obstacles of traditional measurement. The hyperspectral inversion of the Ni content of the soil is a good method that is superior to laboratory analysis in terms of time and cost savings (Chakraborty et al. 2017).
Numerous researchers have explored and studied the spectral response of heavy metals and proven the feasibility of predicting heavy metals in soil by spectroscopic reflectance(Moros et al.2009;Chakraborty et al.2017).Several studies have suggested that the relationship between soil spectrum and heavy metal content may be supported by the nature of soil (Tang and Han 2017). The spectral response of heavy metals in soil and vegetation can be studied by correlation analysis for the identification of the most sensitive bands (Zhang et al.2017). The soil spectra are weak and nonspecific because of the overlapping absorptions of some components.Hence,mathematical statistical methods are often needed to extract the spectral information of the soil (Wang et al. 2016). Moreover, variable extraction is important to the establishment of a model, where the prediction effect of the model will probably be affected.Several studies have proven that the selection of variables has many nonnegligible effects on the model (Jing et al.2016). In the previous study, the band selection method was single and unexplained, and the spectral information contained was incomplete (Jiang et al. 2017). When using the multivariate stepwise regression method to establish a full-band model,the model only selects the relevant feature bands as modeling variables. The bands that are weakly related to heavy metals are ignored. The band is selected according to the mathematical selection rules of the variables, and the explanatory is weak (Zhang et al. 2015).When the regression model is built with the full band, the independent variable is excessively large and thereby generates data redundancy and affects model performance.The use of spectral reflectance and soil heavy metal correlation analysis results in a large number of significant correlation bands and thus increases the complexity of model processing and calculation and reduces the accuracy of the estimation of regression model parameters and the prediction of dependent variables (Ramachandran and Tsokos 2015). Therefore, an optimal spectral band selection method must be established.Traditional linear models have many shortcomings in considering the relationship between soil spectra and soil properties. Complex and stable models and methods are therefore needed to analyze this relationship. Many studies have used partial least squares regression (PLSR) models to estimate the heavy metal content of the soil. These methods can extract variables with more characteristics(Wu et al.2006;Pandit et al.2010).In recent years,machine learning has attracted widespread attention and has been successfully applied to various issues such as regression and classification.Moreover, many studies have used extreme learning machines (ELM) or back propagation to perform hyperspectral predictions of heavy metal contents in soils(Shrivastava and Panigrahi 2014).
The present study took place at the Houzhai River Basin in Guizhou Province of China where research was done on the Ni content of the soil. Ni is among the eight key elements specified by the national standard for assessing heavy metal pollution in soils. First, the influence of variable selection method on the model is discussed.Then,the effects of ELM and PLSR algorithms on the model’s effect are compared. The results have important scientific significance for the rapid and effective monitoring of soil content in karst areas.
2 Materials and methods
2.1 Research area
The Houzhai River Basin is located in Puding County,Guizhou Province,and is a typical plateau karst basin.The geographical position is 105°40′–105°49′E and 26°12′–26°18′N, with a total area of about 81 km2. The terrain is high in the southeast and low in the northwest. It is open and flat,with an altitude of 1100–1400 m,belonging to the subtropical monsoon climate zone. The relative height difference is generally between 250 m and 300 m, with a maximum of 311 m. The Triassic carbonate rocks in the Houzhai area are widely distributed,while the underground river system in Houzhai is quite developed, with constant runoff all year round and is an important water supply source for the area.Figure 1 shows the location map of the study area.
2.2 Sample collection and measurement
The technical roadmap of this study is shown in Fig. 2. A total of 100 sampling points were set based on the topographic features,land cover types,and corresponding areas of each region. The samples included yellow earth, paddy soils, limestone soils. The sampling depth was 20 cm. The sampling site was divided into 4 layers such that each layer was 5 cm thick. In addition, 100 g of soil were collected per layer,and the 4 layers of soil samples were mixed to be the soil sample corresponding to the sample point. Sand and gravel were removed after the sample was dried. Each sample was divided into two sections and filtered using a 200 and a 100 mesh sieve, respectively. The obtained fine particles were used for heavy metal content measurement and spectral data measurement.

Fig. 1 Map of the study area
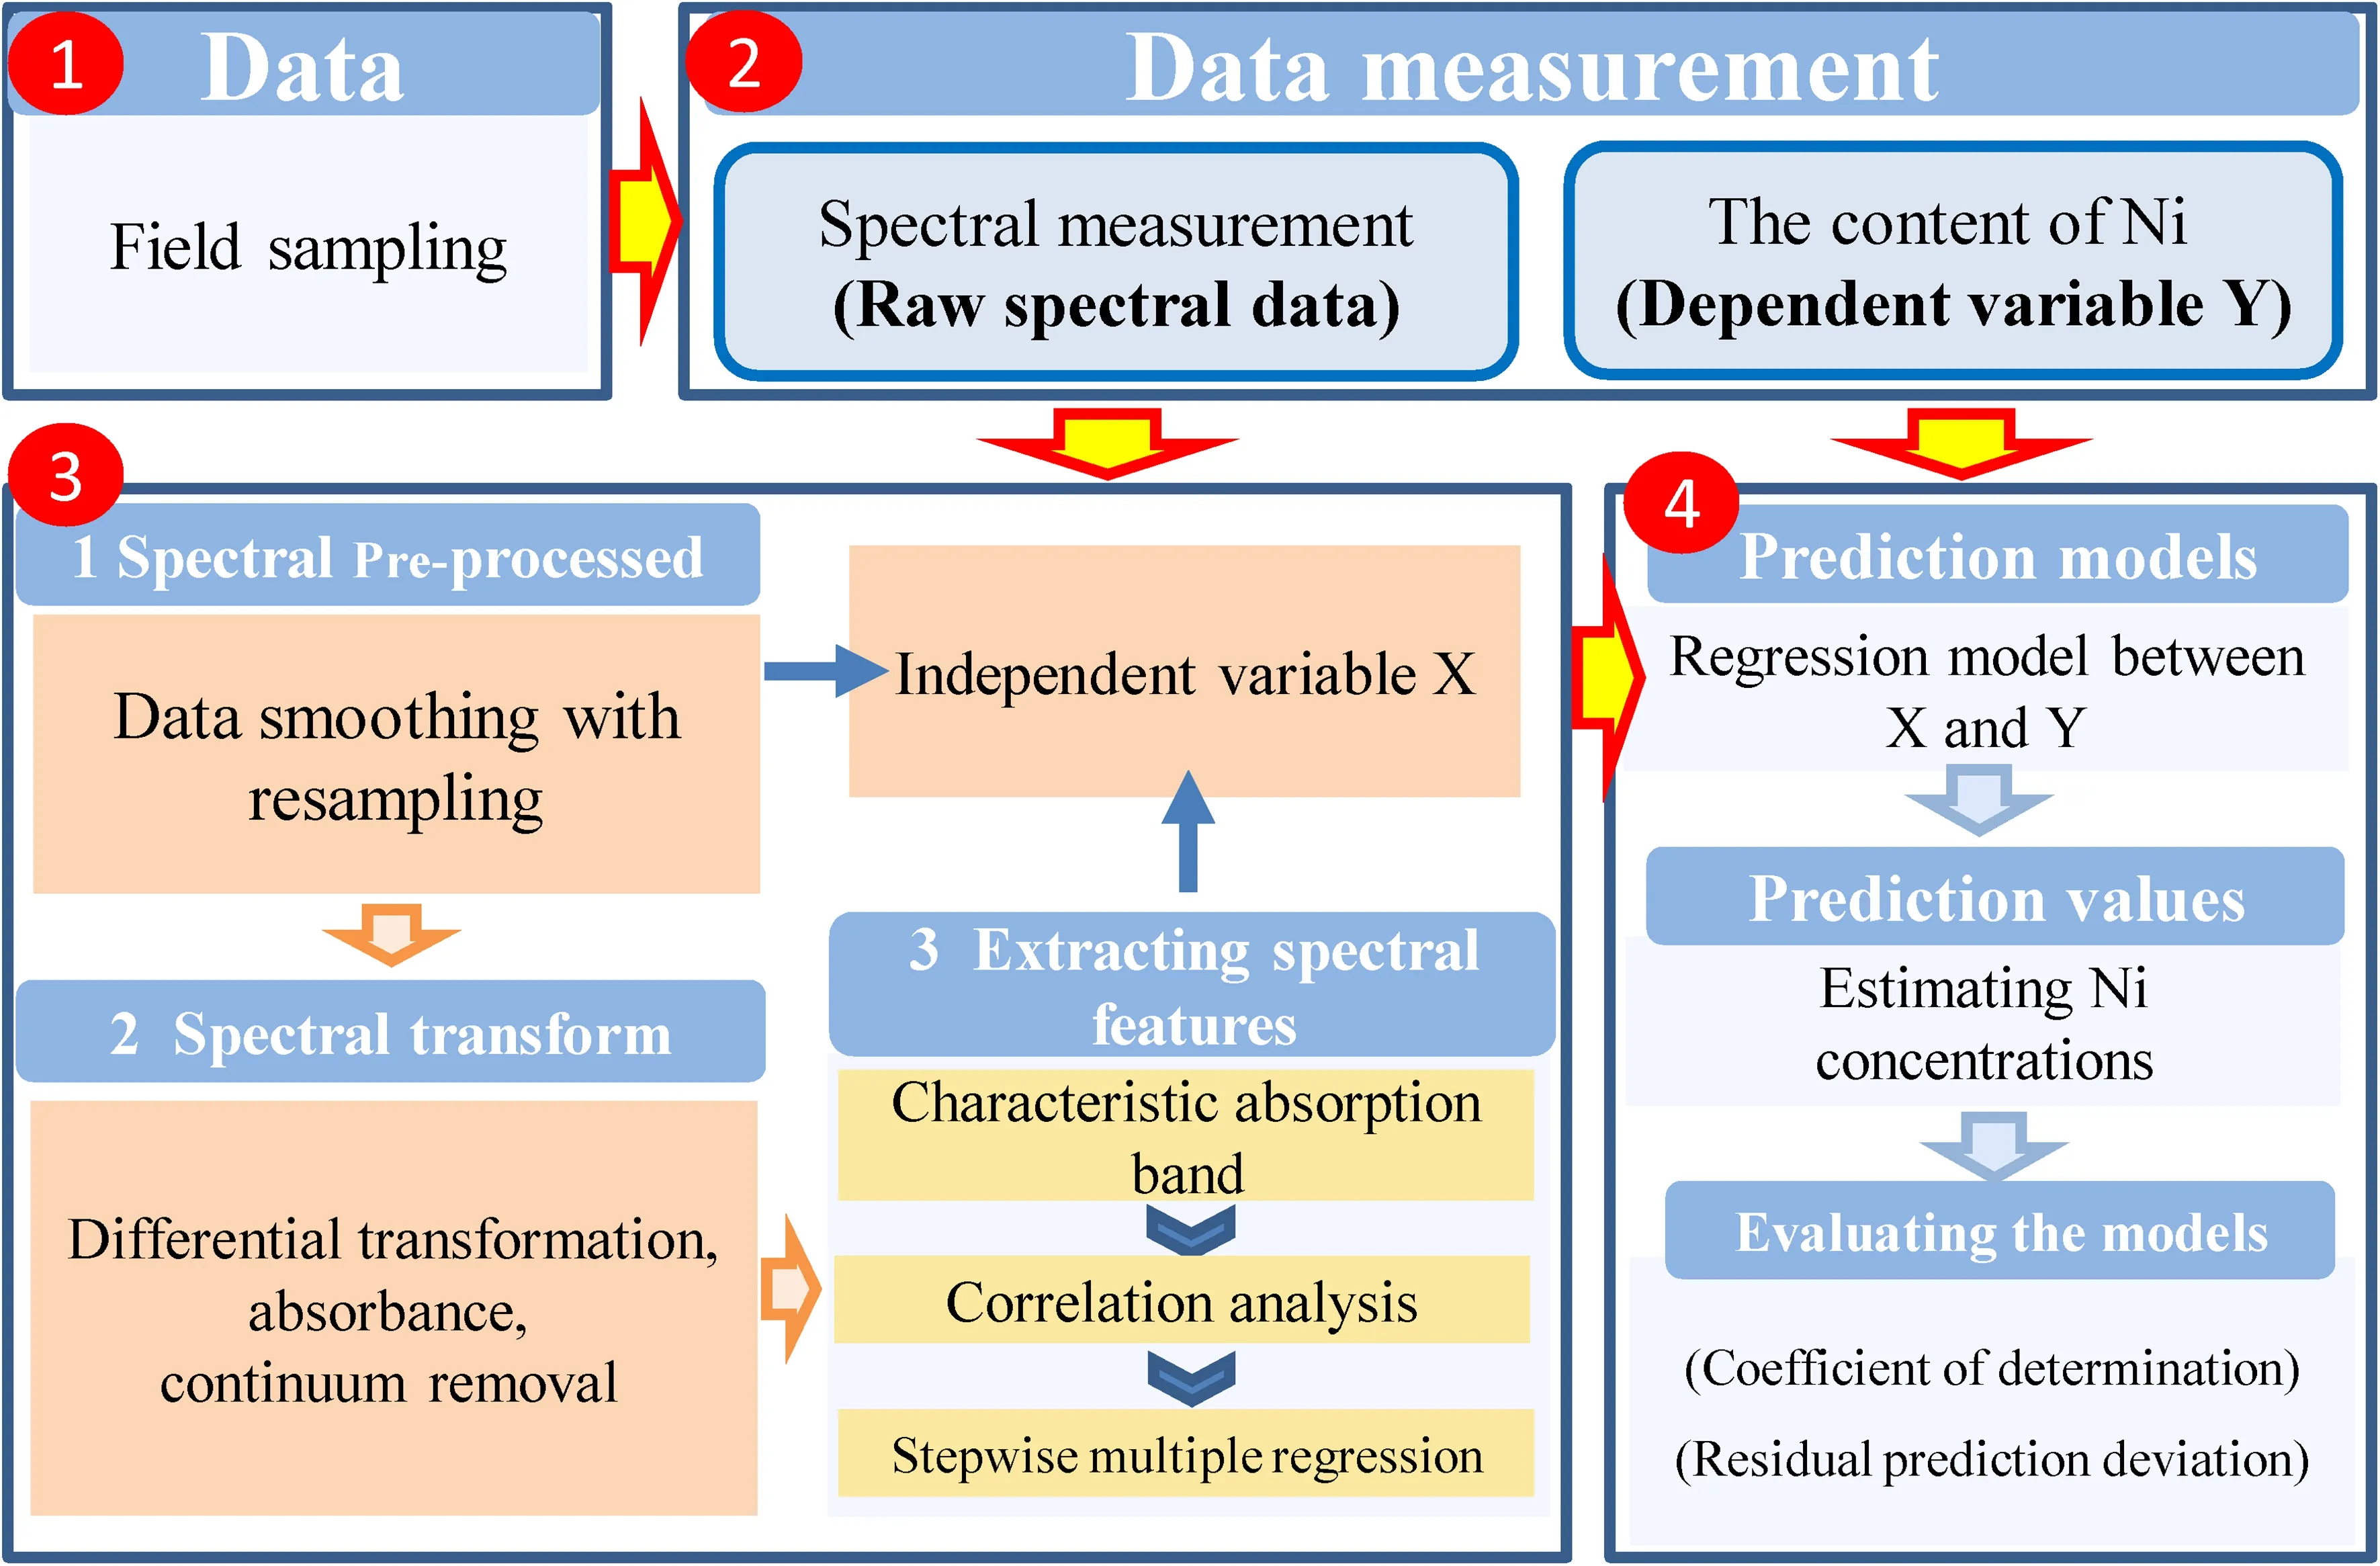
Fig. 2 Flowchart of the analysis
The soil samples were preprocessed by electric heating board acid(HNO3–HCL–HCLO4–HF)digestion before the heavy metal concentrations were measured.The Ni content was measured by inductively coupled plasma mass spectrometry (ICP-MS, Thermo Electron, USA). The spectral data of the soil samples were measured using an ultraviolet–visible-near-infrared spectrophotometer covering a spectral range of 500–2500 nm.Each sample was tested 10 times in succession, and the 10 results were arithmetically averaged as the final spectral data of the soil sample.However, the error was inevitably affected by random factors during the spectrometry. In order to reduce the error, the outliers were removed from the samples using The Unscrambler software. After removing 4 outliers, 96 samples remained.
2.3 Spectral pre-processing
Due to the interference of the spectrometer itself and external factors, there were many abrupt ‘‘burrs’’ in the shape of the obtained spectral curve. Savitzky–Golay convolution smoothing was adopted to remove the noise,and then resampled the smoothed spectra at an interval of 10 nm to reduce redundancy. The band reflectance mentioned below is the reflectance after resampling, for example,the reflectance of the 500 nm band is the average of the 500–510 nm spectral data.
Spectral measurement is easily affected by many factors such as observation angle,illumination,and sample surface roughness.Low-frequency noise is also an important factor affecting the quality of spectral data. Pre-processing can eliminate the effects of baseline drift or smooth background interference and provides higher resolution and clearer spectral contour transformation than the original spectrum. On the basis of smoothing and resampling, the spectral data is further transformed into a differential transform, continuum removal, and reciprocal logarithmic transformation.
2.4 Establishment and validation of predication models
PLSR is a multiple regression analysis method that reveals the main control factor of the maximum change in content from the spectral data while reducing the spectral dimension (Wold et al. 2001). Thus, the established model exhibited better robustness.ELM is a new efficient learning algorithm (Guo et al. 2015). In our study, the excitation function of ELM was the‘‘sig’’function,and the number of best-hidden nodes of ELM was found by changing the number of nodes (the node was increased from 4 to 30 to increase 2). The results were unstable because of the random selection of the initial weight values of ELM.Therefore, each model structure was tested 600 times, and the number of hidden layer nodes was decided by considering the smallest average of iteration results. Finally, the best model was screened out. The models were built in Matlab2016.
The coefficient of determination (),root mean square error (RMSEp) and residual prediction deviation (RPD)were used as standard methods for verifying the predictive model.The predictions were evaluated using the following criteria: RPD andvalues greater than 2.0 and 0.80 are good predictive; RPD values are between 1.5 and 2.0, andvalues are between 0.51 and 0.80, and approximate predictions are determined (Chang et al. 2001).
3 Results and discussion
3.1 Soil nickel content and spectral properties
The statistics of the samples are presented in Table 1. The Ni content in the study area was generally high. The Ni contents of 83 samples exceeded the soil background value of Guizhou Province (32.9 mg/kg). According to the national soil quality standard (GB 15618-2018) risk screening value (100 mg/kg), the Ni contents of seven samples exceeded the standard, and the over-standard rate was 7.29%.In general,the risk of heavy metal pollution in the soil is low. The data from 96 samples were arranged from low to high Ni content, and one out of every three samples was used as a verification sample to test the accuracy of the model. Thus, 32 samples were verification samples. The remaining 64 models were used as modeling sample sets to ensure that the modeled samples were consistent with the scope of the validated samples and evenly distributed. The average and standard deviation of the modeled sample set and the test sample set were close.The distribution of the sample was balanced.
The original reflectance and continuum removal spectra of the representative samples of the four Ni concentration gradients were selected to plot trends (Fig. 3). The waveforms of the spectral curves were roughly the same;that is,the waveforms formed an upward parabolic shape(Fig. 3a). In the spectral range of 500–1300 nm, the curve rapidly rose. The curve changed gently after the wavelength exceeded 1300 nm. After the wavelength of 1800 nm,the Ni content of soil was higher than 67.62 mg/kg, and the spectral curve had a downward trend. The spectral curve of the 23.14 mg/kg sample was flat, and the change was small, but the absorption characteristics still exist. On this basis, the low-concentration sample had a weak response to the spectrum. The overall trends of the two samples at low concentrations was essentially the same(23.14 and 67.62 mg/kg). The samples with high concentrations(119 and 160 mg/kg)also had the same trend.The soil types of the two types of samples belong to lime soil and yellow soil. The overall change in the spectral curve was affected by the soil type. Studies have found that different soil components have different absorption levels.The adsorption of heavy metals by soil components provides an opportunity for estimating heavy metal content with the spectrum (Xu Binbin 1995).
As shown in Fig. 3b, the continuum removal transformation can effectively suppress the influence of the background light and enhance the absorption characteristics of the spectrum, such as absorption characteristics at wavelengths of 900, 1900, and 2200 nm. Three distinct absorption peaks appeared around 1400, 1900, and 2200 nm and are generally associated with kaolinite in clay minerals (Clark et al. 1990). Meanwhile, the spectral absorption characteristics of vermiculite were mainly at 1400 and 1900 nm.Small absorption peaks were present in the vicinity of the 500, 800, and 1000 nm bands. These absorption peaks were affected by the concentrations of heavy metals. The absorption characteristics became increasingly evident with increasing Ni content. Studies have shown that iron ions in the oxide cause some featuresin the spectral ranges of 500–600, 610–800, and 810–1240 nm (Shi et al. 2013). On this basis, the spectral characteristic absorption band is in the ranges of 500–580,610–1240, 1320–1650, 1830–2100, and 2140–2500 nm.
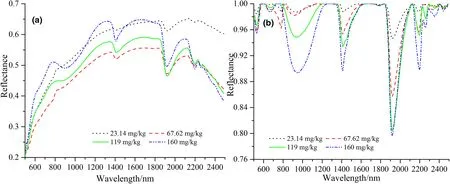
Fig. 3 Spectral curves of four Ni concentration samples: a original reflectance spectrum and b continuum removal spectrum
3.2 Three-step extraction method of wavebands
The five characteristic absorption bands of the spectrum are determined through the continuum removal transformation of spectral reflectance. On the basis of the correlation analysis between the reflectivity of these bands and the Ni content of the soil, the correlation between the Ni content of the soil and the spectral reflectance is taken as the standard for the elimination of weak correlation bands and retention of significant correlation bands. Then, the multivariate stepwise regression model is used to eliminate the variables in the remaining bands that have no significant influence on the dependent variable (the Ni content of the soil). Finally, the characteristic bands of various transformed forms of the spectrum are obtained. The stepwise regression method can gradually select variables in accordance with the contribution values to screen the model variables with the best regression effect. The multivariate stepwise regression method selects and rejects the probability P value of the F statistic. In this method, the entry value is set to 0.05,and the removal value is set to 0.1.The criterion for correlation is a two-tailed test with P value less than 0.01.
As shown in Fig. 4, many bands in the near-infrared spectral range are strongly correlated with the Ni content of the soil. Spectral transformation can improve the correlation between the spectrum and the Ni content of the soil.The first-order differential (Fig. 4b) and second-order differential (Fig. 4c) of the spectral reflectance are in the interval between the two bands of 610–1240 nm and 1320–1650 nm, respectively. The correlation has a significant impact,and the correlation coefficient is significantly improved. The correlation coefficient between the original spectrum and the transformed spectrum is high in the intervals 183–2100 nm and 2140–2500 nm. Therefore, the bands in these two intervals play an important role in predicting the Ni content of the soil. A significant correlation exists between the spectral reflectance in the range of 500–580 nm and the Ni content of the soil. Heavy metal adsorption experiments show that soil organic matter and clay minerals have a certain retention capacity for Ni. The spectral characteristics of clay minerals are around the 1900, 2200, and 1400 nm bands. The 570 and 660 nm bands are important to the prediction of soil organic matter(Rossel et al. 2006). These bands, which have been shown to be correlated with the Ni content of the soil,are included in the selected five characteristic absorption bands. However, the possibility of using other bands in the absorption bands of these features remains unknown. Therefore, further screening is needed. By using the abovementioned methods, the characteristic bands corresponding to different spectral transformations are extracted separately.The bands are indicated by dashed lines in Fig. 4. Each characteristic band corresponds to a high correlation coefficient value, and most of the bands correspond to the valleys of the spectral curve. On this basis, these characteristic bands are representative.
‘Are you the girl,’ he said, turning his eyes away as he spoke38, ‘are you the girl who has a room in the furthest corner of the inner court of the farmhouse46?’
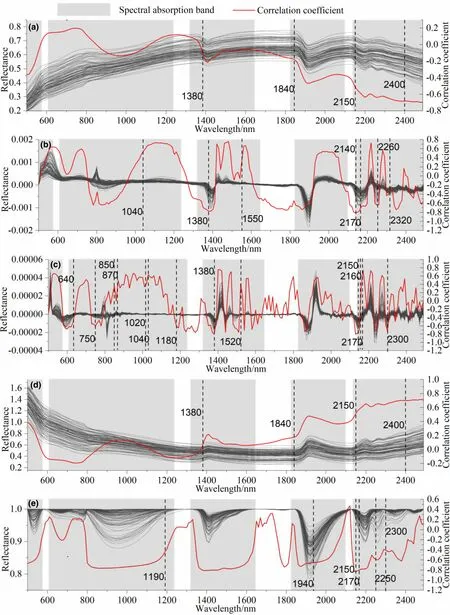
Fig. 4 The correlation coefficient between spectral reflectance of soil and Ni content and its spectral transformation. a Raw spectra, b first differential, c second differential, d absorbance transformation and e continuum removal
3.3 Influence of the band extraction methods on the performances of the Ni models
3.3.1 Models based on three-step extraction method
In accordance with the spectral bands selected by the different methods, the Ni content prediction model was established by PLSR and ELM methods,and the prediction accuracy of the model was compared. Table 2 shows that the Ni content was predicted with the highest precision by models established using the derivatives of the spectrum data. These preprocessing techniques can effectively eliminate noise and enhance the signal-to-noise ratio of the original spectrum without destroying its characteristics.
The model established by the significantly correlated band is better than the model established by the absorption band alone. Furthermore, the highly correlated band can effectively explain the relationship between the spectral reflectance and the Ni content of the soil. The prediction accuracy of the model can reach 0.7–0.8. The stability of the model established by the ELM method is greater than 2.Therefore, these models can roughly estimate the Ni content of the soil in the study area. However,as a whole, the stability of the model established by PLSR was poor.Meanwhile, the model established by CR spectral transformation had a low effect of only 0.569,and the error was large.On the basis of the defects of the two band selection methods, namely, the characteristic absorption band and the significant correlation band,a comprehensive three-step extraction method was proposed.As shown in Table 2,the band selected by the three-step extraction method contributes to the improvement of model accuracy and stability. PLSR and ELM methods have good prediction effects.The accuracy of the model R2Pestablished by PLSR is around 0.7, and the accuracy of the PLSR model established by CR spectral transformation reaches a good level (R2P= 0.856, RMSEp = 9.856, RPD = 2.674). In the ELM model, the three spectral transformations of FD, SD,and CR show a good performance. The FD-ELM model has the best performance (R2P= 0.923, RMSEp = 7.253,RPD = 3.634)and accurately predicts the Ni content of the soil. The three transformation modes of FD, SD, and CR can enhance the characteristic information of the original spectrum. By combining the three-step variable extraction method, the spectral characteristic bands related to the Ni content of soil can be extracted completely,and an accurate prediction model can be established.
Figure 5 shows the comparison of the estimated values of the best PLSR and ELM models on the basis of the different variable selection methods.The modeling effect improves as the samplepoint linegraphbecomesclose.Comparedwiththe model SD-PLSR (Fig. 5a) and the SD-PLSR (Fig. 5c), the SD-PLSR(Fig. 5c)predicts Ni more accurately(Fig. 5f).The predictedvalue ofthe FD-ELMmodelisclose tothe measured value,and the fitting effect is the best.The highest R2Pand the lowest RMSEp value was obtained (R2P= 0.923,RMSEp =7.253,RPD = 3.634).The results in Fig. 5 and Table 2 are mutually validated.The accuracy and stability of the model established by the ELM method are generally better than the model established by the PLSR method.The reason is that the ELM model not only achieves good accuracy but also maintains fast training speeds and responsiveness.By disregarding the iterative steps, the ELM can be trained quickly and a successful training model can be achieved.
3.3.2 Comprehensive spectral transformation selects the band
The characteristic bands selected by different spectral transformations were combined into a comprehensive feature variable set; that is, 22 bands, namely,640, 750, 850, 870, 1020, 1040, 1180, 1190, 1380, 1520,1550, 1840, 1940, 2140, 2150, 2160, 2170, 2250, 2260,2300, 2320, and 2400 nm were selected. The models were established by PLSR and ELM methods with their corresponding reflectance as independent variables and soil Ni content as the dependent variable. The lowest RMSEp and maximum value of R2Pwere the main criteria for calculating the models in this study.
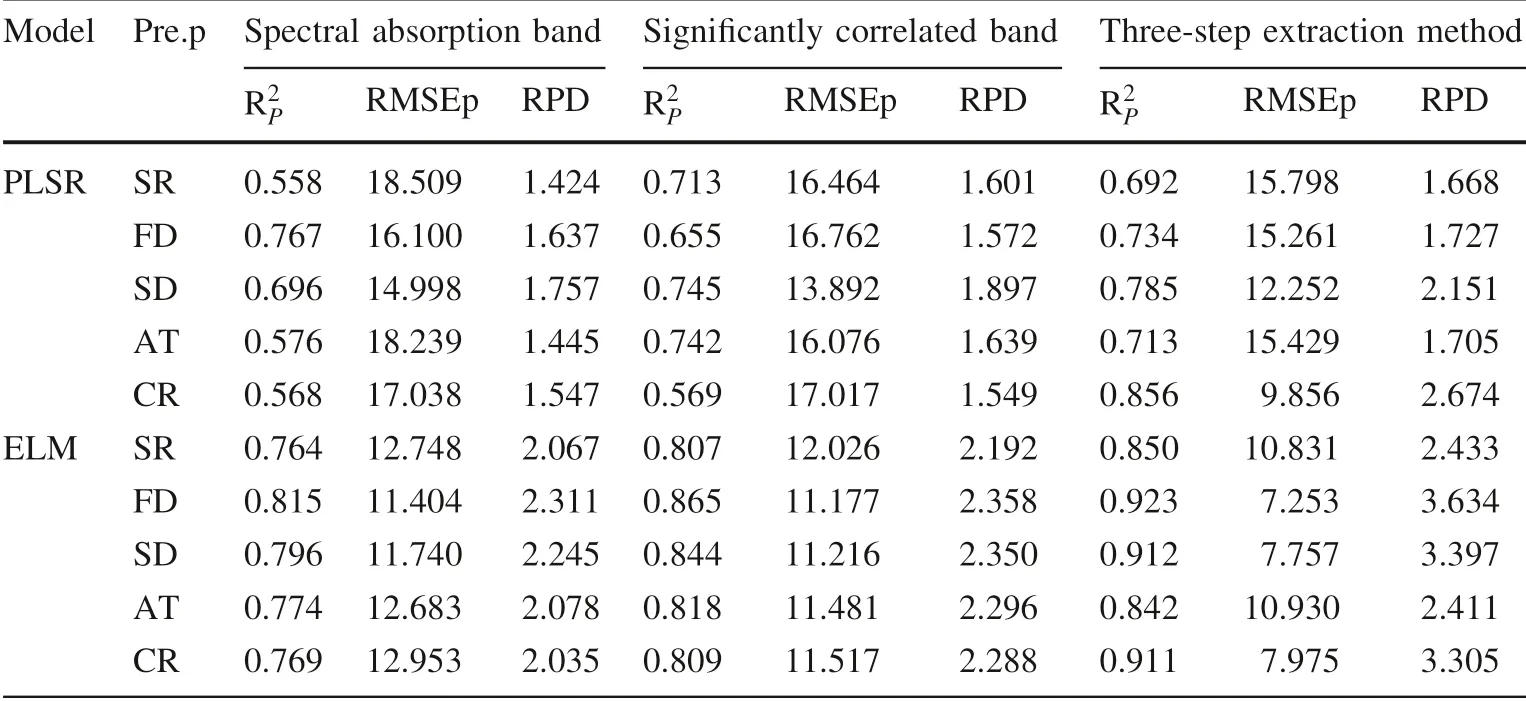
Table 2 The parameters of Ni content prediction models based on different feature variables selection methods
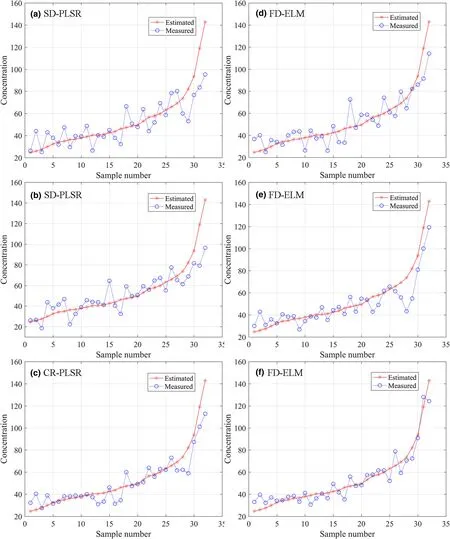
Fig. 5 Scatterplots of measured versus predicted nickel (Ni) concentrations of soil: a, d spectral absorption band; b, e significantly correlated band; c, f three-step extraction method
As shown in Table 3, the results of the PLSR and ELM models have similar trends. The SD-PLSR had a high R2pvalue, that is, 0.727 (Table 3). The FD-ELM model had good predictable results and the R2pand RMSEp values were 0.877 and 9.114, respectively. In sum, the effect of the model established by the comprehensive spectral bands set under different spectral transformation conditions isbetter than those of the other models, and the variation range is small. The RPD values of the PLSR model were concentrated between 1.6 and 1.8. The RPD values of the ELM model were between 2.5 and 2.9. Different spectral transformations have less influence on the accuracy of the model and are generally at the same level. Therefore, in terms of model promotion ability,the ELM model based on the comprehensive spectral transformation method has a good effect, that is, the prediction model can perform well without the mathematical transformation of the original spectrum. Of course, FD-ELM model has the best overall effect among the models.

Table 3 The parameters of Ni content prediction models based on the method of selecting the feature variables of integrated spectral transformations
The prediction model established by the comprehensive spectral band is weakly affected by the spectral transformation form.The prediction ability of the model is affected by the modeling method,and the spectral transformation is not dominant. These results are obtained possibly because the primary function of the spectral transformation is to amplify unapparent spectral features in the original spectrum to select characteristic spectral bands. The comprehensive band set is selected on the basis of various spectrally transformed spectral bands and contains most of the spectral features. Therefore, the model established using the comprehensive feature variable set based on comprehensive spectral transformation is almost unaffected by the spectral transformation mode. The differences in performance among the five models in Table 3 are small.
3.4 Evaluating the models
The traditional method of band selection is single, and its interpretation is weak (Choe et al. 2008). Therefore, some insignificant variables should be discharged, and an optimal subset of independent variables should be established.However, if the regression model is established using the least relevant or few bands, then other characteristic bands may be lost, and the established model might become unstable(Liu et al.2011).As shown in Tables 2 and 3,the model based on the three-step extraction method generally has a better effect than the model based on the traditional single-band selection method.For example,the accuracy of the PLSR model changes clearly.Hence,a large amount of spectral band information can be obtained by transforming the spectrum. The corresponding feature band information selected by a single method cannot effectively express the relationship between spectral reflectance and heavy metal content. The resulting model has weak predictive ability and low precision. As shown in Table 2, the PLSR model with the differential transformation of reflectance and absorbance as the independent variable has the best effect,and the fitting effect of the model is above 0.7. The prediction ability of the ELM model established by using reflectance and absorbance is poor. However, the prediction ability of the ELM model established by other spectral transformation forms is good. Hence, the differential transformation of the spectrum contributes to the improvement of the predictive ability of the model. As shown in Table 3,for the integrated spectral transformation method, although the influence of the spectral transformation is not obvious,the prediction effect of the model is approximately 0.7–0.8. Compared with the models established by the spectral absorption band and the significantly correlated band, the PLSR and ELM models have improved the model prediction ability. The selected bands after the comprehensive spectral transformation contain complete information. Thus, the excess bands are eliminated in the stepwise regression process, thereby leaving significant spectral information correlated with the heavy metal content. The different spectral transforms can highlight the different characteristic bands, and the number is limited. Therefore, the bands selected by combining multiple spectral transforms are more representative and can explain more spectral information than the other bands.
Regardless of the band selection method used to build the model,the prediction performance of the ELM model is always superior to that of the PLSR model.The advantages of the ELM can be explained by the ability of neural networks in handling nonlinear relationships between metal elements and spectra. Similar results that showed the best performance of ELM models have been reported (Chen et al. 2015). The comparison of the results of the two models showed that the ELM model not only has the best accuracy but also has the fastest speed. As shown in Tables 2 and 3, the RPD values of the ELM model are all above 2.0.Thus,the model can predict the concentration of heavy metals in the soil well. In addition, as shown in Fig. 5, the predicted value of the ELM model is closer to the measured value, especially in the low concentration range.This phenomenon is probably due to the fact that the ELM algorithm with high generalization ability avoided many problems, such as learning rate and local minima(Zhu et al. 2005). ELM can be fast in the training model because no iterative step is required.
4 Conclusions
This article proposes a method for screening characteristic bands by combining with spectral features, a correlation coefficient method, and a stepwise regression method. On the basis of the reflectivity of the different forms of spectral transformation, the Ni content prediction model based on different variable selection methods was established by using PLSR and ELM methods, and the prediction ability of the model was verified. A comprehensive set of bands was formed by synthesizing the characteristic bands corresponding to the five spectral transformations.Finally,the influence of the comprehensive spectral transformation on the model was discussed.The following conclusions can be drawn:
More spectral band information can be obtained by spectral transformation processing. The spectral band of the differential transformation (namely, first and second differentials)is significantly correlated with Ni content.For example, at 1380 nm, the correlation coefficient is above 0.750. Therefore, the differential transformation can effectively acquire the spectral sensitivity band of the soil.
The prediction accuracy of the model based on the feature variable selection method based on comprehensive spectral transformation is less affected by the spectral transformation form. The RPD values of the PLSR model are concentrated between 1.6 and 1.8.Meanwhile,the RPD values of the ELM model are between 2.5 and 2.9, at the same level. The model change trend is stable under different spectral transformation modes. Hence, the variable selection method of the comprehensive spectral transformation is beneficial to extract complete features.
The model established based on the spectral band selected by the three-step extraction method has the best prediction ability. Meanwhile, the ELM model can improve the stability and accuracy of the prediction. The ELM model under the first-order differential transformation has the best precision (R2Pis between 0.82 and 0.94), which is better than the prediction model based on the PLSR method. Therefore, the combination of the three-step extraction method and the ELM algorithm can effectively retain the important bands associated with the Ni content of the soil,and the model prediction effect is the best (R2P= 0.923, RPD = 3.634).
AcknowledgementsThis research work was supported jointly by the National Key Research Program of China (Nos. 2016YFC0502102,2016YFC0502300), ‘‘Western light’’ talent training plan (Class A),Chinese academy of science and technology services network program(No.KFJ-STS-ZDTP-036)and international cooperation agency international partnership program (Nos. 132852KYSB20170029,2014-3),Guizhou high-level innovative talent training program‘ten’’level talents program (No. 2016-5648), United fund of karst science research center (No. U1612441), International cooperation research projects of the national natural science fund committee (Nos.41571130074, 41571130042), Science and Technology Plan of Guizhou Province of China (No. 2017–2966).
杂志排行
Acta Geochimica的其它文章
- Chemical structure of the Earth’s mantle defined by fast diffusion elements like helium
- A helium stratified and ingassed lower mantle: resolving the helium paradoxes
- Mechanism of accelerated dissolution of mineral crystals by cavitation erosion
- Zircon chemistry and new laser ablation U-Pb ages for uraniferous granitoids in SW Cameroon
- Zircon U-Pb age and geochemical constraints on the origin and tectonic implication of the Tuotuohe Cenozoic alkaline magmatism in Qinghai-Tibet Plateau
- Evaluation of the potential risks of heavy metal contamination in rice paddy soils around an abandoned Hg mine area in Southwest China
