Evaluation of the potential risks of heavy metal contamination in rice paddy soils around an abandoned Hg mine area in Southwest China
2020-04-26····,·
· · · ·, ·
Abstract To assess the potential ecological and health risks of trace elements(Hg,Cd,As,Mn,Sb,Pb,Cu,Ni,Cr,and Zn),a total of 138 soil samples from rice paddies were collected during the rice harvest season in the Wanshan mining area, Guizhou Province, Southwest China. Factors of the pollution load index (PLI), geo-accumulation index(I-Geo), enrichment factor (EF), and risk index (RI) were determined. High concentrations of Hg, Sb, As, Zn, Cd,Cu,and Mn were observed in the soils.The PLI,I-Geo,and EF results all showed high levels of contamination by Hg and Sb and moderate levels of contamination by As, Pb,Zn, Cu, Cd, and Mn. There was no significant contamination from Ni and Cr. The RI was very high, with Hg as the dominant pollutant, as expected, indicating that the historical large-scale Hg mining, as well as artisanal mining, has had a significant impact on the Wanshan area.Moreover, coal combustion, manganese factories, and the use of agrochemicals by the local population could also have an impact on the soil through the introduction of heavy metal loads. To address the current state of contamination, pollutant remediation and the regulation control of the anthropogenic activities in Wanshan are urgently needed.
Keywords Heavy metals · Ecological risk index ·Wanshan Hg mining area
1 Introduction
Mercury (Hg), characterized by its high toxicity, is known to be a global pollutant that presents high exposure risk(Clarkson 1998; Schroeder and Munthe 1998; Lindqvist et al.1991).Due to the massive consumption of energy and resources required by China’s rapid economic development, many areas across the country have suffered from environmental impacts caused by Hg. According to preliminary studies, more than 80% of the Hg emissions released into the atmosphere have been caused by two main sources: nonferrous metal smelting and coal combustion(Wu et al. 2006; Li et al. 2012, 2015; Fan et al. 2017; Xu et al. 2016, 2017). Of the estimated 402 tons of atmospheric mercury emissions from China in 1995, coal combustion was estimated to contribute 145 tons,or 36.1%(Feng 2005). In 2000, the smelting of zinc, lead, and copper contributed an estimated 222.1 tons to the atmospheric mercury emissions (Wu et al. 2006).
The Wanshan Hg mining region in Guizhou Province was the largest Hg-producing region in China (Qiu et al.2005). Approximately 22,000 tons of metal Hg and 6000 tons of cinnabar were extracted from the Wanshan mining area, resulting in large quantities of mine waste(Liu 1998). Approximately 125.8 million tons of calcines and 20.2 billion m3of Hg-containing exhaust gas were released into the surrounding ecosystems of the Wanshan Hg mining region from 1949 to early 1990 (Liu 1998).Because of the environmental strain caused by the massive mining production, the Wanshan Hg mine was closed in 2004 under a national strategy to address environmental issues. Severe Hg contamination has occurred in several environmental compartments of Wanshan including rivers,sediments,soil,vegetation,and the atmosphere(Feng et al.2003; Feng and Qiu 2008; Qiu et al. 2005, 2009; Li et al.2008; Xu et al. 2019). Rice is the main food staple of the local population, and human health exposure to methylmercury (MeHg) through rice consumption has also been documented (Feng et al. 2008).
Cinnabar ore,often associated with other toxic elements such as antimony (Sb), arsenic (As), copper (Cu), manganese(Mn),zinc(Zn),and lead(Pb),can also be released into surrounding areas during the activities of ore processing and retorting. In addition to the mining industry,agricultural activities also contribute to the trace presence of these metals.The long-term use of land accompanied by the frequent application of agrichemicals can lead to the accumulation of various trace metals, such as Cu, Zn,nickel (Ni), and cadmium (Cd) in the region’s soil (Romic´and Romic´ 2003). To date, very few studies examining toxic elements other than Hg have been systematically conducted, particularly regarding the paddy soils in the Wanshan Hg mining region.
The key to any environmentally corrective strategy in any given area,pertaining to the management of soil and its quality, is reliable and comparative data that examines many different environmental factors. Society must take numerous aspects into consideration before proceeding toward actions that will effectively produce a sustainable environment. Developing a plan for soil that is free from heavy metal pollution is no different. The first step is to identify and quantify the source points of the heavy metals that are known to present a risk to human health and the environment and to identify the specific areas in which high levels of these metals indicate a proven risk to human health and the ecosystem (Zhang et al.2007).A systematic and thorough investigation of all heavy metals in the Wanshan mining region is urgently needed to accurately assess these risks.Studies that focus on only the risk caused by Hg do not provide a complete picture of the environmental impacts suffered by the region and therefore do not allow for the creation of a complete corrective strategy to address the existing damages.
The aim of this study was to measure the concentrations of Hg, Cd, As, Mn, Sb, Pb, Cu, Ni, Cr, and Zn in paddy soils near the abandoned mine areas of Wanshan to evaluate the current status of the pollution and to provide an assessment of the potential risks caused by the presence of these metals if found.
2 Materials and methods
2.1 Study area
The Wanshan district (27.518022°N, 109.213663°E) is located in the eastern part of Guizhou Province, Southwestern China. The study area covers 169.47 km2,including Wanshan town, Aozhai ethnic town, and Xiaxi ethnic town (Fig. 1).
The study area is a typical mountainous karst terrain with an elevation ranging from 205 to 1150 m a.s.l. It is characterized by a subtropical humid climate with abundant precipitation (1200–1400 mm year-1) and mild temperatures (~17 °C). The major rivers, the Xiaxi and Aozhai rivers, drain the Wanshan catchment (WSC) with their headwaters,and both rivers originate from Hg mining sites (Fig. 1). Large quantities of low-grade ores and calcines are stockpiled in their upstream banks and/or flood plains.Numerous artisanal Hg retorting units exist in large swaths north of the Aozhai River.The production of rice is the main activity of the local population of the Wanshan area.As this area was exposed to large-scale of Hg mining,the exposure of the ecosystem (soil, water, and atmosphere) to Hg pollution and human health risks have been reported at high levels (Søvika et al. 2011; Lin et al.2011a).
2.2 Sampling and measurement
The sampling campaign was conducted during the rice harvest season in September 2014. Two subsamples were collected from each site. All soil samples were collected and stored in sealed polyethylene bags to avoid crosscontamination and then transported to the laboratory,where all samples were air dried, ground in a ceramic disc mill, and sieved through 150 mesh. The sampling sites are shown in Fig. 1.
Approximately 0.1–0.3 g of solid soil samples were digested in the mixed acid solution of HNO3–HF, and the concentrations of Cd, Sb, Cr, Ni, Cu, Zn, Pb, Mn, As, and Ti in the digests were determined by inductively coupled plasma mass spectrometry (ICP-MS, Element, Finnegan MAT Co.). For Hg, appropriate amounts of 0.3–0.5 g dry samples were determined using a Lumex instrument, RA-915+(Lumex Ltd., Russia).
Method blanks, duplicates, and certified reference materials were used for quality assurance and quality control. The recovery of the certified reference material(GBW07405)for all elements ranged between 97.63%and 110.76%(Table 1).All chemical analyses were carried out at the Institute of Geochemistry, Chinese Academy of Sciences.

Fig. 1 Map location of the study area and sampling sites

Table 1 Concentrations of the different elements in the reference materials used in the present study and the results obtained (mg/kg)
2.3 Statistical analysis
Descriptive statistics calculations were conducted using Microsoft Excel, version 2010 (Microsoft, USA). SPSS statistical software version 17 (IBM, USA) was used for principal component analysis(PCA)and correlation matrix(CM). Arc Geographic Information System software version 10 (ESRI, USA) was used to create a metal concentration distribution map.
2.4 Assessment of metal contamination
2.4.1 Pollution load index (PLI)
The method of Tomlinson et al. (1980) was applied to calculate the pollution load index for each site:

where CF is contamination and;n is the number of metals.
PLI is a powerful tool that is widely applied to evaluate the heavy metal pollution in the environment.According to Chakravarty and Patgiri (2009), pollution is present in samples with PLI values higher than 1, and no pollution is present in samples with PLI values <1.
2.4.2 Geo-accumulation index (I-Geo)
The geo-accumulation index(I-Geo)was defined by Mu¨ller in 1969,which determines and defines metal contamination in sediments by comparing current concentrations with the background concentration. I-Geo can be calculated by the following equation:where Ciis the measured concentration of the examined metal i in the sediment; and Criis the geochemical background concentration or reference value of the metal i.
The geochemical background is defined as the effective absence of an element or component in the soil,but it does not necessarily mean that there is a low concentration of that element or component. The natural background is the natural concentration of an element in an area with low or minimal anthropogenic influence and is associated with the soil parent material (Dı´ez et al. 2009). The factor 1.5 is used to adjust the calculation for the influences of possible variations in the background values for a given metal in the environment and for very small anthropogenic influences.Seven classes can be determined from the I-Geo equation:
I-Geo ≤0, class 0, unpolluted;
0 <I-Geo ≤1, class 1, from unpolluted to moderately polluted;
1 <I-Geo ≤2, class 2, moderately polluted;
2 <I-Geo ≤3, class 3, from moderately to strongly polluted;
3 <I-Geo ≤4, class 4, strongly polluted;
4 <I-Geo ≤5, class 5, from strongly to extremely polluted; and
I-Geo >5, class 6, extremely polluted.
2.4.3 Enrichment factor (EF)
The enrichment factor (EF) is usually applied to quantify the extent of the anthropogenic contribution to the contamination. It is defined as the relative abundance of a chemical element in the environmental media compared with the background (Zhou and Guo 2015; Shotyk et al.2000). The EF is calculated according to the following equation:

where M is the concentration of the element under consideration; X is the concentration of the chosen reference element.
Al, Fe, Sc, and Ti are the most conservative and common elements that can be used as reference elements(Hernandez et al. 2003; Abraham and Parker 2008). For this study,Ti was used as the reference element.According to Sutherland (2000), five contamination categories are generally recognized on the basis of the enrichment factor:
EF <2, depletion to mineral enrichment;
2 ≤EF <5, moderate enrichment;
5 ≤EF <20, significant enrichment;
20 ≤EF <40, very high enrichment; and
EF >40, extremely high enrichment.
The PLI, I-Geo, and EF values were applied to classify and evaluate the pollution in the Wanshan mining region.Each index allows for specific evaluation and is characterized by its advantages and disadvantages (Table 2).I-Geo values are helpful to divide soil into quality classes and can be used to determine which heavy metal poses the highest threat for a soil environment. The single pollution index (PI) and EF are measures of the possible impact of anthropogenic activity on the concentration of heavy metals in the soil.
2.4.4 Risk index
The method of potential ecological risk assessment was created by Hakanson(1980)and has been widely applied to the pollution assessment of sediment and soil (Li et al.2015).It consists of the intergradations of the concentration and the ecological toxicity of different pollutants and gives a potential ecological risk index as shown in the following equation:

where RI is the potential ecological risk index; Ei is the potential ecological risk factor for a given pollutant (i); Ti is the ‘‘toxic-response’’ factor for a given pollutant as calculated by Hakanson (1980), i.e., Hg = 40, Cd = 30,As = Sb = 10, Pb = Cu = Ni = 5, Cr = 2, and Mn =Zn = 1; and Ci is the ratio of the concentration of a given element in the sample to its background level.
RI can be divided into four levels:
RI <150, low ecological risk;
150 <RI <300, moderate ecological risk;
300 <RI <600, considerable ecological risk; and
RI >600, very high ecological risk.
3 Results
3.1 Heavy metal concentrations
The background concentrations of the heavy metals in Guizhou soil, the range of concentrations of heavy metals in the rice paddy soils from the Wanshan mining area,and the national limit levels are shown in Table 3. Significant accumulation of Hg and Sb was observed in most of the soil samples collected in the Wanshan area, with concentrations ranging from 0.14 to 21 mg/kg and 0.01 to 78 mg/kg, respectively. The concentration of these two elements exceeded both the background level and the national limit levels. The concentrations of As, Pb, Zn, Cd, Cu, and Mn ranged between 0.41–92 mg/kg, 10–103 mg/kg,0.25–508 mg/kg, 0.01–3.6 mg/kg, 0.05–56 mg/kg, and 2.2–760 mg/kg, respectively. While these trace elements showed significant accumulation at some sampling points,the concentrations were found to be lower than the background levels in the majority of the samples collected. No significant accumulation of Ni or Cr was observed, with levels ranging between 0.12–52 mg/kg and 0.11–109.39 mg/kg, respectively.
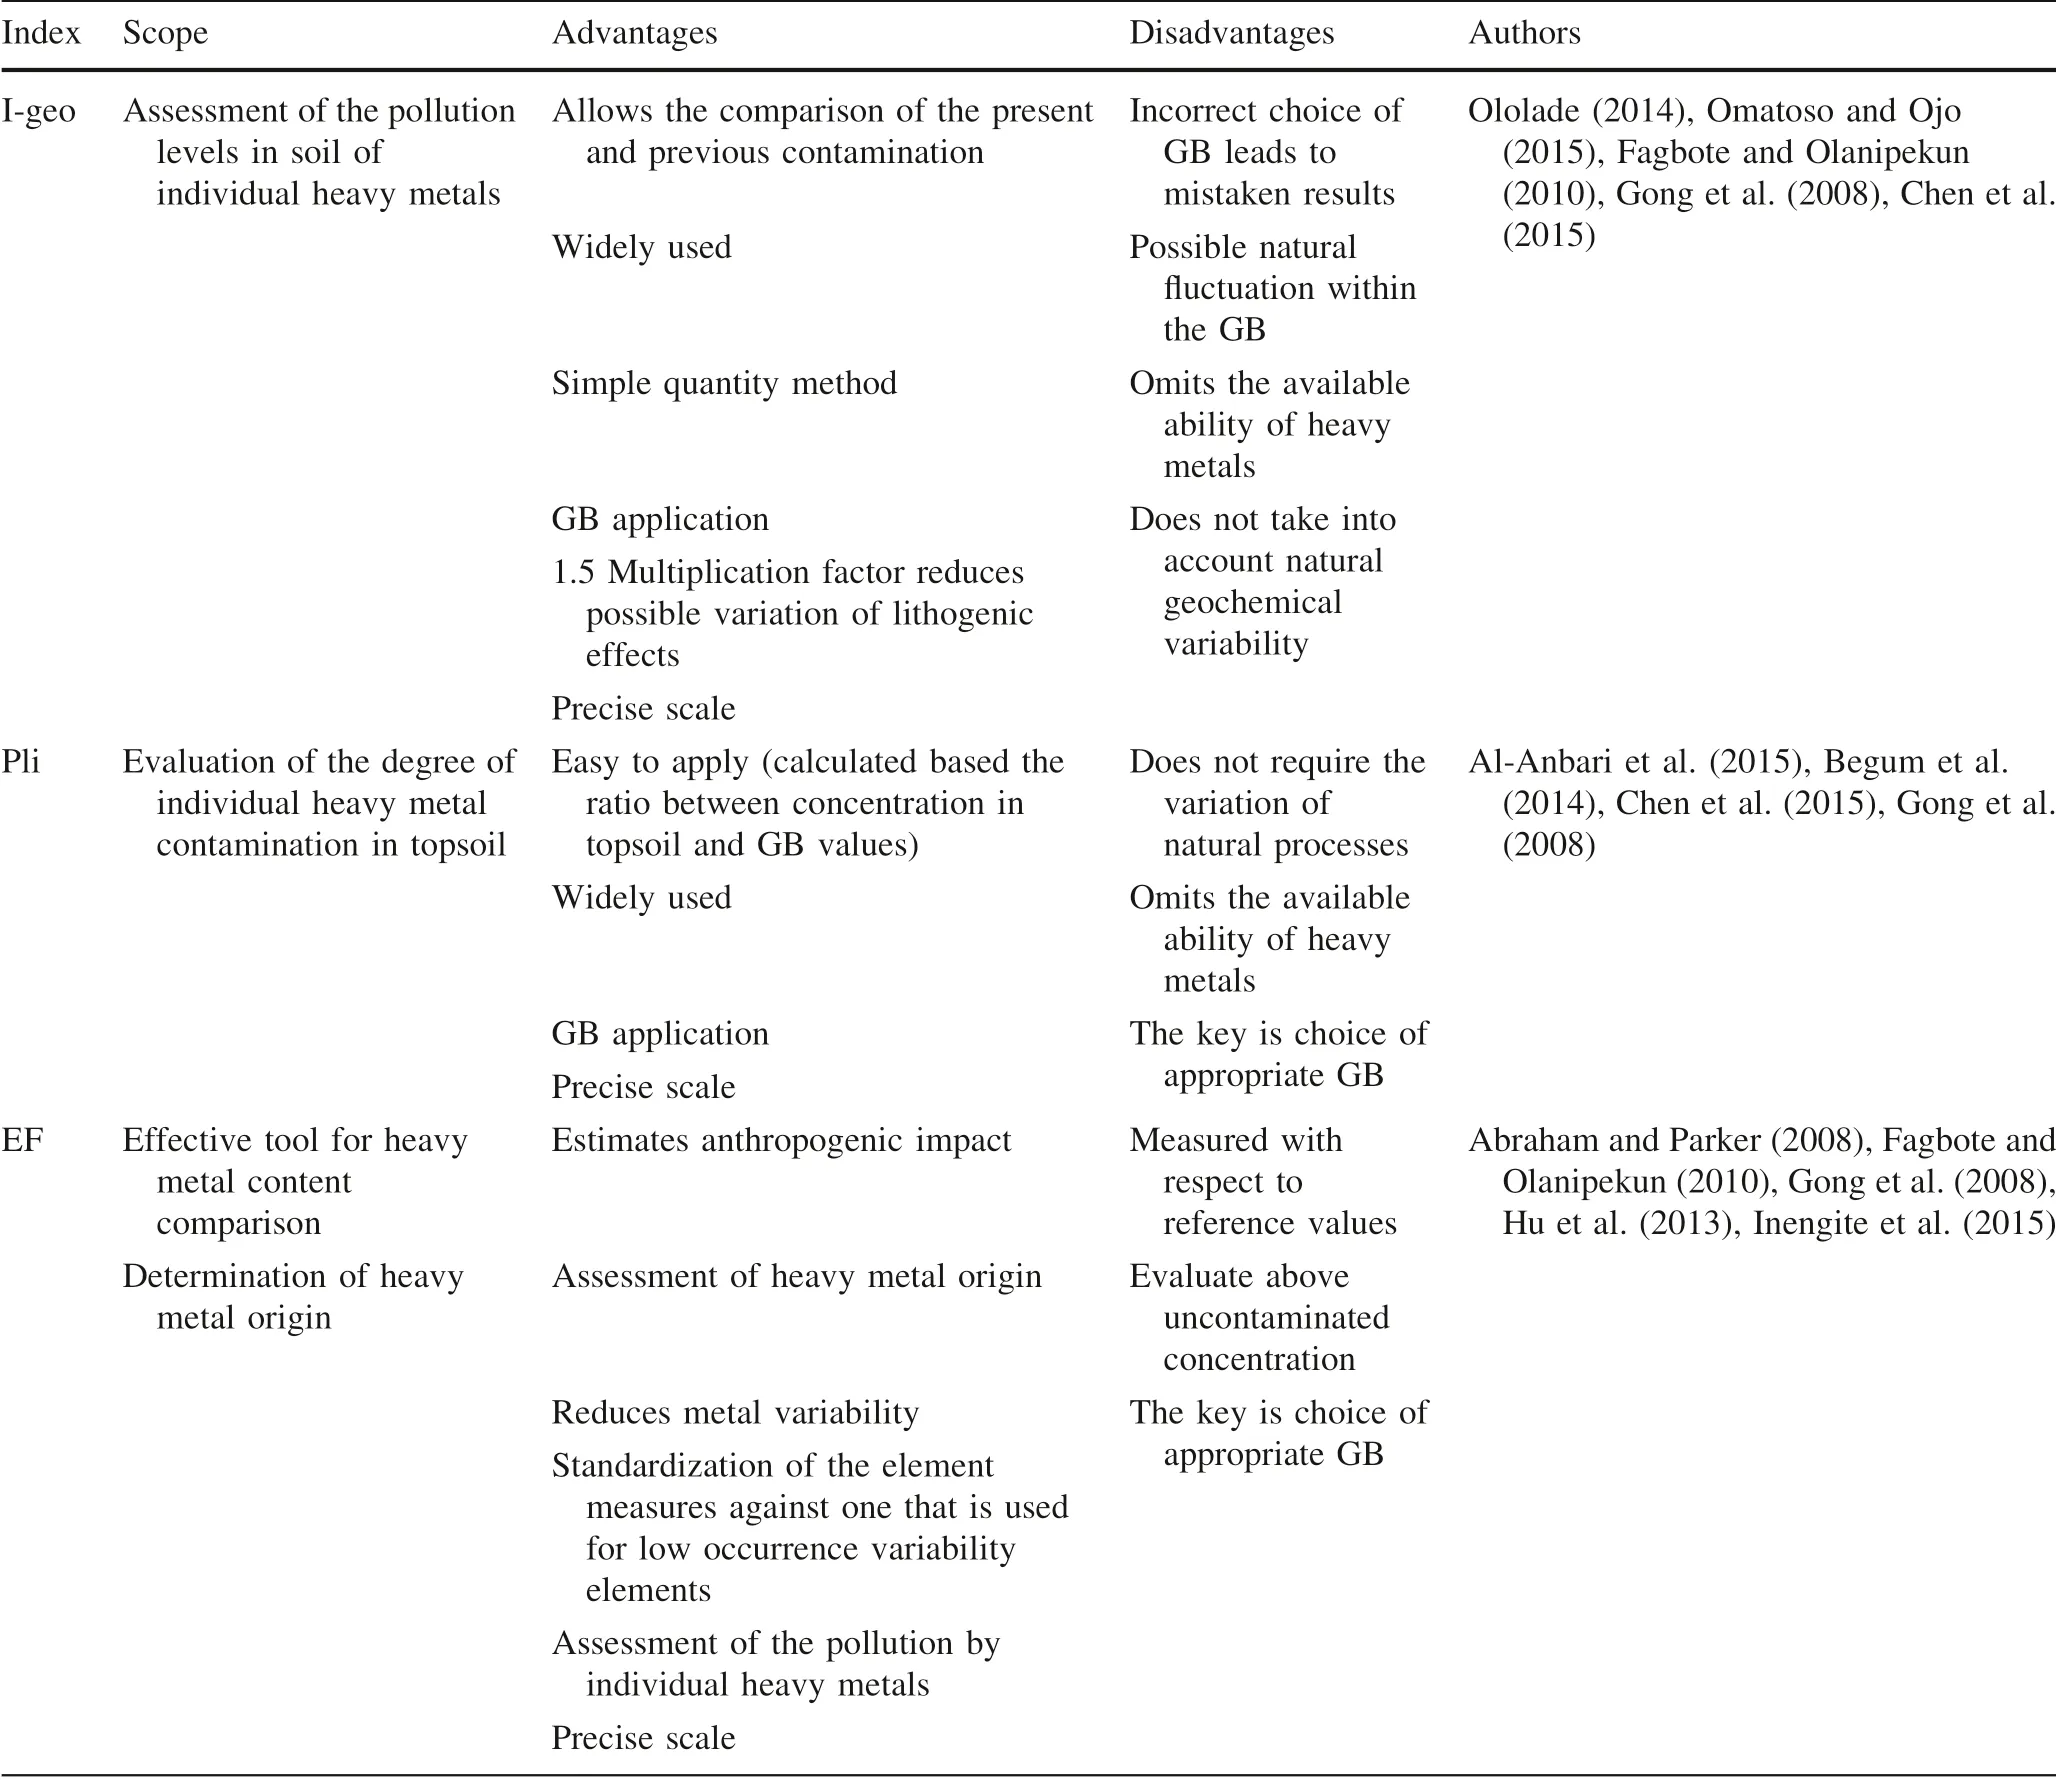
Table 2 Indices of heavy metal pollution given in the literature, their scope, and their strengths and weaknesses
3.2 Spatial distribution
The spatial distribution maps performed by ArcGIS 10.22 using the Kriging method showed higher levels of Hg close to the mining sites in the northeastern part of Wanshan, as well as high levels in the area near the village of Gouxi due to the existence of artisanal mining.The local population is still illegally smelting Hg in some small retorting sites.The concentrations of Hg and Sb are shown to decrease as the distance from the mining sites increase (Fig. 2). A stark decrease in the trend is directed toward the east part following the geomorphology of the area, based on the two major rivers that drain the Wanshan area,Xiaxi River,and Aozhai River(Zhang et al.2010;Lin et al.2011b;Dai et al.2012, 2013).
The concentration distributions of Sb and Cd appear to be similar to that of Hg,as the highest levels were observed near the mining site in the town of Wanshan and near the artisanal mine in the town of Xiaxi. The highest concentrations of Zn and Cr were found around the town of Wanshan, but contrary to Hg, the highest concentrationswere in the southwestern part of the study area, while the concentrations in eastern part were very low, which indicates the existence of another anthropogenic source of Zn and Cr in the area.The distribution of the concentration of Cu was similar to Zn and Cr,but with small separated spots near the mining sites. The distribution of Ni, Mn, Pb, and As did not show any significant trend, with the highest concentrations being observed in different parts of the study area (Fig. 3).

Table 3 Guizhou soil background, the range of concentrations of the different elements in this study and the national limit levels
3.3 Assessment of metal contamination
The pollution load index(PLI),geo-accumulation index(IGeo),and enrichment factor(EF)were calculated to assess the potential risk of heavy metals in the rice paddies soils in the Wanshan mining area. The results of the PLI presented in Table 4 show extreme pollution caused by Hg and Sb. Significant pollution by Pb and As was also observed, while there was no pollution from Cr, Cd, Zn,Cu, Ni, or Mn.
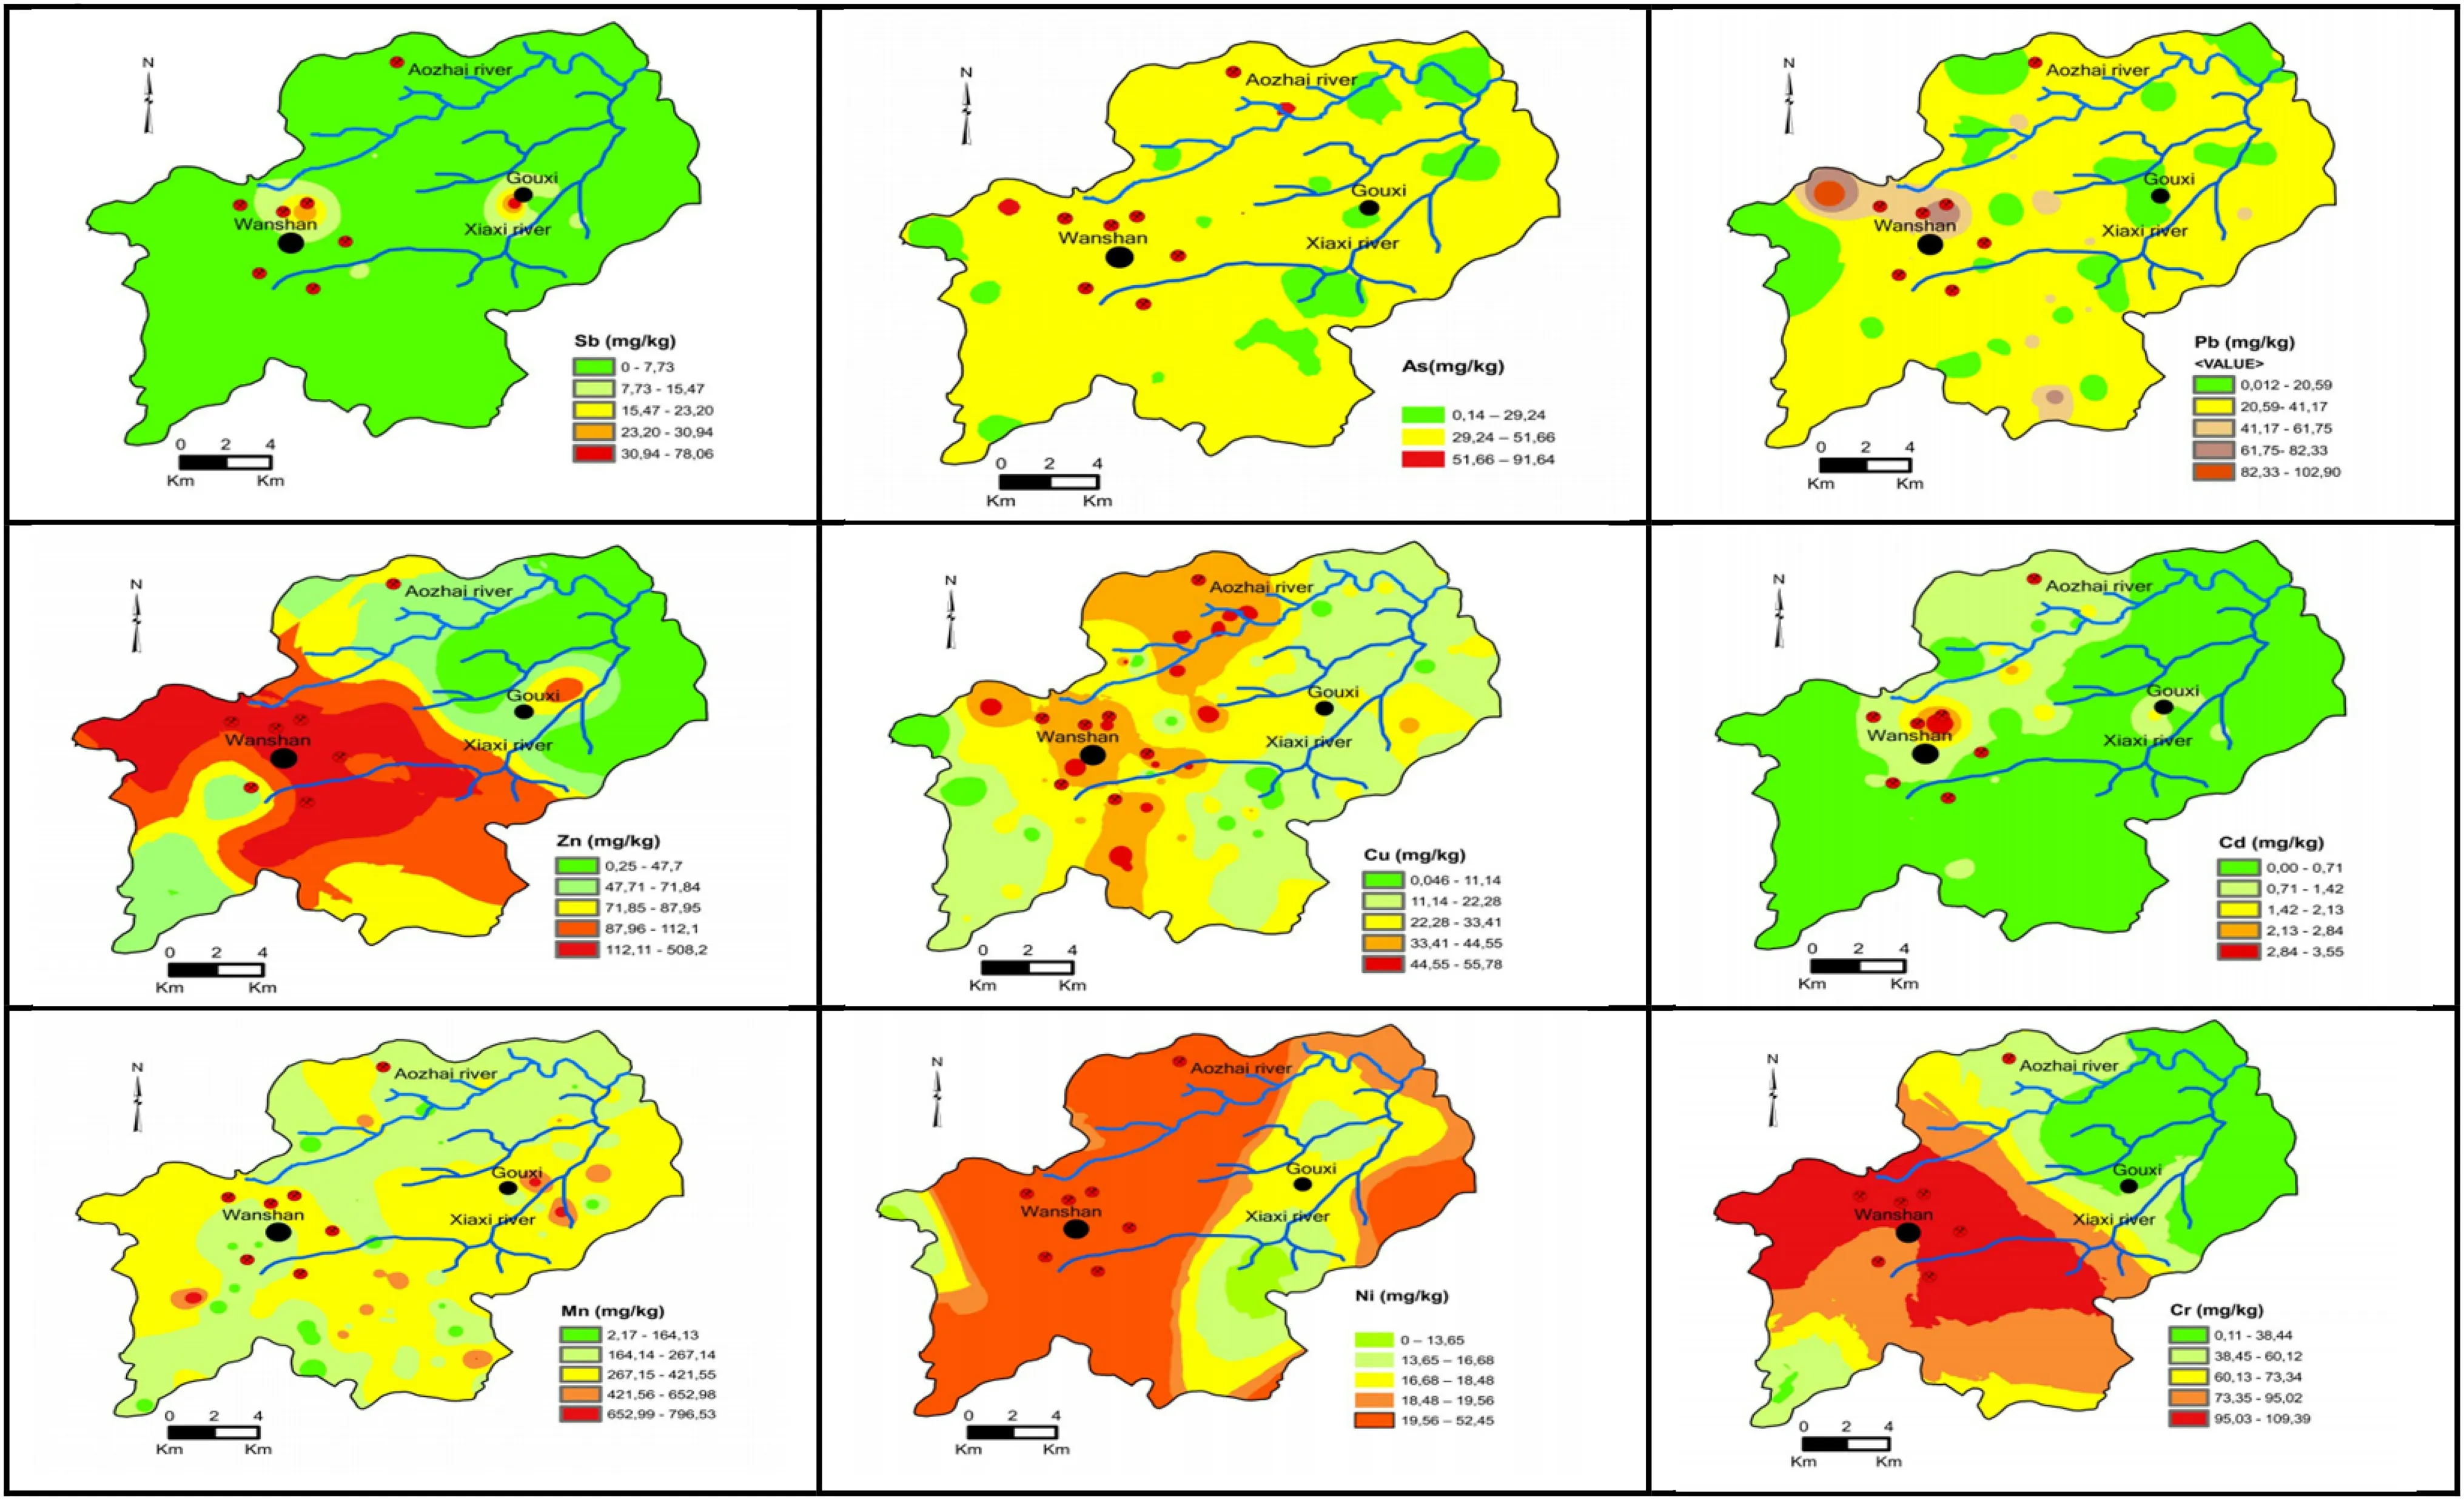
Fig. 3 Spatial distribution of heavy metals in the Wanshan mining area

Table 4 The pollution load index (PLI), geo-accumulation index (I-Geo) and enrichments factor (EF) results
The results of the I-Geo and the EF analyses showed very high to extremely high values for Hg and significant to very high enrichment values of Sb, resulting in extreme pollution according to the I-Geo results.The EF results for As, Pb, Zn, Cd, Cu, Mn, Ni, and Cr showed a depletion to mineral enrichment to moderate enrichment. The PLI results for these elements indicated that the soil from the rice paddies in the Wanshan area was moderately polluted by As, Pb, and Cd and unpolluted to moderately polluted by Zn, Cd, and Cu. No pollution from Ni or Mn was indicated from the samples.
The ecological impacts of the heavy metals and metalloids in the soil from the rice paddies in the Wanshan mining area are listed in Table 5. The RI reached a very high level,which indicates severe heavy metal pollution in the study area. The relative contribution from each element, calculated as the percentage of the Ei compared to the RI, showed that Hg was the dominant pollutant in the study area with a value of 93.78%; Sb was the second major pollutant at 2.41%; As and Cd had contributions of 1.33% and 1.32%, respectively; and the relative contributions from Cr, Pb, Zn, Cu, Ni, and Mn were very low at<0.5%.The very high level of the RI and the high relative contribution from Hg indicate that the historically largescale Hg mining industry and artisanal mining in the Wanshan area are the major source of pollutants in the soil(Qiu et al. 2006). Since Hg is not the only toxic element that is released from cinnabar retorting, other elements such as Sb, Cd, Pb, and As could be associated with the mining industry.
4 Discussion
Correlation matrix(CM)and principal component analysis(PCA) were performed to determine the correlations between each element and distinct groups of trace elements (Adedosu et al.2013)in the Wanshan paddy soil and to identify the different possible sources of pollution for each group.
The results of the CM (Table 6) showed that various element pairs had significant positive correlations, such asHg–Cd (r = 0.606), Cr–Ni (r = 0.825), Cr–Cu (r = 0.792),Ni–Cu (r = 0.874), Zn–Cd (r = 0.738), Zn–Sb (r = 0.66),and Zn–Pb (r = 0.668). All elements except Mn had a significant positive correlation with Hg, suggesting that mercury mining including artisanal retorting, is the main source of Hg,Cr,Ni,As,Zn,Cu,Cd,Sb,and Pb around the Wanshan mining area. We also observed a significant relationship between Mn and Zn, As Sb and Pb, which indicates that another anthropogenic source of these metals exists other than mining. Coal burning by the local population has been suggested to be the source from which these elements could be released.

Table 5 Ecological risk index (RI) and Ei and the relative contribution from each element
PCA was employed to compare the compositional patterns between the heavy metals in the soil from the Wanshan mining area and to identify the influence of the elements on each other. The results showed three components with 76.1%as the cumulative variance on the data of soil samples (Table 7). The three factors were obtained using a varimax normalized algorithm that gives an easier interpretation of the principal component loadings and maximizes of the variance explained by the extracted factors.
VF1 accounted for 49.1% of the total variance and had high factor loadings for Hg,Cr,Ni,Cd,Pb,Zn,As,Cu,and Sb, suggesting a common source of these elements that could be anthropogenic, such as cinnabar retorting, artisanal Hg mining,and coal combustion.Spatial distribution maps have shown high levels of these elements near the mining sites.VF2 accounted for 16.5%of the total variance with a significant loading factor for Cr, Mn, and Sb, suggesting a common anthropogenic origin.It is suggested that coal combustion and agriculture practices could be a source that releases these elements into the environmental area.VF3 accounted for the total variance with a significant loading factor for As and Mn, which could originate from common sources and the mining industry, and manganese factories have been suggested to be the main source of Mn.
Correlation matrix (CM) and principal component analysis(PCA)have shown different groups of metals with common sources. High concentrations of Hg, Sb, Cr, Ni,Cd,Pb,Zn,As,and Cu were observed near the mining sites and artisanal smelting sites, indicating that cinnabar retorting is the main source of these elements.However,it is possible that other anthropogenic sources have led to the release of trace elements in the soil, and the existence of coal combustion, the manganese industry and agricultural practices as other sources of heavy metals in the Wanshan area can lead to different distribution patterns of heavy metals in the area.

Table 6 Correlation coefficients among the heavy metals in the soil samples

Table 7 PCA analysis results, factor loading, variance and cumulative variance
5 Conclusions
The examination of heavy metals in this study revealed the following concentrations: very high concentrations of Hg;high concentrations of Sb; moderately high concentrations of As, Pb, Zn, Cd, Cu and Mn; and low concentrations of Ni and Cr. The highest concentrations were observed in areas in closest proximity to the mining sites. The ecological risk index in the Wanshan soil reached a very high level,with Hg as the dominant pollutant,which contributed 93.78% of the heavy metal total. The large-scale Hg mining industry and artisanal mining practices had a noticeably large and hazardous impact on the soil in the Wanshan area.These activities not only resulted in the enrichment of Hg but also contributed to hazardous levels of Sb, Cr, Cd,As, Zn and Pb. It is possible that other anthropogenic activities, such as coal combustion and agricultural practices involving the heavy use of agrochemicals, could be aggravating factors in the dangerous enrichment of heavy metals into the soils of these food-producing regions.Because of the well-known and scientifically established risks that the presence of these metals present to the ecosystem and human health, urgent action is needed to address the already existing problem before it poses an even greater risk to the wellbeing of this agricultural region and its citizens/inhabitants.
AcknowledgementsFinancial support was provided by the National Natural Science Foundation of China (No. 41573135) and the Opening Fund of the State Key Laboratory of Environmental Geochemistry (SKLEG No.2019716).
Compliance with ethical standards
Conflict of interestOn behalf of all authors, the corresponding author states that there is no conflict of interest.
杂志排行

Acta Geochimica的其它文章
- Chemical structure of the Earth’s mantle defined by fast diffusion elements like helium
- A helium stratified and ingassed lower mantle: resolving the helium paradoxes
- Mechanism of accelerated dissolution of mineral crystals by cavitation erosion
- Zircon chemistry and new laser ablation U-Pb ages for uraniferous granitoids in SW Cameroon
- Zircon U-Pb age and geochemical constraints on the origin and tectonic implication of the Tuotuohe Cenozoic alkaline magmatism in Qinghai-Tibet Plateau
- Low-temperature alteration of uranium-thorium bearing minerals and its significance in neoformation of radioactive minerals in stream sediments of Wadi El-Reddah, North Eastern Desert, Egypt