Zircon chemistry and new laser ablation U-Pb ages for uraniferous granitoids in SW Cameroon
2020-04-26········
· · · · · · · ·
Abstract The Ekomedion two-mica granite, southwestern Cameroon, has potential for uranium and molybdenum mineralization. Here, we present LA-ICP-MS U—Pb ages,Lu—Hf isotope characteristics,trace element concentrations and Ti-geothermometry of zircon from this granite hosting U—Mo mineralization in pegmatitic pods. The majority of zircon are CL-dark though some CL-bright cores were also identified. U—Pb zircon age data range from 121 ± 3 to 743 ± 11 Ma with only 5 of 34 ages being near concordant. The concordant mean age of 603 ± 12 Ma is similar to ages of granitic intrusions along the Central African Shear Zone in Cameroon. Apparent ages with mean of 261 ± 6 Ma reveal open system behavior with respect to Pb and/or U. Zircon εHfi values range from - 20.3 to- 0.3. This implies that U—Mo was remobilized during partial melting of the surrounding gneiss. Zircon Th/U >0.1 as well as an increasing Hf with decreasing Th/U indicates that fractional crystallization was the main factor that controlled U—Mo mineralization in pegmatitic pods.Y and Y/Ho ratios cluster from 29 to 33 close to the chondritic ratio of 28 and indicate fractionation of Y and Ho with low F contents during the earliest stages of crystallization. Late stage accumulation of F-rich magmatic-hydrothermal fluids impacted U—Mo mineralization as a ligand. Zircon contains a prominent negative Eu anomaly pointing to a fractionating system rich in plagioclase.Calculated Ti-in-zircon temperatures span 672 °C to 1232 °C with the temperatures at the high end reflecting interference from mineral inclusions in the zircon grains while the lower temperature values are linked to crystallization.
Keywords Zircons · Uranium-molybdenum · Cameroon
1 Introduction
Magma ascending from within the Earth may result in either formation of intrusive rocks at depth or eventually rise and erupt at the surface as extrusive rocks. In the former case,intrusion-related hydrothermal deposits result from melt emplacement, crystallization, and exsolution of late-stage magmatic—hydrothermal volatile-rich fluids and interaction with the surrounding host rocks(Pirajno 2009).Deciphering what happened during the formation of such deposits requires the study of zircon U—Pb ages, their hafnium isotopic composition,and chemical composition as well as the temperature at which the magma crystallizes (e.g. Belousova et al. 2006, 2010; Hawkesworth et al. 2010; Dhuime et al. 2012; Kemp and Hawkesworth 2013; Mosoh Bambi et al. 2013; Vervoort and Kemp 2016). The determination of true crystallization age from zircon U—Pb isotopic composition requires the condition that the U—Pb system must have remained closed. Zircon that has behaved as an open system due to U—Pb isotopic disturbance (which includes loss or redistribution of radiogenic Pb)will yield dates that are potentially meaningless (Shang et al. 2010; Vervoort and Kemp 2016). Laser ablation inductively coupled plasma mass spectrometry (LA-ICP-MS) allows the determination of ages and temperatures from micron-scale domains that record magmatic events preserved in the outermost rims of zircon crystals(e.g.Mojzsis and Harrison 2002;Carson et al.2002;Breeding et al.2004;Gordon et al.2009; Cottle and Stearns 2017). The notion of using U—Pb zircon ages to place the Hf isotopic composition into a firm temporal framework is essential for an accurate assessment of crust-mantle evolution(Belousova et al.2006;Vervoort and Kemp 2016). Additionally, the ability of zircon to crystallize throughout the sustained column of magma ascent, from magmatic to hydrothermal, makes it a potentially useful tool in determining the stage at which elements were segregated out or were added into the solution. This can be determined from zircon compositional zoning (e.g.Pettke et al. 2005; Belousova et al. 2006; Kebede et al.2007). The aspect of elemental segregation or addition is evident in the elevated concentrations of incompatible elements (REE, HFSE, U, and Th) in zircons as shown by Belousova et al. (2002), Hoskin and Schaltegger (2003),Pettke et al.(2005),Shu et al.(2011),Li et al.(2014),Wang et al. (2014), and Kozlik et al. (2016) in W, (incompatible element)-mineralized granitic rocks. Data of this nature have not been reported in our study area. This study will,therefore,provide the first recording of such information in the area and Cameroon at large.
Granites play major host to several types of mineralization including granite-related U—Mo (Nex et al. 2001;Farges et al. 2006; Markey et al. 2007; Mao et al. 2008;Polito et al.2009;Krˇı´bek et al.2009;Dolnı´cˇek et al.2009;Alexandre 2010; Mosoh Bambi et al. 2012, 2013). Mosoh Bambi et al. (2012) reported the U—Mo mineralization potential of granites in the Ekomedion area,located within the Ngondo complex of south-western Cameroon (Figs. 1 and 3a). Identifying mineralization of economic importance in the area through mapping and sampling has been difficult. In order to provide more insight into the formation age, melt source and its interaction with the country rock during ascent, a detailed study of age, as well as the internal processes that prevailed during the magma ascent is required. In this paper, we present a combination of U—Pb ages and Lu—Hf isotope characteristics of zircon from the two-mica granite that hosts U—Mo mineralization in the Ekomedion area of Cameroon (Fig. 3b). Analyses of trace element concentrations in zircon as well as calculated crystallization temperature (Ti in zircon geothermometry)of the magma are also presented with the aim of providing new insights into the genesis of the U—Mo mineralization in the Ekomedion Prospect. To enhance the understanding of the pluton,we provide new petrographic and whole-rock geochemical data for the dated sample together with other samples from the same plutonic complex (although these aspects do not constitute the focus of this contribution).
2 Geological framework
2.1 Regional geology
The Cameroon Orogenic Belt forms part of the Central Africa Fold Belt (CAFB). The CAFB is bordered by the West African Craton (WAC), the enigmatic east Saharan Craton and to the south by the Sa~o Francisco-Congo Craton(SFCC) (Fig. 1). The Cameroon Orogenic Belt (Fig. 2) is composed of: (1) Paleoproterozoic basement gneisses,migmatites and granulites with Sm—Nd whole rock and mineral model ages of 1.4 to 2.5 Ga (e.g. Van Schmus et al. 2008, Chombong et al. 2017); (2) Meso- to Neoproterozoic deformed and metamorphosed volcano-sedimentary sequences. According to Toteu et al. (2006), the metavolcanic-sedimentary sequences in the Lom basin are Neoproterozoic (with a detrital zircon age of 2800 Ma).They also presented Sm—Nd model ages of 1.4—2.2 Ga.Similar meta volcano-sedimentary sequences in the Poli series have been dated at 700 Ma (Toteu et al. 2006).Granitoids which intruded the former two units are Pan-African in age (e.g. Penaye et al. 2006; Li et al. 2014;Asaah et al.2015;Ateh et al.2017).Within the Mayo Kebi area, zircon’s U—Pb crystallization ages are 640—655 Ma.In the Bafoussam area,monazite ages of two-mica granites were determined at 558—564 Ma using the EMP Th—U—Pb method (Djouka-Fonkwe et al. 2008). In the Ekomedionarea (southwestern Cameroon) Mosoh Bambi et al. (2013)reported indistinguishable ages of 578 ± 4 and 578 ± 11 Ma from monazite and xenotime in two-mica granite and porphyritic granite, respectively.
In Cameroon, the Central African Fold Belt is thrust onto the Ntem complex that forms the northern edge of the Congo Craton (Affaton et al. 1991; Fig. 2). The Ntem complex consists of (a) a greenstone belt (ortho amphibolites and metasedimentary rocks dated at 3.1 Ga;(b)a TTG suite with an emplacement age of 2.9 Ga; and (c) K-rich granitoids with an age range of 2.7—2.5 Ga(Tchameni et al.2000; Shang et al. 2004; Chombong et al. 2013). Structurally, the Cameroon orogenic belt has experienced two major ductile deformation phases, D1 and D2, associated with important plutonic activity (Nzenti et al. 1992; Toteu et al. 2001). Post sinistral or dextral shearing and latetectonic faulting formed the Tchollire´—Banyo fault, the Central Cameroon shear zone (CCSZ), the southwestern Cameroon shear zone and the Sanaga fault,all of which are associated with ductile deformation(Dumont 1986;Ngako et al. 2003; Toteu et al. 2004).
Ekomedion is located in the Ngondo Complex, within the southwestern part of the Neoproterozoic Fold Belt(Mosoh Bambi et al. 2012). This complex lies close to the CCSZ, which is an N30E—N70E lineament. The CCSZ is part of the Central African Shear Zone (CASZ) that is presumably a continuation of the Pernambuco Shear Zone in the Borborema Province of northeastern Brazil (Fig. 1;Njome and Suh 2005; Nzenti et al. 2006, 2011; Njanko et al. 2006; Neves et al. 2006; Ngako et al. 2008; Bouyo et al.2009).These two regions have been correlated on the basis of their zircon ages obtained from identical rock types within these units (Fig. 1; Van Schmus et al. 2008).
2.2 Local geology of Ekomedion
The Ekomedion area is composed of paragneisses intruded by granitic plutons(biotite-rich granite,porphyritic granite,alkali feldspar granite and two-mica granite (Fig. 3b;Mosoh Bambi et al.2012,2013).These granitic plutons are partially overlain by Cretaceous limestones and sandstones of the Douala sedimentary basin as well as mafic volcanic rocks of the Cameroon volcanic line in southwestern Cameroon (Fig. 3).

Fig. 2 Geologic map of Cameroon showing the position of Ekomedion. BF Tchollire´—Banyo Fault, SF Sanaga Fault,KCF Kribi-Campo Fault.Modified after Kwekam et al.(2010), Mosoh Bambi et al.(2013)
In terms of petrography,the two-mica granite that hosts the mineralization is composed of quartz(30%)plagioclase(22%)K-feldspar(27%),biotite and white mica[the rock is richer in biotite (~10%) than it is in the white mica(~6%)]. Accessory minerals include zircon, ilmenite,monazite, and apatite while secondary alteration phases include epidote, chlorite, quartz, sericite, rutile and hematite or goethite. However, the sampled outcrop reveals variations in the modal proportion of the above primary constituents based on the degree of alteration. Primary quartz content experiences a decrease of ~15%in the ore zone and a 10% gain at the western margin of the granite due to secondary remobilization and recrystallization of new quartz grains. On the other hand, primary plagioclase exhibits an inverse relationship with quartz. Primary plagioclase is up to 60%in the ore zone and decreases down to 18% at the western margin of the granite. Sericitization doubles the white mica content in the ore zone while biotite content decreases to ~3%. Texturally, the granite shows a grain-size variation with fine-grained granite at the western margin whereas in the ore zone and at the eastern margin the granite is medium-grained.
The two-mica granite is characterized by fracture sets with variable orientations (Fig. 6a). Some of these fractures are discordant to the foliation in the gneissic country rock (Mosoh Bambi et al. 2012, 2013). Discordant pegmatite and quartz veins are common. In thin sections, the deformed nature of the granite is confirmed by the presence of microstructural features which include micro-fractures and micro-shears. These microstructural features are localized within the ore zone and are of three sets; (1) an early transgranular micro-fault, partly filled with quartz,white mica and/or iron oxide; (2) transgranular fractures that are partially filled with hematite or goethite and white mica; and (3) intragranular fractures that are healed with quartz or white mica. Details on structural deformation in the Ekomedion area are available in Mosoh Bambi et al.(2013).
U—Mo mineralization is observed to occur in the pegmatite pods, while dissemination occurs in the two-mica granite.Early formed fractures are filled with the principal U—Mo ore,which is concentrated in pegmatitic pods hosted by two-mica granite. Various alteration effects ranging from brecciation, silicification, ferruginization, sericitization, chloritization, and albitization are visible around the mineralization sites (Mosoh Bambi et al. 2012).

Fig. 3 a A digital elevation model (DEM) for Nkongsamba area with mounts Manengouba and Bambouto shown. b Geologic map of Ekomedion. Modified after Mosoh Bambi et al. (2012, 2013)
New geochemical data on the fresh Ekomedion twomica granite obtained from UFRJ (Brazil) are briefly presented here (Table 1) to complement existing data on the Ekomedion granite (Mosoh Bambi et al. 2012). Geochemically,the Ekomedion two-mica granite samples have similar SiO2and Al2O3concentrations among all analyzed samples. These concentrations range from 70.68—72.17 wt% and 14.12—14.85 wt% for SiO2and Al2O3, respectively (Table 1). On the other hand, concentrations of K2O,Na2O,Fe2O3t,and CaO for all samples are observed to be slightly higher than those of MnO, MgO,and P2O5, which are relatively low and below 1 wt%(Table 1).Trace element concentrations vary considerably.Compatible elements (V, Co, Zn, and W) are considerably low, not exceeding 37 ppm (Table 1). Th concentrations are between 24.9 and 38.5 ppm in the two-mica granite while U values are lower and range from 8.9 to 13.5 ppm.Th/U ratios for the two-mica granite range from 2.79 to 3.04, suggesting U mobility in the area relative to Th.Incompatible elements such as Ba, Rb and Sr have high concentrations ranging from 188 ppm (in Sr) to 1054 ppm(in Ba)(Table 1).The two-mica granite is characterized by high LREE concentrations over HREE, with La/Lu ratios from 125.64 to 194.64 and Ce/Yb ratios from 45.2 to 53.04(Table 1). There is a remarkably large negative Eu anomaly observed for all samples analyzed, as well as a slight positive Ce anomaly for three of the samples (Fig. 4).
These rocks classify as granite on the TAS classification diagram(Cox et al.1979).They are peraluminous in nature on the A/CNK against A/NK plot(Shand 1943)and have a high K2O and SiO2content which places them within the high-K calc-alkaline series field (Peccerillo and Taylor 1976).See Fig. 5a—d for details on how the composition of the samples in this study compare with those of Mosoh Bambi et al. (2012). In terms of geotectonic setting, the studied two-mica samples fall within the fields from Syn-COLG to WPG (Pearce et al. 1984; Fig. 5e, f).
3 Samples and analytical methods
3.1 Sample collection and preparation
The samples used in this study were collected around the principal U—Mo anomaly in the Ekomedion area previously identified by Mosoh Bambi et al.(2012).The samples werecollected systematically along an E-W traverse starting from the surrounding barren host granite through the main ore zone and back into the host granite (Fig. 6a). A representative two-mica granite sample (CMR09, Fig. 6c)collected from the major ore exposure zone (magnified zone, Fig. 6b) was crushed, and zircon was separated by standard techniques (Rogers’s water table, Frantz magmatic separation, and methylene iodide heavy-liquid separation) and then analyzed at the University of California Santa Barbara (UCSB). Individual zircon crystals were handpicked and mounted in epoxy and ground down halfway to expose grain interiors. The zircon grains were then polished with 6 μm and 1 μm diamond paste before analysis.
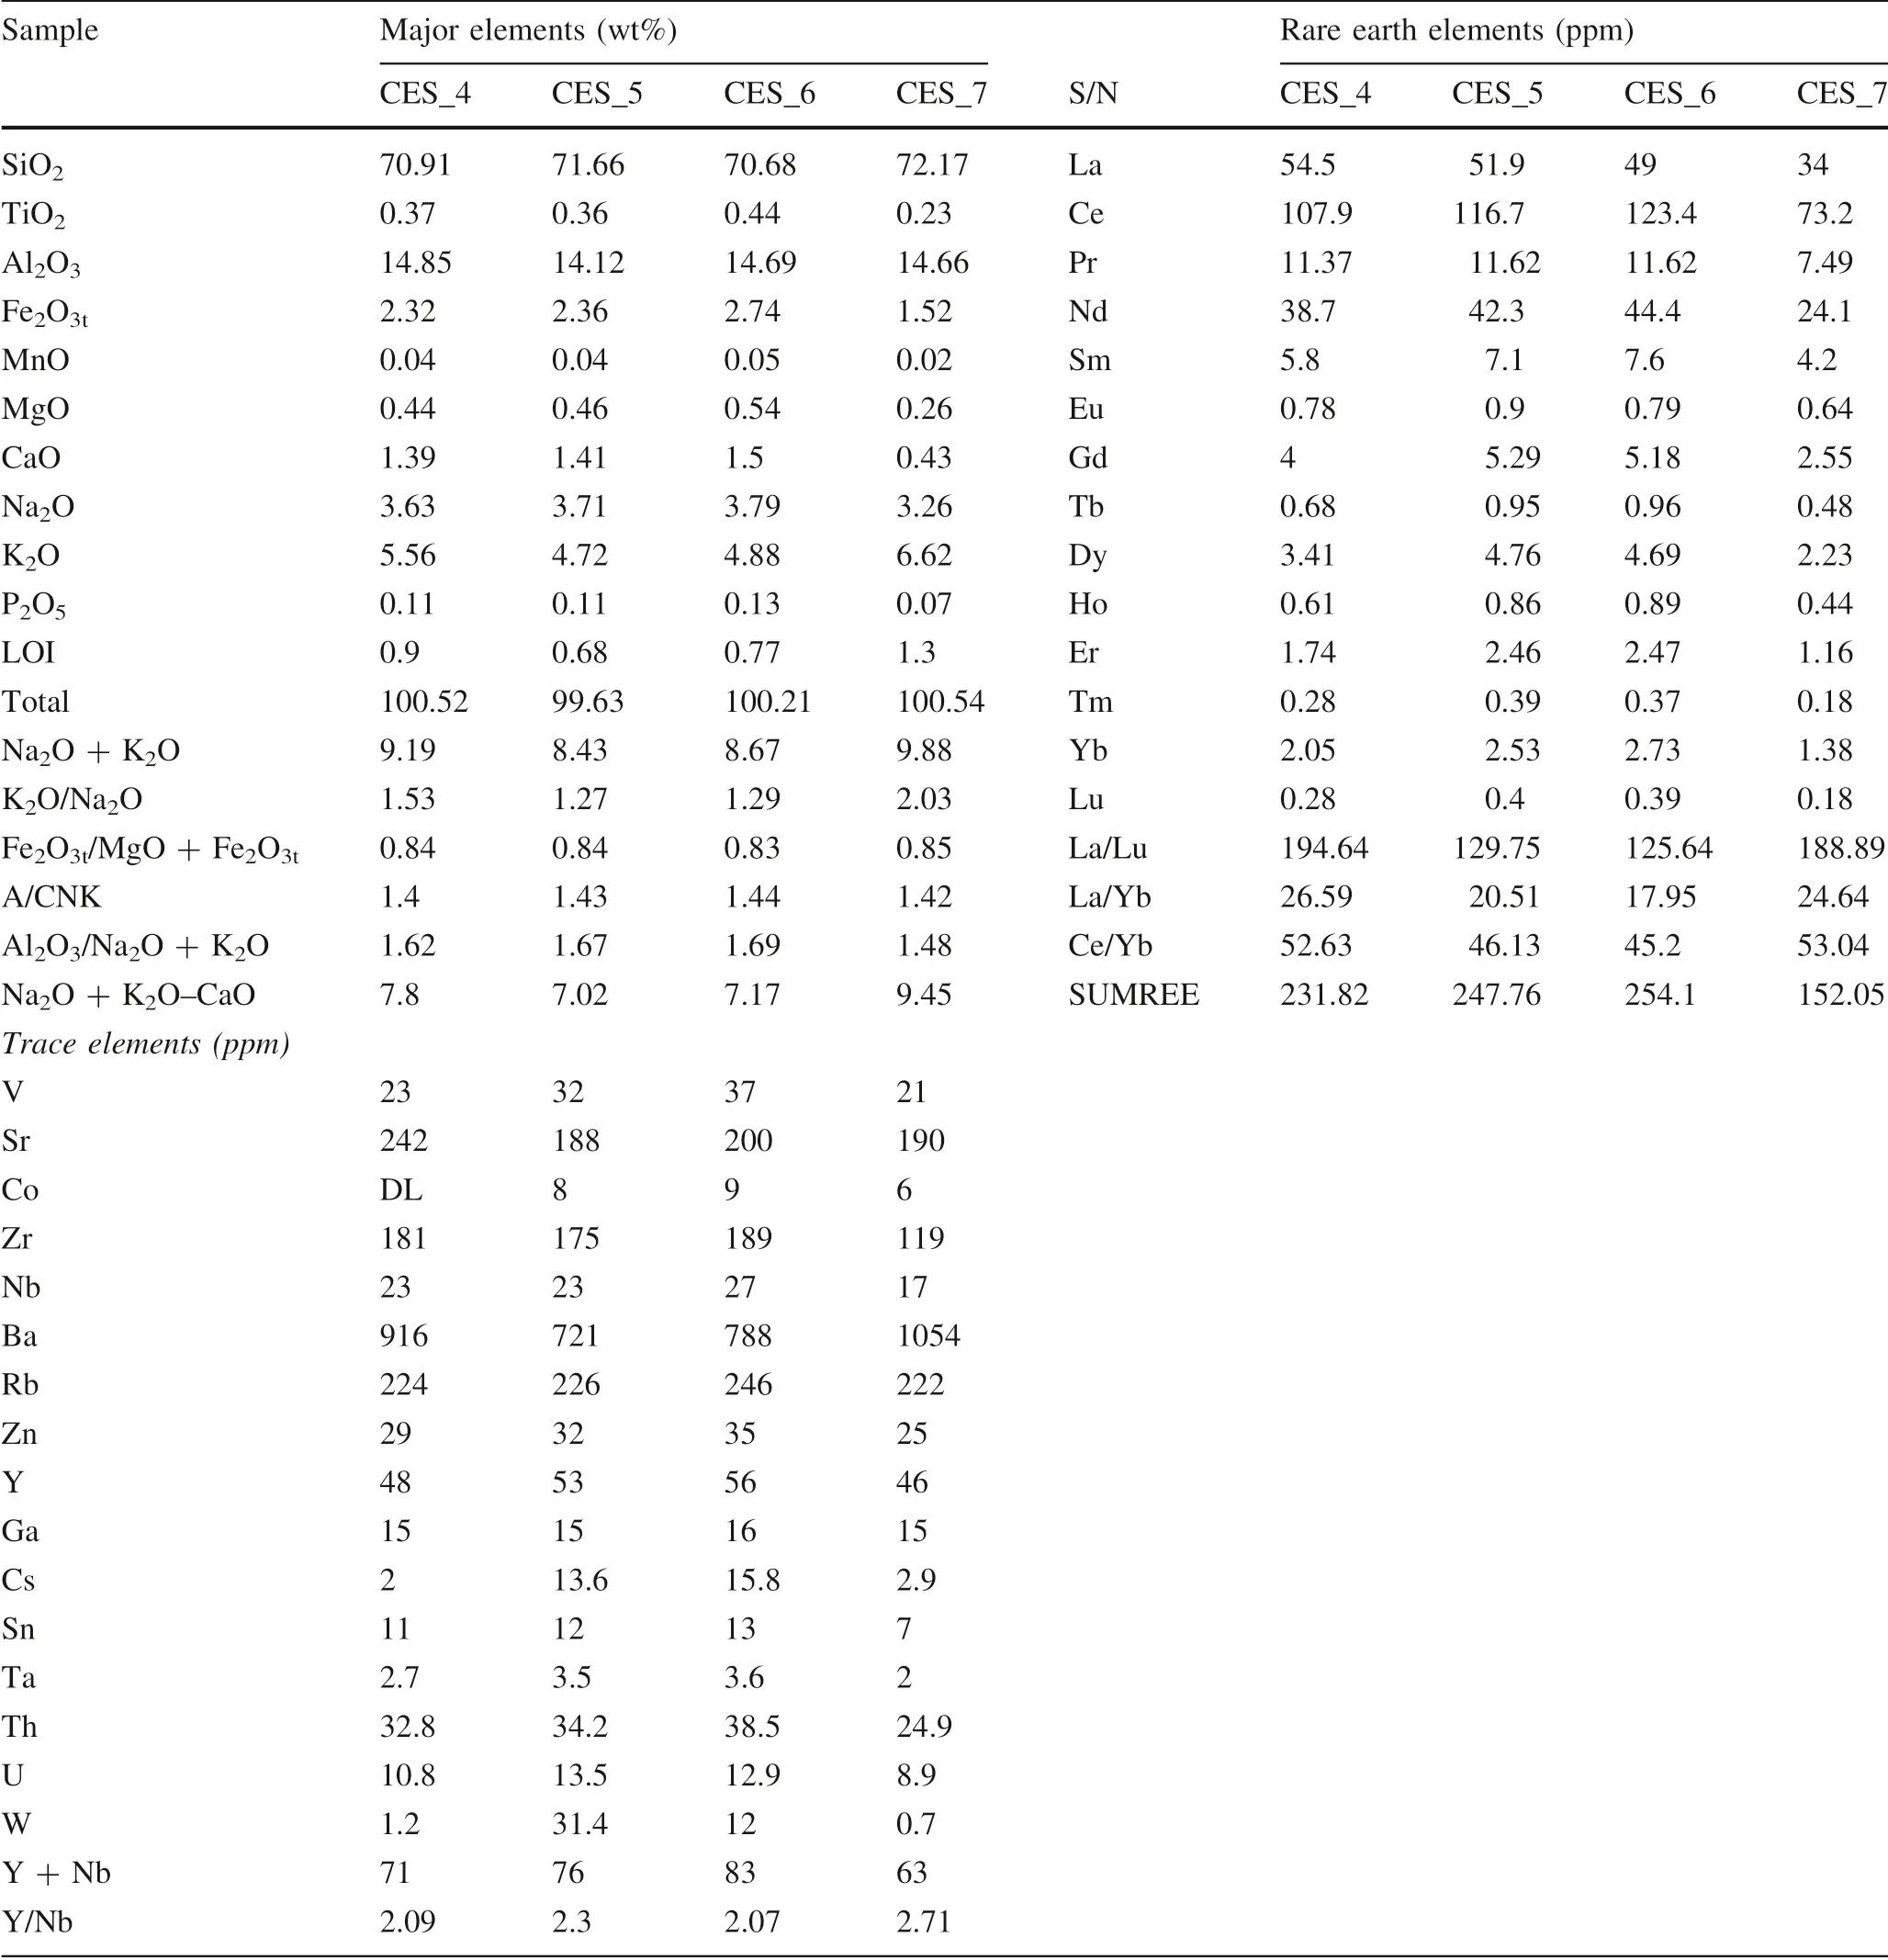
Table 1 Whole rock geochemistry for the Ekomedion two-mica granite

Fig. 4 REE patterns for two-mica granite samples, ekomedion prospect. Values are chondrite-normalized (normalization is according to Boynton (1984))
Internal structures of zircon grains and the isolation of potential analytical sites suitable for determining the magmatic crystallization age of crystals were obtained via cathodoluminescence (CL) imaging using an FEI Quanta 400f Scanning Electron Microscope housed at UCSB.
3.2 U-Pb isotope analyses
Zircon grains were analyzed for U—Th/Pb isotopic data using a split-stream LA-ICP-MS facility located at UCSB.Analytical steps followed those outlined in Kylander-Clark et al. (2013) with modifications as presented in McKinney et al.(2015),which are briefly summarized here.Inclusionfree and cleanest crack-zircon grains were ablated with a Photon Machines 4-ns pulse duration 193-nm wavelength ArFexcimer laser ablation system with a 25 μm spot diameter, 4 Hz frequency, laser energy of 100% of 3 mJ(equating to a fluence of ~1.7 J/cm2) and 100 shots per analysis.
The isotopic ratios were measured using a Nu Plasma HR multi-collector (MC) ICP-MS attached to the laserablation system. In order to correct for instrumental drift,mass bias, and down-hole inter-element fractionation, zircon standard 91500 (1065 Ma206Pb/238U isotope dilutionthermal ionization mass spectrometry age, Wiedenbeck et al. 1995) was used as the primary reference zircon.Secondary reference zircon GJ-1 (601.7 ± 1.3 Ma, Horstwood et al.2016)was analyzed alongside(once every eight unknowns) to monitor data accuracy. Mass bias and fractionation were corrected based on measured isotopic ratios of the primary reference material.
Data reduction for the U—Pb isotope analyses was achieved using Igor Pro with the plugin Iolite v. 2.5 Data(details on data-reduction are explained in Paton et al.2010). All uncertainties, including contributions from the reproducibility of the reference materials for207Pb/206Pb,206Pb/238U, and207Pb/235U, during the analytical sessions(70 GJ-1 unknowns)are quoted at the 2σ confidence level.A concordia diagram in which upper and lower intercepts could be interpreted was plotted using ISOPLOT 3.75(Ludwig 2012). The accuracy of the analytical data was assessed by repeat measurement of the reference zircon GJ-1 (concordia age = 599 ± 1 Ma, MSWD of concordance = 0.8, a probability of concordance = 0.9, n = 70)for206Pb/238U and207Pb/206Pb ratios, respectively.
3.3 Lu-Hf isotope analyses
To avoid a mismatch and to better correlate the Hf isotopic composition of the zircon with their respective ages (U—Pb), the same zircon grain domains that were used in the U—Pb analyses were also analyzed for Lu—Hf isotopes(Vervoort and Kemp 2016) at UCSB. Methods followed those outlined in Kylander-Clark et al. (2013) using LAMC-ICP-MS. Zircon grains were ablated with a Photon Machines 4-ns pulse duration 193-nm wavelength ArFexcimer laser ablation system with a 50 μm spot diameter,10 Hz frequency, laser energy of 100% of 3 mJ (equating to a fluence of ~1.7 J/cm2) and 400 shots per analysis.The Lu—Hf laser spot was drilled on top of the U—Pb laser spot.
A176Lu isotope decay constant of λ = 1.867 × 10⁻¹¹year-1was used for the calculation of εHftvalues(So¨derlund et al. 2004), using the isotope composition of the chondritic uniform reservoir (CHUR) of (176Lu/177-Hf)CHUR= 0.0332, (176Hf/177Hf)CHUR,0= 0.282772 (Blichert-Toft and Albarede 1997). The initial176Hf/177Hf ratios and εHftfor all analyzed zircon domains were calculated for the corresponding206Pb/238U age. A two-stage depleted mantle Hf model age (TDM) was calculated from the initial176Hf/177Hf of each zircon at the time of crystallization (in terms of the apparent206Pb/238U age) by using (176Lu/177Hf)DM= 0.0384 and (176Hf/177Hf)DM-= 0.28325 (Griffin et al. 2000). The calculations were made as follow: TDM’2fcc = -0.72 (176Lu/177-Hf) = 0.0093—felsic continental crust value(Amelin et al.1999), while for TDM2fcc = -0.55 (176Lu/177-Hf) = 0.015—average continental crust value (Blichert-Toft and Albarede 1997).
Replicate measurements of the reference zircons (GJ-1;MT; MUN3; Plesˇovice and 91,500) yielded176Hf/177Hf ratios of 0.281993 ± 0.00003 (95% conf, MSWD = 0.86,probability = 0.53 and n = 7); 0.282506 ± 0.00002 (95%conf, MSWD = 0.37, probability = 0.99, n = 25);0.282128 ± 0.00003 (95% conf, MSWD = 0.48, probability = 0.83, n = 7); 0.282473 ± 0.00007 (95% conf,MSWD = 2.3, probability = 0.05, n = 6) and 0.282323 ± 0.00007 (95% conf, MSWD = 1.4, probability = 0.24, n = 5), respectively.

Fig. 5 Whole rock.a Na2O + K2O versus SiO2.b A/CNK (= Al2O3/(CaO + Na2O + K2O)) versus A/NK, c K2O versus SiO2,d (Al2O3 + CaO)/(FeOt + Na2O + K2O) versus 100 (MgO + FeOt + TiO2)/SiO2 (wt%), e Rb versus Ta + Yb and f Ta versus Yb.Alkalic, alkalic-calcic, calcalkalic, and calcic fields in a.Fields in b after Chappell and White (1992), and fields in c after Sylvester (1989)
3.4 Ti concentrations
The Ti in zircon geothermometer (Watson et al. 2006;Ferry and Watson 2007) was employed to infer the temperatures at which the magma cooling and/or zircon growth took place.In handling this model,Ti and Si activities were set to unity during the calculation of crystallization temperature, owing to the fact that all analyzed samples contained rutile and quartz. Analytical procedures for these measurements were the same as those applied for trace element analysis. Temperatures were calculated from theTi concentration measurements based on the calibration presented in Ferry and Watson (2007).

Fig. 6 a The major mineralized outcrop exposure that dips westward (dip values 43—67)with sampling points at 60 ± 10 cm and main ore zone(area magnified).b A magnified ore enrichment zone. c Ore fragments obtained from the major ore body. d Altered finegrain granite (all samples contain disseminated Mo ore).e Fragments of mineralized pegmatite
4 Results
4.1 Cathodoluminescence imaging (CL)
A total of 34 zircon grain spots were analyzed from the sample, and representative CL images are presented in Fig. 7. The zircon grains are sub-euhedral with (110) and(101) indices of crystal faces being the dominant types.Prismatic zircon demonstrated aspect ratios of 3:1 and 2:1.Short prismatic to equant zircon grains are also observed with aspect ratios of 1.7:1. Images reveal variable zircon grain architecture. These include dark oscillatory zoned with or without subtle core-rim contrast(Fig. 7a, 1—9) and zircon grains with irregular patchy core domains with or without oscillatory rim domains (Fig. 7b, 1, 2). A few zircon crystals demonstrated complex homogenous dark grain texture with no observable zoning or rim-core distinction (Fig. 7c, 1—3). Other zircon crystals have dark weak irregular oscillatory-zoned rims with bright solidstate cored domains (Fig. 7d, 1—5). Some of these solidstate core domains exhibit evidence of fracturing (Fig. 7d,2, 3). Finally, CL-bright core-rim zircon grains illustrate weak oscillatory zoning with or without core-rim contrast(Figs. 7e, 1, 2). Occasionally, undefined elongated to subrounded inclusions are observed within the core-rim domains of some of the zircon grains(Fig. 7a,2,4;c,3;e,1).
4.2 U-Pb analysis
A range of zircon grain sizes, morphologies, and textures(Fig. 7a—e) were selected for zircon dating so as to avoid bias. U—Pb age data on zircon grains obtained by LA-ICPMS are summarized in Fig. 8a, b and Table 2. From the plot (Fig. 8a), the discordia line defines lower and upper intercept ages of 133 ± 130 Ma and 2489 ± 580 Ma respectively. The data-point error ellipses are 2σ with MSWD = 1075. Only 5 of 43 analyses showed a nearly concordant age and meaningful age range of ~580 to 680 Ma (Fig. 8a).

Fig. 7 Cathodoluminescence(CL) images of zircon grains from the Ekomedion two-mica granite (Laser ablation spots indicated in yellow). a (1—9)Dark oscillatory zoned with or without subtle core—rim contrast. b Zircons with irregular patchy core domains with or without oscillatory rim domains. c Homogenous dark grain texture with no observable zoning. d Zircons with dark weak irregular oscillatory-zoned rims with bright solid-state cored domains. e Grains with CL-bright core-rim grains that illustrate weak oscillatory zone with or without core-rim contrast. Rings on a, 2 and 4; c,3; and e, 1 enclose undefined elongated to sub-rounded inclusions
4.3 Lu-Hf analyses
The Lu—Hf data for the zircon grains used in the U—Pb analysis are presented in Table 3 and Fig. 9. The data exhibit median values of 0.282236 ± 0.000004 and 0.282285 ± 0.000002 for CMR09a and CMR09b zircon grains, respectively. Apparent εHftvalues for CMR09a zircon grains range between - 20.3 and - 0.4, with depleted mantle (TDM) ages from 1150 to 1986 Ma.Apparent εHftvalues for CMR09b zircon grains vary from- 9.3 to- 0.3,with TDMages between 1212 and 1587 Ma(see Appendix 1, Electronic Supplementary Material,ESM).
4.4 Trace elements

Fig. 8 a Concordia plot for zircon grain ages obtained from sample CMR09 from Ekomedion two-mica granite with near-concordant ages shown. b Histogram displaying ages of the zircon grains of CMR09(a, b) with a cluster around 200 to 380 Ma
The trace element composition of the zircon grains is presented in Table 4. The chondritic-normalized (Boynton 1984) REE patterns for both the CMR09a and CMR09b zircon grains are similar (Fig. 10). The analyzed zircon grains show a slight enrichment of MREE to HREE over the LREE and a remarkable negative Eu anomaly(Fig. 10).ΣREE + Y for most CMR09b zircon grains are between 1646 and 62,629 ppm, somewhat higher than those for the CMR09a zircon grains. The CMR09b zircon grains are characterized by slightly higher concentrations of U(908—12,460 ppm) than the CMR09a zircon grains, whose U concentrations range from 63 to 6720 ppm. Th concentrations are 270—8810 ppm and 138—5570 ppm for the CMR09b and CMR09a zircon grains respectively.The Th/U ratios are generally high, spanning from 0.11 to 2.20(Table 2).
4.5 Ti in zircon geothermometry
The two groups of zircon grains from the same sample involved in this study present a slight variation in crystallization temperatures(Fig. 11).Temperatures of group one zircon grains denoted CMR09a are above 780 °C (mineral inclusion zircon grains). Only two mineral inclusion-free zircon grains, CMR09a_2 and CMR09a_12 (with temperatures of 770 and 715 °C, respectively), are observed in this group(Fig. 11a).On the other hand,most temperatures of the CMR09b zircon grains (n = 18) are >780 °C for mineral inclusion zircon grains (Fig. 11b) while mineral inclusion-free zircon grains (n = 4) temperatures are between 650 and 780 °C. Individual zircon grains in all samples present a wide range of temperatures from 672 to 1232 °C.Zircon grains with high temperatures(>780 °C)are characterized by mineral inclusions, suggesting the intake of early formed mineral crystal into their structures.Samples CMR09a_2, CMR09a_12, CMR09b_21,CMR09b_23, CMR09b_25 and CMR09b_32 are free of mineral inclusions and constitute the low-temperature zircon grains.
5 Interpretation and discussion
5.1 Geochronology
The ages of granitic intrusions along the Central Cameroon Shear Zone (CCSZ) indicate that these granites are part of the Pan-African Belt(Van Schmus et al.2008).These Pan-African ages include, for example, 626—654 Ma for leucosomes of the Yaounde´ series (Ngnotue et al. 2012),644—686 Ma for the Sinassi batholith in the western domain (Bouyo et al. 2016), 610 Ma for the Fomopea complex (Kwekam et al. 2010), and 602 Ma for the Ngondo plutonic complex(Kwekam et al.2010).Recently,Ateh et al. (2017) dated granitic plutons in the Be´tare´ Oya gold district and reported a mean age of 635 Ma.
In this study, U—Pb ages for analyzed zircon of the Ekomedion two-mica granite range from 122 ± 3 to 743 ± 11 Ma (Table 2). These ages are plotted along a chord with only 5 of the 34 zircons being near-concordant(Fig. 8a).The near-concordant U—Pb ages with a mean age of 603 ± 12 Ma are similar to ages published for granitic intrusions along the Central Cameroon Shear Zone(CCSZ)in Cameroon. Mosoh Bambi et al. (2013) reported similar ages of 578 ± 4 Ma from monazite and xenotime grains in the study area.A wide range of younger ages(with a mean age of 262 ± 6 Ma) are displayed along the chord or discordant line. These younger ages (Table 2) represent an artifact of recent Pb loss or a redistribution of radiogenic Pb and such consequently are geochronologically meaningless (e.g. Amelin et al. 2000; Kemp and Hawkesworth 2013; Vervoort and Kemp 2016).
Pb loss in zircon grains from the Ekomedion two-mica granite is interpreted to be the result of volume diffusion of Pb through the zircon crystal lattice. This mode of Pb losshas been documented by Tilton (1960) who derived a formula to explain Pb loss through volume diffusion. In this study, we proposed two major factors as main contributors to Pb loss in these zircon grains: high uranium decay and low-temperature hydrothermal dissolution—precipitation. As discussed above, the grains thus affected are not included in the age determination analysis.

Table 2 U, Th and Pb concentrations (ppm) of the zircon grains with corresponding calculated ages at 95% confidence limit

Table 2 continued
Silver and Deutsch (1963) derived an equation to describe Pb loss through diffusion,and in this equation the diffusion coefficient is a function of U- and Th-induced radiation damage to the zircon crystal lattice. Some zircon grains in this study show very high U concentrations which are well above 10,000 ppm. When this U decays, both alpha recoil and fission track were accumulated in the zircon grains. These accumulations have the tendency of increasing the temperature within the crystal lattice of a zircon grain, which will eventually lead to the recrystallization of metamict zircon, resulting in Pb loss from the zircon crystal. Mezger and Krogstad (1997) and Meldrum et al. (1998) have demonstrated this role of U decay and recrystallization in Pb loss from zircons. Evidence of recrystallization is traceable in this study from CL images in Fig. 7b, 1, 2. Interestingly, the ages obtained for these grains are well below the formation ages for granites dated along the CCSZ,which give a positive correlation between the U decay,recrystallization model and Pb loss in the area.The five near-concordant ages are interpreted to be ages derived from unaffected zircon grains. This interpretation is in line with the observation that most zircon grains with near-concordant ages have low U concentrations.Our data,therefore, demonstrate the need to carefully select suitable grains for dating U-bearing granites, since zircon grains with high U content render meaningless ages. The ages derived from these five zircon spots are therefore representative of crystallization ages for the Ekomedion granitoid.


Fig. 9 Plot of apparent 176Hf/177Hf against apparent 206Pb/203U.This plot shows similarity in the Hf/Hf ratios, pointing to a single magmatic event
On the other hand, the contributing effects of hydrothermal fluid flow along the CCSZ (Figs. 1, 2, 3a)cannot be ruled out.Ketcham et al.(1999)have shown that at temperatures slightly above 250 °C radiation damage in zircon strengthened, while experimental data for Pb diffusion in zircon revealed negligible Pb loss from zircon grains at temperatures >900 °C in non-metamict crystals(Cherniak and Watson 2001).The CCSZ which hosts these granitic plutons, as well as the Cameroon Volcanic Line(CVL) which runs parallel to the CCSZ, provide conduits through which hydrothermal and magmatic fluids circulate and rise to the surface with a decreasing temperature gradient. These low-temperature hydrothermal fluids are capable of initiating Pb loss through dissolution—precipitation processes as demonstrated by Geisler et al.(2002, 2003) and Zhong et al. (2018). Figure 7a2, d1—d5,e2 shows evidence of zircon grains with discordant ages and with no evidence of recrystallization, suggesting that the Pb loss mechanism (which presumably occurred through dissolution—precipitation processes) was initiated by low-temperature hydrothermal fluids. Evidence of Tertiary to recent volcanic events that are suspected to have contributed to the diffusion of Pb is found in the southwestern domain of Ekomedion, where the granitic plutons are partially overlain by mafic volcanic rocks (Fig. 3b).Also, the volcanic edifice Mount Manengouba (Fig. 3a),just ~50 km away from the area of study, provides more clues to possible Pb loss initiators in the area. Figure 12 presents a combined model for possible Pb loss mechanisms in this area.Pb diffusion as a result of reactivation or a tectonic event has been reported in the Archaean Congo craton, Southern Cameroon (Shang et al. 2010). Figure 13 shows variable plots of Hf-U, Pb-U, Hf—Pb and apparent176Hf/177Hf—206Pb/238U (age), which were used to check the behavior of U, Pb and Hf concentrations within the system. The Hf-U plot correlated positively with high values of Hf and U indicating that the system is rich in U(Fig. 13a).Pb exhibits a weak but positive correlation with U, pointing to open system behavior that leads to Pb loss(Fig. 13b). This is further supported by the presence of an inverse relationship on the plot of Hf—Pb (Fig. 13c). Plotting apparent176Hf/177Hf against apparent206Pb/238U(age)revealed that these granitic plutons were formed from a single magmatic event owing to their similar176Hf/177Hf ratios (Vervoort and Kemp 2016), with a few outliers that are attributed to the inherited zircons (Fig. 13d). These conclusions add more weight to our interpretation of inherited cores (Fig. 7).
5.2 Provenance and petrogenetic processes
During mantle melting, Hf is partitioned out of the melt more than Lu. This activity, therefore, increases176Hf/177Hf to higher values in the mantle than in crustal rocks. Following this argument, granitic magmas with higher176Hf/177Hf(εHf ≫0)are an indication of juvenile input from mantle-derived mafic melt or of reworking of young mantle-derived mafic lower crust.Meanwhile,lower values of176Hf/177Hf (εHf <0) are attributed to crustal reworking (Belousova et al. 2006). Zircon grains in this study show low176Hf/177Hf values and negative εHf values(the whole range is - 20.3 to - 0.3; see Fig. 14a, b),which is similar to the low values (εHf <0) proposed for crustal reworking,suggesting that the parental magma was derived from a pre-existing crustal source with contributions from the lower crust.This,therefore,suggests that the source of U—Mo mineralization in the area might have been remobilization from partial melting of sediment-derived surrounding gneisses.
The data offer a glimpse of some petrogenetic processes during magma ascent as shown in Fig. 14. The U—Th concentrations in the zircon crystals correlated positively with Th/U ratios that cluster within the fields of Th/U >0.1 and Th/U of 1.0 and beyond (Fig. 14c). This positive trend reveals characteristics of zircon grown within a melt experiencing fractional crystallization (e.g.Miller and Wooden 2004; Claiborne et al. 2006). This fractional crystallization process was further confirmed within the system by comparing the Th/U ratios with corresponding Hf concentrations in the zircon grains, which yielded an inversely proportional trend of increasing Hf with decreasing Th/U ratios (Fig. 14d). This pattern indicates that the zircon grains crystallized in a magmatic system where fractional crystallization was taking place(e.g. Barth and Wooden 2010; Claiborne et al. 2010;Castin~eiras et al. 2011). The role of fractional crystallization in the mineralized pegmatitic pods that host the U—Mo in the Ekomedion area has been speculated by Mosoh Bambi et al. (2012). In this study, data from zircon give more insight into the fractional crystallization process and further attest to the role played in the U—Mo mineralization in the area.
The sum of REEs ranges from 696 to 39,957 ppm, and this range is considered to be typical of magmatic zircon.La is not present on this plot because its concentrations are below the detection limit(bdl)for all samples.The zirconsdisplayed enrichment in HREE over the LREE (Fig. 10).This implies an early crystallization of the zircon within a magmatic system (Belousova et al. 2002; Heinonen et al.2016).Heavy REEs are compatible in relative terms to the LREEs due to their small ionic radius making them preferentially incorporated into the early-formed crystal in a fractionating magma system. The typical chondrite-normalized REE pattern of a magmatic zircon is shown by zircon standard R33. Although it has been shown over the years that LREE enrichment is a characteristic feature of hydrothermal zircon, many mechanisms have been proposed apart from hydrothermal processes that can also cause LREE enrichment above that published by Black et al. (2004) for the R33 standard (as was observed in this study; see Fig. 10). These mechanisms could include inadvertent analysis of REE-bearing inclusions like apatite,titanite, allanite, xenotime (Cavosie et al. 2006; Burnham and Berry 2012 and Bindeman et al. 2014); zircon crystallization from LREE-rich melts, as proposed by Whitehouse and Kamber (2002); and zircons grown under the process of metamorphism (Xia et al. 2010). Based on Fig. 14d, all zircons in this study classify as magmatic zircons,therefore ruling out the possibility of metamorphic and hydrothermal zircons being responsible for the elevated LREE content (Fig. 10). The laser ablation spots for zircons in this study were carefully selected under optical and electron microscopes to avoid observable mineral inclusions (Horie et al. 2006; Pettke et al. 2005; Whitehouse and Kamber 2002).However,due to the fact that the analytical method(LA-ICP-MS)used in this study tends to penetrate grains to a considerable depth (6—8 μm) with an analytical beam of >30 μm in diameter, this technique may be inaccurate in excluding mineral inclusions smaller than 1 μm, particularly those distributed uniformly within the zircon crystal(Zhong et al.2018 and reference therein).Based on this consideration, we therefore attributed the elevated LREE concentrations to contamination of the REE-enriched minerals resulting from inadvertent analysis of REE-bearing inclusions such as apatite,titanite,allanite,and xenotime (Whitehouse 2003; Zhong et al. 2018). We also argue that ample zircon crystallization could have led to the intake of LREEs as the residual melt became enriched in light REEs. Proof for the later enrichment in LREEs is reported in the whole rock geochemistry for this same rock, in which an LREE enrichment is observed(Fig. 4; Mosoh Bambi et al. 2012).

Fig. 10 Spider plot for the REE distribution in the zircon sample from the two mica granite (CMR09), at the Ekomedion U—Mo prospect. Plot illustrates a pattern that mimics that of the zircon standard R33 published by Black et al. (2004). All samples show a negative Eu anomaly with enrichment in HREE over the light

Fig. 11 Calculated Ti-in-zircon temperatures for sample CMR09.a Temperatures for CMR09a zircon grains with clustering at approximately 850—980 °C. b Higher temperatures register for CMR09b zircons with temperatures above 780 °C(n = 18)and those below 780 °C (n = 4)
The similarity in the REE patterns for the individual zircon grains shows that the parental magma involved in the formation of the Ekomedion two-mica granite and the parental magma of the earliest formed zircon grains (inherited cores) were likely generated from the same source(Belousova et al.2006).Europium(Eu)exists as a divalent(Eu2+)and a trivalent(Eu3+)cation.Because Eu2+readily substitutes for Ca2+in plagioclase in a reducing environment,Eu fractionates from the melt,resulting in a negative Eu anomaly. Eu3+, on the other hand, is incompatible and will remain in the magma, resulting in a positive Eu anomaly. All zircon grains exhibited a remarkably similar negative Eu anomaly(Fig. 10),suggesting an abundance of feldspars with or without mafic mineral crystallization before and during the zircon crystallization (Hoskin and Schaltegger 2003; Belousova et al. 2006; Castin~eiras et al.2011).This abundance of feldspars is observed in the study area within pegmatitic pods that host the U—Mo mineralization. The effect of feldspar (plagioclase) on Eu within the magmatic chamber is further illustrated on a plot of Eu/Eu* against Hf concentrations. The pattern revealed a progressive plagioclase fractionation with decreasing values of Eu/Eu*as the melt evolved to higher concentrations of Hf (Fig. 15a).
A previous study by Mosoh Bambi et al. (2012)demonstrated the role of the halogen fluorine (F) as a ligand in the formation of the U—Mo mineralization at Ekomedion. In this study, zircon Y/Ho ratios (29—33)showed a clustering close to the chondritic ratio of 28 on the Y—Y/Ho plot and registered a low F content(Fig. 15b).Bau (1996) has shown that fractionation of Y and Ho in igneous systems occurs in highly evolved granitic melts with elevated concentrations of H2O and high Li,B,F,and/or P concentrations. This implies that originally theEkomedion granitic melt was poor in F during the early stage of zircon crystallization (magmatic zircons) and as the melt evolved the F concentration increased in the magmatic-hydrothermal fluids capable of impacting U—Mo mineralization, as reported by Mosoh Bambi et al. (2012).The late-stage F acted as the ligand and F enrichment is highly evident in the pegmatitic pod mineralization type(high F values in the associated micas;Mosoh Bambi et al.2013) observed in the area, since pegmatite tends to form from low temperature residual magmatic-hydrothermal fluids.
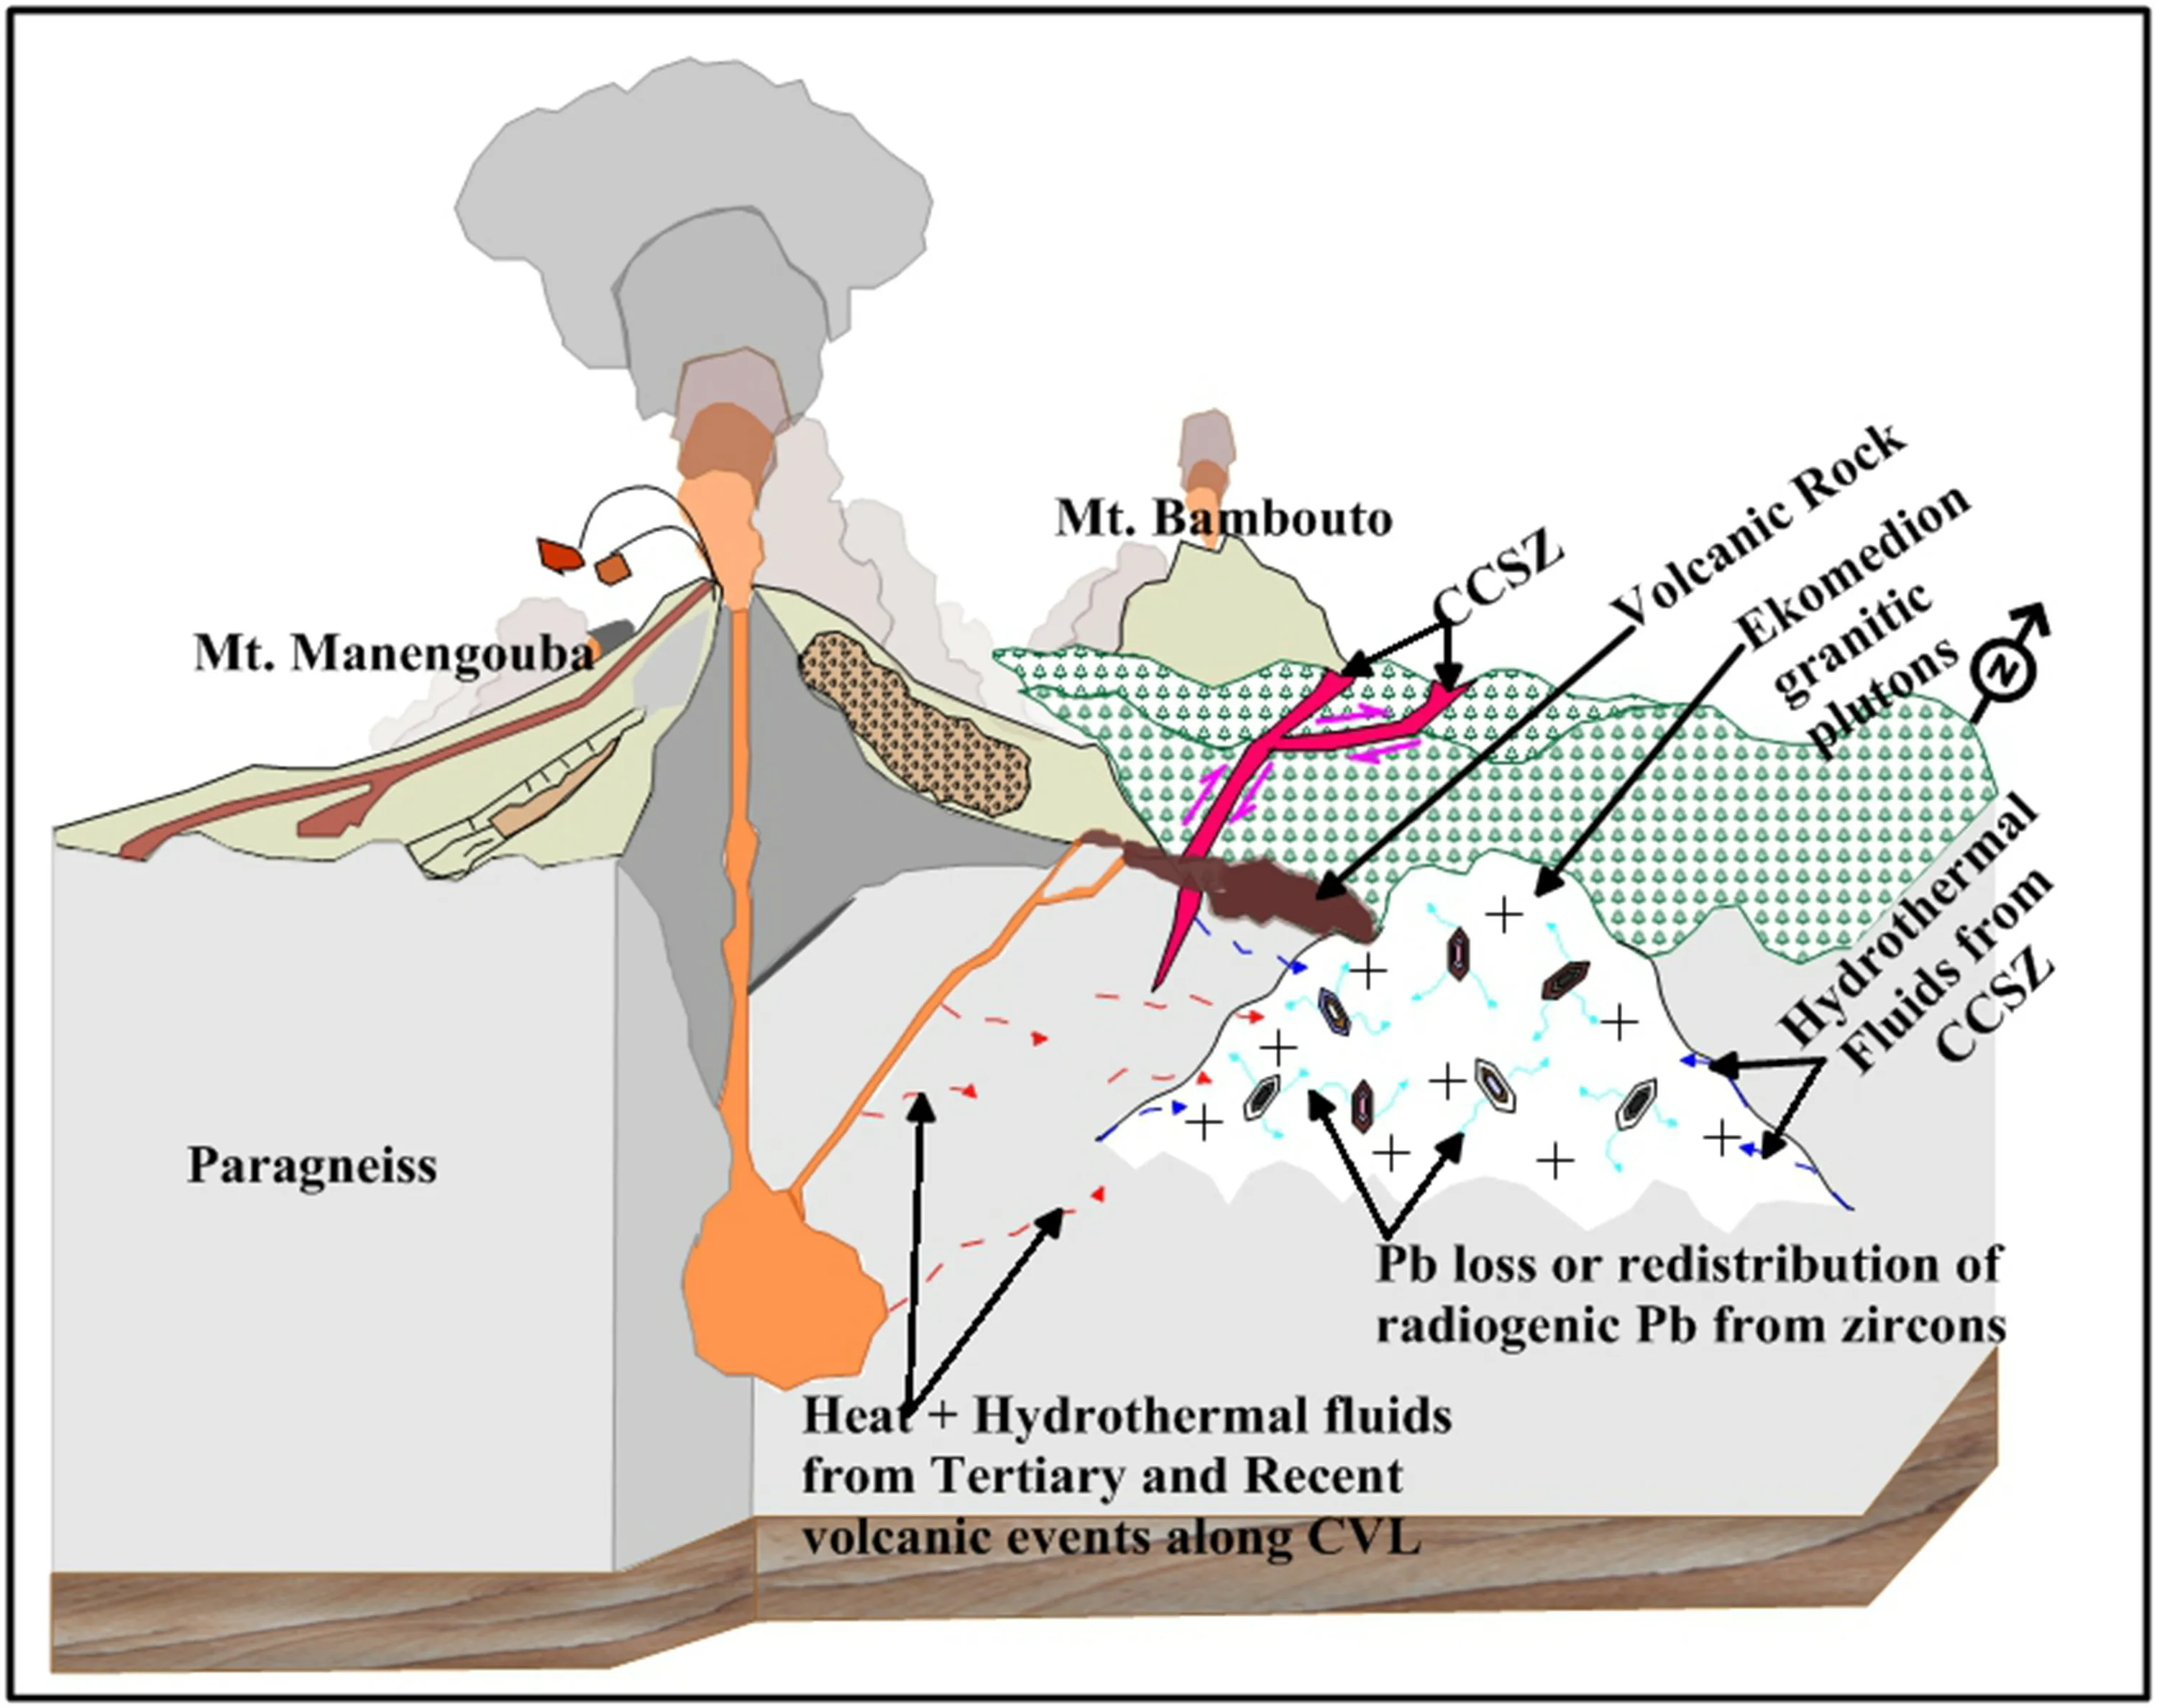
Fig. 12 A schematic sketch of the proposed model for Pb loss within the Ekomedion granitiods and environs. The model shows contributions from Tertiary to recent volcanic activities along the Cameroon volcanic line (CVL). Also, the Central Cameroon Shaer Zone(CCSZ) close to the area of study provides a pathway for fluid circulation in the area to promote Pb loss by leaching
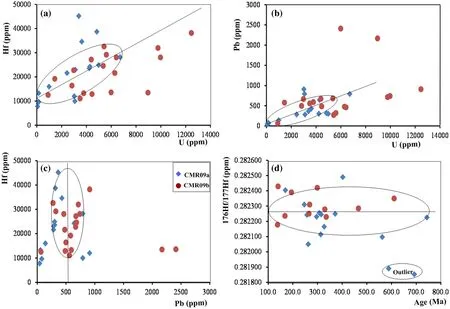
Fig. 13 Variable plots of a Hf—U;b Pb—U;c Hf—Pb and d apparent 176Hf/177Hf—206Pb/238U(age)performed to check the behavior of U,Pb and Hf concentrations within the system

Fig. 14 Petrogenetic processes which prevailed in the magma that eventually rose and formed the Ekomedion granitic plutons; a, b Low and negative εHf values(- 20.3 to- 0.3)that mimic the εHf <0 values proposed for crustal reworking;c Zircons with positively correlated U—Th concentrations with Th/U ratios that cluster within the fields of Th/U >0.1 and Th/U = 1.0 and beyond. d Decreasing Th/U ratios with a corresponding increase in Hf concentrations, which illustrate fractional crystallization
5.3 Ti-in-zircon temperatures
Crystallization temperatures for this magmatic system as inferred from Ti in zircon thermometry span from 672 to 1232 °C (Fig. 11). This large range of temperatures obtained from both CMR09b and CMR09a zircon grains reveals an intake of early formed mineral inclusions in the zircon grains during crystallization. The incorporated minerals are suggested to have altered the crystallization temperatures through a double effect leading to temperatures above the norm for granitic systems. The crystallization temperature for this granitic body is defined by the samples MCR09a_2, MCR09a_12, MCR09b_21,MCR09b_23,MCR09b_25 and MCR09b_32,which are all clear of mineral inclusions. This group defines a relatively narrow temperature range from 672 to 770 °C that is interpreted to be the cooling temperatures of the melt.Similar temperature ranges have been proposed for zircon grains from plutonic rocks (Watson et at. 2006; Harrison and Schmitt 2007).
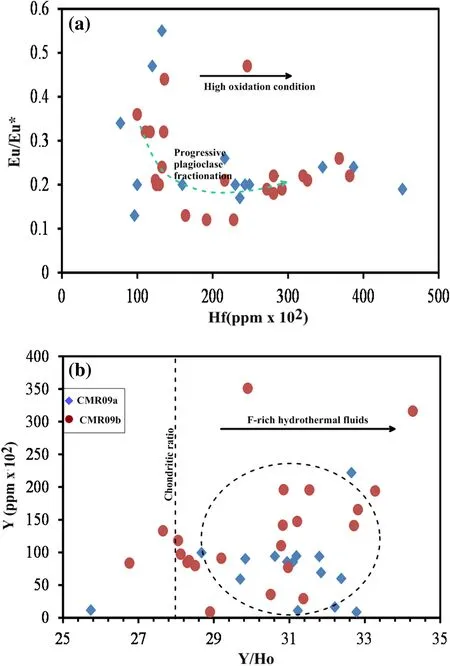
Fig. 15 Evidences of fractional crystallization in the system from which the analyzed zircons grains were derived. a Effect of plagioclase fractionation on Eu, leading to a strong negative Eu anomaly in the system; b fractionation of Y and Ho in the system,showing a F-poor system
6 Conclusions
Based on the data presented here, the following conclusions are drawn:
1. The new age data provide evidence of a Pan-Africa event dated at 603 ± 12 Ma. However, several zircon grains present evidence of recent Pb loss in the Ekomedion two-mica granite, which might have been caused by uranium decay,Tertiary to Recent magmatic activities and/or hydrothermal fluid flow along the CCSZ. We therefore conclude that these effects might not be local but should be checked on a regional scale along the CCSZ, CVL and beyond.
2. Parental magma involved in the formation of these granitic plutons was generated from the crust with contributions from the lower crust. This is clearly illustrated by the lower values of176Hf/177Hf (εHf <0).This puts the country gneiss at the center of U—Mo origin in the area through partial melting of sedimentderived surrounding gneiss. Th/U ratios with corresponding Hf plots showed that during magma ascent the melt underwent fractional crystallization, which is the main process believed to have controlled pegmatitic pod mineralization at Ekomedion. U—Mo mineralization in pegmatitic pods was assisted by enrichment in F in late-stage magmatic-hydrothermal fluids.
3. The analyzed zircon grains were typical of magmatic origin, with elevated LREE resulting from inadvertent analysis of REE-bearing mineral inclusions and ample crystallization of zircon from late-stage REE-rich fluids.
FundingFunding was provided by Alexander von Humboldt-Stiftung (DE).
杂志排行

Acta Geochimica的其它文章
- Chemical structure of the Earth’s mantle defined by fast diffusion elements like helium
- A helium stratified and ingassed lower mantle: resolving the helium paradoxes
- Mechanism of accelerated dissolution of mineral crystals by cavitation erosion
- Zircon U-Pb age and geochemical constraints on the origin and tectonic implication of the Tuotuohe Cenozoic alkaline magmatism in Qinghai-Tibet Plateau
- Evaluation of the potential risks of heavy metal contamination in rice paddy soils around an abandoned Hg mine area in Southwest China
- Low-temperature alteration of uranium-thorium bearing minerals and its significance in neoformation of radioactive minerals in stream sediments of Wadi El-Reddah, North Eastern Desert, Egypt