带多普勒频移的瑞利衰落信道中无线通信系统的设计与仿真研究
2020-03-05俞骋
俞骋
(宁波第二技师学院,宁波315012)
1 Introduction
In this project we have studied the design methodology for an OFDM system over a time-varying, frequencyselective Rayleigh fading channel. We characterized the time and frequency variations of the channel in terms of coherence time and coherence bandwidth. These parameters were used to design and simulate a communication system to transmit over the fading channel according to specified system requirements. We analyzed and compared the BER results with theoretical results.
2 Uncoded OFDM over Time-varying Frequency-Selective Rayleigh Channel
The information bits b[k] are generated and transformed into symbols s[p] using QPSK. Each symbol carries energy E.

The multicarrier modulation divides the whole bandwidth into smaller bandwidths, creating narrowband subchannels. The number of subchannels is chosen so that each subchannel has a bandwidth less than the coherence bandwidth of the channel. This ensures that each and one of them experience relatively flat fading and thereby reducing ISI considerably.
The QPSK symbols are then blocked into blocks of N symbols to form the transmitted vector s[m]. The large number of closely spaced orthogonal subcarriers s[m] are used to carry the data. To obtain the time domain samples we used the scaled IFFT.In MATLAB this was done as

To make the channel output reach steady state, a cyclic prefix Ncpconsisting of the last samples within a single OFDM block is added to the beginning of the block.Since these samples carry the same information as the last samples they can be discarded without losing any information.
The length of the channel impulse response is τLsamples which in our case was equal to 4 samples, so the channel output will be in steady-state after 4 samples.
The channel time-varying frequency response, C[k,n], should be close to constant over an OFDM symbol for an OFDM system to work properly. So the OFDM symbol duration, (N+Ncp)Tsshould be small compared to the inverse Doppler frequency,1/ fD.If this condition is not satisfied there will be inter-carrier interference (ICI). Therefore, the length of the cyclic prefix and the OFDM symbol was chosen such that it satisfied the condition

Complex white Gaussian noise with variance N0/Tswas generated and added to the transmitted signal. At the receiver side the cyclic prefix Ncpwas removed and we were left with the steady state response to each OFDM symbol with complex Gaussian noise.To get the frequency domain samples we used a scaled FFT. In MATLAB this was done as

The received signal r[m] was then multiplied with the complex conjugate transpose of the channel C [m] to compensate for the phase rotation caused by channel.

Here s^[m] can be viewed as soft decisions of s[m]and scaling with C⋆[m] as the first step for maximum ratio combining if repetition coding is used.
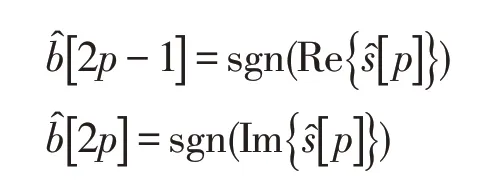
Finally,the bits were decoded fromas

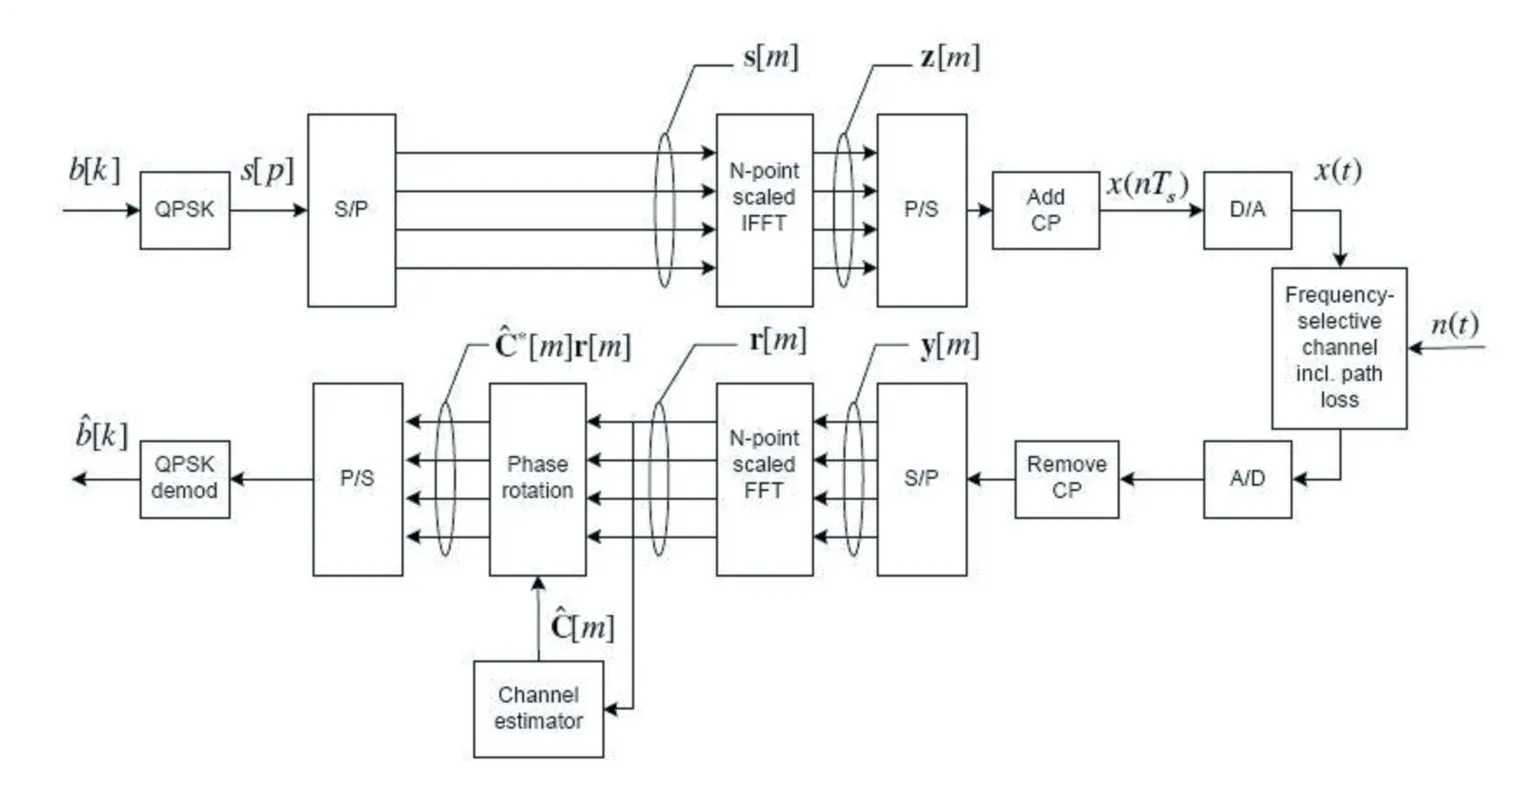
For an overview of the described procedure, see figure 1.

Figure 1 Framework of the designed wireless communication system
Simulation and Result:
The simulations were done to design a communication system to transmit over a frequency selective, timevarying Rayleigh fading channel. The fading channel was specified to have two taps with the delay of τ1=0 sample and τ2=4 samples.The two taps have independent channel gain and the same power delay profile of Ac=0.5.The operating frequency was set to f0=2 GHz and the sampling frequency for the A/D-converter to 1 MHz. We had an average transmitted power Pt=0.1 W and a noise spectral density at receiver end of N02=2.07*10-20W H. The path loss was set to 101 dB. The receiver speed was set to 15 m s.
A bit error probability of 5*10-3at a bit rate of 1.85 Mbps was required for the communication system. The bit error probability for the range EbN0=[ ]0,25 dB, was simulated.Perfect channel estimation was assumed.
To simulate the bit error probability for different γb=EbN0we needed to express the energy per transmitted sample, E, as a function of Eb. For comparison of the simulated BER with the theoretical results,the average error probability was calculated from the instantaneous error probability for QPSK.
The number of sub- channels were selected to N=64. The maximum delay of the channel is 4 samples.Therefore, the cyclic prefix was chosen to 5 samples. For these two values the condition ( )N+NcpfDTs=0.0069≪1 was satisfied together with Ncp≥τL. The bandwidth of each sub-channel in the system was

Since there are 64 channels in the system the total bandwidth was 64*14.5 kHz=0.93 MHz. This corresponds to a bit rate for QPSK of Rb=1.855 Mbps
The bandwidth BNof each subchannel should be less than the coherence bandwidth Bcof the channel.This means that the fading across the signal bandwidth is highly correlated, which means that the fading is close to equal over the bandwidth. Coherence bandwidth Bcof the channel is approximately equal to the inverse channel delay spread Tm.

From this the coherence bandwidth Bcwas computed to be Bc==250 kHz. Thus, the condition BN≪Bcwas satisfied. The coherence time Tcis that smallest interval of time Δt over which is nonzero i.e. the channel decorrelates after a time Tc.The coherence time is approximately equal to the inverse Doppler spread BDof the channel. If transmitter and scatters are stationary and the receiver is moving, BDis equal to the Doppler frequency.So

Each sub-channel should have time duration smaller than the coherence time of the channel. The time for each sub-channel was calculated as

Thus,the condition TN≪Tcwas satisfied.
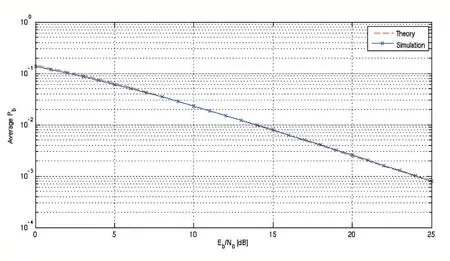
In figure 2 the result from the simulation is plotted.The average probability of bit error Pbwas plotted as function of Eb/N0from 0 to 25 dB. The SNR is changed in steps of 1 dB. For comparison, the theoretical Pbwas also plotted in the figure. Simulations are averaged over three channel realizations with 64 Mbit sent per channel,and we counted the number of received bits in error to get the average error.From figure 2 it is clear that the simulated curve closely follows the theoretical curve and it fulfills the specified BER of 5*10-3around Eb/N0of 15dB.The specification was to fulfill this BER at roughly 20 dB so the system performance is a lot better.

Figure 2 BER compared with the theoretical curve
3 Coded OFDM
In the second part of the project we exploited the frequency diversity which is inherited in a time-varying frequency-selective channel.For this purpose repetition coding was used.To get diversity gain a codeword has to be repeated in such a way that each repeated codeword experience independent channel fading. This sort of combining exploits the fact that independent signal paths have a very low probability of being in a deep fade simultaneously.Simulation and Result:
We used the frequency diversity instead of time diversity as it is more efficient in this case. The coherence bandwidth Bcof channel is 250 KHz. Thus, for diversity L=1,2,3 we can repeat our code words after every 1MHz 500 KHz and 333KHz respectively which in all cases is greater than coherence bandwidth Bcof the channel.Thus,all repeated code words will theoretically experience independent channel fading. On the receiver end we combined the repeated code words (weighted sum) and then made the decision on the basis of this combination.The parameters are exactly the same as in part 1 except that we have to achieve a bit error probability of 2*10-4.
We have implemented different interleavers as no restriction being put on the choice of interleaver. For the case of L=1, we have sent the whole OFDM block of 64 symbols. For L=2, we designed our interleaver in such a way that we sent first 8 symbols s1…8 and repeated them directly, then next 8 symbols s9…s16 and repeated them and so on. This design was chosen after studying the frequency behavior of the channel and gave us really good BER as can be seen in figure 3.
For L=3, we grouped 3 symbols together and repeated them. The symbols were read into the interleaver row wise and readout column wise as shown below.

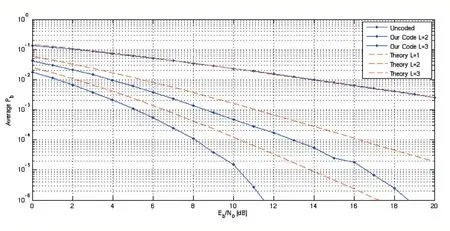
In figure 3, the result from the simulation is plotted.The average probability of bit error Pbwas plotted as a function of Eb/N0from 0 to 20 dB. The SNR is changed in steps of 1 dB. For comparison, the theoretical Pbwas also plotted in the figure. Simulations are averaged over three channel realizations with 64 Mbit sent per channel and we counted the number of received bits in error to get the average error.
From figure 3 it is clear that the simulated curves follow the same characteristic as the theoretical curves, and that L=2 fulfill the specified BER of 2*10-4around Eb/N0of 11 dB.

Figure 3 The BER results compared with uncoded performance and theoretical BER curve for MRC with different diversities.
4 Discussion
For L=1, we got the same simulated curve as for the uncoded part as we are not getting any diversity gain in this case. For L=2, 3 simulated curves are better than the theoretical curves though they exhibit the same characteristic (e.g. slope). It is pretty reasonable since the theoretical curve was calculated using MRC formula of average bit error probability Pbfor average Rayleigh fading channels.
In our case we had a static channel regarding frequency periodicity. This comes from the fact that we assume a constant velocity of the receiver. Amplitude changes over time,because the two taps change in fading independently over time. By observing this behavior we have designed our interleavers in such a way that we are getting better simulated curves than the theoretical average curves.
It is possible to use an even lower diversity then L=2,say for example L=1.25, to achieve the specified BER of 2*10-4. This will increase the transmission rate and still satisfy the specified condition for BER. Since L=2 results in a bit rate only half as high as L=1, it would not be the smartest choice for a channel with high bit rate demands.
