Measuring the resilience of an airport network
2020-01-09YanjunWANGJianmingZHANXinhuaXULishuaiLIPingCHENMarkHANSEN
Yanjun WANG, Jianming ZHAN, Xinhua XU, Lishuai LI,Ping CHEN, Mark HANSEN
a College of Civil Aviation, Nanjing University of Aeronautics and Astronautics, Nanjing 210016, China
b Department of Aeronautics and Astronautics, Massachusetts Institute of Technology, Cambridge 02139, USA
c Air Traffic Management Bureau, Beijing 100012, China
d Xiamen Airlines, Xiamen 361006, China
e Department of Systems Engineering and Engineering Management, City University of Hong Kong, Kowloon, Hong Kong, China
f State Key Laboratory of Air Traffic Management System and Technology, Nanjing 210000, China
g Department of Civil and Environmental Engineering, University of California, Berkeley, CA 94720, USA
Abstract Resilience is the ability of a system to withstand and stay operational in the face of an unexpected disturbance or unpredicted changes. Recent studies on air transport system resilience focus on topology characteristics after the disturbance and measure the robustness of the network with respect to connectivity. The dynamic processes occurring at the node and link levels are often ignored. Here we analyze airport network resilience by considering both structural and dynamical aspects. We develop a simulation model to study the operational performance of the air transport system when airports operate at degraded capacity rather than completely shutting down.Our analyses show that the system deteriorates soon after disruptive events occur but returns to an acceptable level after a period of time. Static resilience of the airport network is captured by a phase transition in which a small change to airport capacity will result in a sharp change in system punctuality.After the phase transition point,decreasing airport capacity has little impact on system performance.Critical airports which have significant influence on the performance of whole system are identified,and we find that some of these cannot be detected based on the analysis of network structural indicators alone.Our work shows that air transport system’s resilience can be well understood by combining network science and operational dynamics.
KEYWORDS Air transport;Complex networks;Network resilience;Resilience indicator;Transportation resilience
1. Introduction
Air transport has been an important mode of transportation for many decades.In 2017,a total of 4.1 billion passengers flew on commercial airlines according to preliminary statistics from the International Civil Aviation Organization (ICAO).1Continued traffic growth puts continuing pressure on the aviation industry to expand operations without compromising safety or service quality. Hence, significant attention has been given to the development of advanced systems/tools and operational concepts to improve the safety, predictability, and efficiency of air transport systems.For instance,Trajectory Based Operations (TBO) promises to enhance air traffic safety, predictability, and efficiency. As one of the core concepts of next generation air transportation system, TBO relies on the planning and prediction of four dimensional trajectories(4DT, the position of aircraft in 3D space plus time), along with algorithms that explicitly calculate conflict-free trajectories for thousands of flights.2-4
While many dimensions of aviation system performance are being advanced through concepts such as TBO, resilience has not been so widely investigated in this domain.5As a complex socio-technical system, air transport system is composed of a huge number of interconnected subsystems with complex interactions between them.It may therefore be highly vulnerable to internal or external disruptive events. For example, a single airport closure due to serve weather or industrial action can have widespread systemic effects. The consequence caused by such disruptive events can range from a few delayed flights to system collapse.6As reported in Ref.7the average damage arising from US transportation system disruptions from extreme weather exceeds $1 billion annually. On April 3,2018, an inadvertent link between a computer being used to test new software and the live operational system triggered the Enhance Tactical Flow Management System (ETFMS)outage which caused almost half of European flights to be delayed.8,9To prevent such system failures and to make contingency plans, it is crucial to understand the resilience of the air transport system.
Resilience,the ability of a system to remain operational and withstand the impact of unexpected disturbances or unpredicted changes by adjusting its structure or activity,has drawn a lot of attention in a wide range of disciplines, ranging from economics,10through ecology,11to engineering fields.12,13Despite various definitions of resilience given in these works,a general consensus is that resilience has four major properties,commonly referred to as the 4Rs: Robustness, Redundancy,Resourcefulness, and Rapidity.14Robustness is mainly used to describe the ability of a system to maintain its basic functions in the presence of disruptions/errors, while redundancy is the availability of substitutes that can be used when some parts of the system are damaged or malfunction. Resourcefulness refers to the ability of the system to mobilize needed resources, while rapidity is the speed at which the system can be restored to normal operation.
A review of generic definitions and measures of resilience in the context of engineering systems can be found in Ref.15.The definitions of resilience can be further divided into three groups based on the phases of system response when disruptive events occur. In this regard, the terms absorptive capability,adaptive capability, and restorative capability have been suggested, and an integrated metric for quantifying system resilience is developed.16However, the definition and metrics for resilience in air transport have not yet been well explored.
A wide body of research on resilience can be found in transport studies, especially transportation networks facing natural hazards or inclement weather.17,18Resilience can be investigated either by modeling system evolution or by analyzing empirical data. For instance, Nogal et al.19investigate the dynamical aspects of a system when disruptive events take place. They assess the resilience of a transport network from the beginning of the disruption to total system recovery. To simulate network performance evolution, they develop a dynamic equilibrium-restricted assignment model. A second example is to quantify the resilience of transportation system using vehicles’GPS data.20Gao et al.21developed a set of analytical tools to predict system resilience.They found that three key structural factors affecting system’s resilience are density,heterogeneity and symmetry. However, their work is limited since the systems examined are those in which interactions between nodes are mutualistic.
Research about the resilience of the air transport system has lagged until recently, when a few publications have appeared.22,5,6,23,24However, there has been considerable research focusing on the robustness of airport networks over the past two decades.25These works mainly focus on statistical regularities uncovered from analyzing airport or airline networks.Airport networks are normally defined based on scheduled flights, with airports as nodes and direct flights between them forming the edges. Network robustness is typically measured by assessing changes in topological metrics that result from removing certain nodes when disruptive events occur.For example, Lordan et al.26modeled the global air transport network and assessed robustness based on simulated attacks on certain airports chosen based on different selection criteria.They found that an adaptive selection strategy based on betweenness centrality can be used to detect the critical airports whose failure would cause a great loss of network connectivity. Du et al.27by employing a modeling approach based on multiple layer networks, found that Chinese airline network is less redundant than the worldwide airline network.Hossain and Alam28analyzed the robustness of Australia Airport Network(AAN)under different disruptive scenarios,and found that the AAN is robust when a few edges or air-routes fail, but is very sensitive to malfunctions of central nodes(those with high degree and betweenness) measured by topological sensitivity, reachability and re-routing cost. Ren and Li29compared the structure of the China and United States air traffic networks. They found that Chinese air traffic network is less well connected and less robust.
Attention has recently shifted from discovering macroscopic properties of complex networks to understanding the role of individual nodes, links, and motifs played in the network,30,31using network science and big-data techniques.Cong et al.32found six airports which play important roles in delay propagation within the Chinese airport network. Du et al.33focused on identifying critical links that have the largest impact on network robustness as measured by the size of giant components. However, the complex networks approach has important limitations. One obvious one is that system dynamics are neglected since these works focus only on the static structure of the system. This means that the ability of the system to adapt to disruptions is neglected.
As the importance of complexity as a fundamental feature of air transportation has become increasingly recognized, we need to rethink the resilience of the system. There are several important questions that still need to be answered. For example,how do we assess the resilience of airport networks?Where are the vulnerable parts of the system?How can we increase air transport resilience? In this paper, we present an experimental study to understand airport network resilience.Specifically,we want to explore(A)what is the degree of disruption the system can absorb while still being able to function; (B) what is the relationship between resilience and network dynamics (specifically how flight delays and punctuality change over time) in an air transport setting.
The rest of this paper is structured as follows: Section 2 describes disruptive events in air transport system and their impacts. In Section 3, we propose four metrics to measure the resilience of airport network. Section 4 presents a simulation model and scenarios used to evaluate these metrics.Results are analyzed in Section 5. Section 6 gives concluding remarks and discusses future studies.
2. Disruptive events in transport system and their impact
Fig. 1 depicts how a disruption affects the performance of a system over time. As shown in Fig. 1, the system operates in an initial steady state before disruptive event(s) occur at time t0. After the disruptive event occurs, the performance of the system begins to decline at time td. Three possible paths that the system may follow are represented by the solid red line,blue dashed line, and grey dashed line in the figure. In the first scenario (red line), when the negative impact of disruptive events dissipates, the performance of the system will gradually recover without any outside intervention until it reaches the original steady state. In the second scenario (blue dashed line), the system first reaches a new steady state, but eventually returns to its original state. For example, temporary routes may be built quickly for the purpose of rescue and to meet immediate needs when transportation systems are damaged due to earthquake or other natural disasters.It may take weeks or months for the system to fully recover.The worst scenario is that the system is unable to recover(shown in grey dashed line). When severity of the disruption exceeds some limit, the system completely collapses. For any given path, the performance lost is the gap between the performance in the original steady state and the worst performance after the disruption; this is shown for the second scenario in Fig. 1.
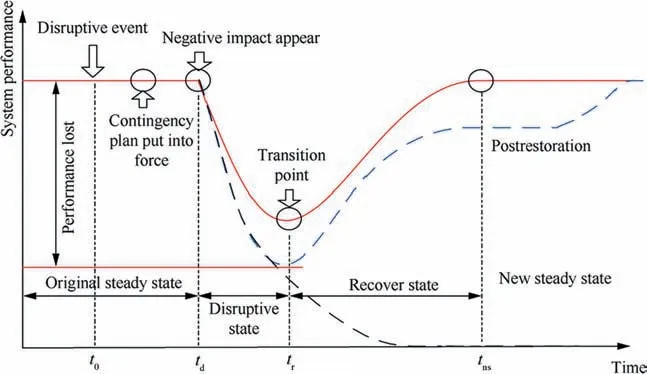
Fig.1 System performance evolution before and after disruption.
In air transport systems, disruptive events occurring around airports include severe weather (e.g. dense fog, heavy rain, snow), equipment outages (e.g. approach lighting outages), terrorist attacks, and accidents. These events usually force the airport to operate in a degraded mode instead of shutting down. The capacity of the affected airports decreases and then returns to a normal level after recovery.In contrast to what is assumed in most studies on airport network robustness, the decrease in node capacity will not disconnect it from the rest of the network, but could result in a large number of delayed flights at both the airports directly affected by the disruptive events and other airports as a result of delay propagation. When disruptive events occur, the system will normally not collapse; rather it will absorb the perturbations, withstand the disruption, and thus remain functional. Normally, the system will bounce back to an acceptable stable state after a period of recovery if the external ‘‘pressure” is not too great. In the worst case, the system will not be able to regain its original state. In this setting,resilience is the ability of the system to return to its original state after a disruption.
The understanding of the resilience of air transport network has fundamental meanings to both academic and engineering fields. Recent resilience studies in air transport have explored the resilience from a particular perspective, such as scheduled block time reliability (Hao and Hansen 2014), airport closures due to weather or natural disaster,6,23or the cost of resilience of an air traffic management system.23However, few efforts have been made to develop metrics of air transport network resilience that comprehensively account for the impact on air traffic operations. This paper focuses on understanding the operational resilience of an air transport network when perturbations occur in airport(s) via the analysis of several resilience metrics. The analysis is built upon previous work on the impact of flight schedule and ground turn-around times of aircraft on delay propagation,but is geared toward evaluating system wide behavior from a macroscopic point of view rather than delay propagation per se. Specifically, we want to investigate the relationship between the ‘‘pressure” on air transport system and the degree and dynamics of the operational ‘‘deformations” that result.
3. Measurements of performance and network resilience
To the best of our knowledge,there is no common metric of air transport network resilience. Delay and punctuality are the two commonly indicators of system performance in resilience studies of transportation system.34In the air transport system,large flight delays or low punctuality indicate poor performance of the system. Therefore, we introduce the following four metrics to quantify air transport system performance:airport departure delay,System-Wide Delay(SWD),punctuality,and General Resilience Index (GRI).
3.1. Airport departure delay
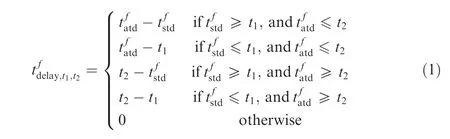
Normally,departure delay of a flight f is calculated by the time difference between its actual departure timeand its schedule departure time.However,there is no universally recognized method to measure departure delay in an airport in a given time period [t1,t2]. Here, we adopt the following definition.First, determine non-negative delay time of each single flight in [t1,t2] by

3.2. System wide delay
To directly represent the demand and supply of the airport over time, Liu et al.35,36proposed a method based on queuing diagram of airport flight departures (a similar figure could be constructed for arrivals). We use this method to propose a measure of delay for the whole air transport system.The queuing diagram for system departure (or arrival) flights is shown in Fig. 2. The blue line represents the scheduled cumulative demands,S(t ), with the slope indicating schedule demand rate of the system. It can be constructed by determining, for any time t, the number of flights that are scheduled to depart by time t across all the airports in the system. The red line shows the actual cumulative departures, A(t ), which is obtained by determining, for any time t, the number of departures that have actually taken place.Its slope reflects the throughput rate of the system, a measure of supply. At the beginning of the operating day, the two curves almost overlap until time T1,which suggests a balance between supply and demand. From time T1to T2,the actual supply rate decreases because of some disturbance, causing an imbalance between supply and demand.After time T2the system starts to recover,and supply rate exceeds the demand rate within a short time. Eventually,the actual cumulative departure curve again overlaps scheduled cumulative demand curve, which indicates the system has recovered.
For a given cumulative value n the horizontal difference between the two curves measures the time difference between when the nth departure was scheduled to occur and when the nth departure actually occurred. (If the flight order of scheduled and actual departures match, it is also the delay for the nth flight.) The total SWD can be obtained by summing these differences across all values of n. This is the same as the area between scheduled cumulative demand curve and actual cumulative departure curve,which is highlighted by the striped area in Fig. 2. Thus SWD can be calculated as:
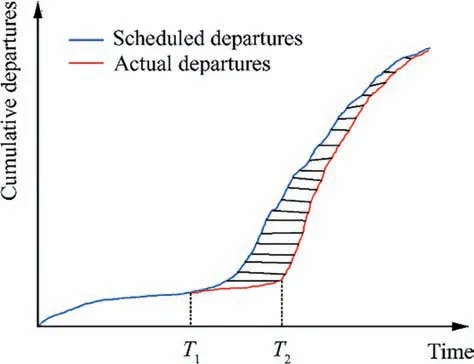
Fig.2 Queuing diagram of the departure flights of entire system.
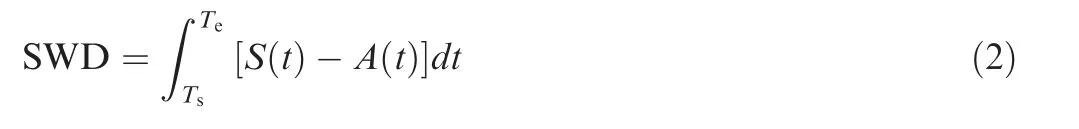
where S( t ) is the scheduled cumulative demand, A(t ) is the actual cumulative supply, Tsis the initial time of the flight schedule and Teis the time when the last flight actually departs.
3.3. Punctuality
Here we use departure punctuality as another measure of system performance. Let Ft1,t2be the set of the flights which are scheduled to depart in the time period [t1,t2], Nschedule,t1,t2be the total number of flights in the set,Nschedule,t1,t2be the number of flights in the set whose departure delay is less than 15 minutes. Departure punctuality is then defined as

3.4. General resilience index (GRI)
In Ref.16,a general resilience indicator is proposed considering absorptive, adaptive, and restorative capability based on the evolution of system performance as shown in Fig.1.Similarly,here we define a General Resilience Index (GRI) for an air transport network as follows.
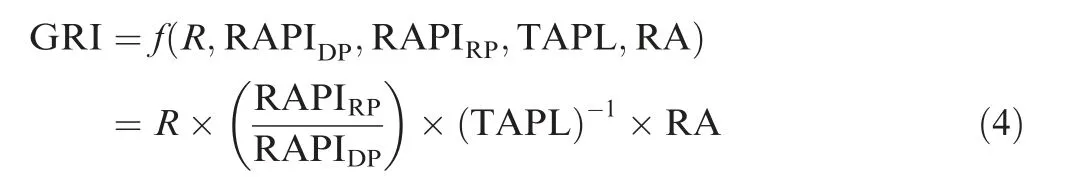
where R is the capability of the system to resist disruptions,i.e.the minimum performance of the system during the period of[td,tns] in Fig. 1. RAPIDPrefers to the rate of performance decline when disruptions occur and can be approximated by the average slope of the line in the disruptive state,i.e.between the time when negative impacts appear (td) and the time of recovery (tr). Similarly, RAPIRPdescribes the rate of system recovery which can be obtained as the slope of the line between time of recovery ((tr).) and the time when the system reaches the new steady state (tns).TAPL is the Time Average Performance Loss, i.e.,

where MOP stands for Measurement of Performance, which will be punctuality or airport flight delay in our study. Recalling that t0is the time when disruptive event(s)occur,Recovery Ability (RA) is defined as

4. Model
Building up on the previous work in Refs.37,38, we develop an agent-based model to investigate operational resilience of air transport network. The model takes daily flight schedules and airport capacity profiles as basic input. Traffic dynamics of the system is considered by incorporating aircraft rotation in the airports and the growth and dissipation of queues. In the following,we describe the general framework of the model and its key elements and mechanisms.
The overall framework of the model is depicted in Fig.3.It should be mentioned that detailed model in each part can be further developed. For example, the turnaround time can be further modeled with taxiing, deboarding, boarding, etc.
Each flight is carried out by an aircraft with a unique identification number (i.e. tail number). An aircraft usually has to fulfill several flights during a daily operation.The properties of a flight record include flight number,scheduled departure/arrival airports, scheduled departure/arrival times, estimated departure/arrival times,actual departure/arrival times,and tail number.Once the preceding flight has landed at its destination airport, the successor flight’s status is changed to turnaround.Once the turnaround procedure is completed, the flight will request to enter departure queue.
In our model, we simplify an airport as a single/multiple runways system. An airport runway may have various operation modes.For example,Shanghai Pudong International Airport has three runways operating simultaneously, with one runway only used for departures, one used for arrivals, and the third one used for both.The main goal of the airport agent is to compute and determine takeoff and landing times. The airport agent consists of three subagents, namely departure runway agent,arrival runway agent,and mixed runway agent.When a flight completes its turnaround procedure and requests for departure, airport agent will assign it to a runway agent together with a departure slot through the interactions with three subagents.
Flight delay propagates through the airport network. The flying timeof aircraft i between airport a and b not only depends on aircraft performance but also differs from airline to airline.Seasonal wind is a major factor affecting flying time as well. In our model, we generate the distributions of flying times of the same aircraft type of an airline between each given airport pair from an empirical dataset.
The model was calibrated and validated using one month of historical data of China’s air traffic network. The data contains 358695 flights operated in 251 airports mainland China in May, 2017, providing a comprehensive picture of air transport in China. Each flight record reports the flight number,execute date, scheduled/actual departure (arrival) airport,schedule/actual departure (arrival) time, and the unique aircraft registration number (tail number). Such data allows us to easily reconstruct the path of each aircraft flying in the network.To evaluate the performance of our model,we compare the simulated airports’ operations and the actual operational data. Fig. 4 plots both actual and simulated flights operations and delay in the whole network as well as a single airport, for an arbitrarily chosen date.As can be seen from the figures,our model provides a good macroscopic approximation of the actual operation of the air transport system. In addition, our model is fast - the computational time of simulating 24 hours of operations at 251 airports is less than 2 minutes.It is therefore suitable for the analysis of air transport system resilience.

Fig.3 Framework of simulation model.
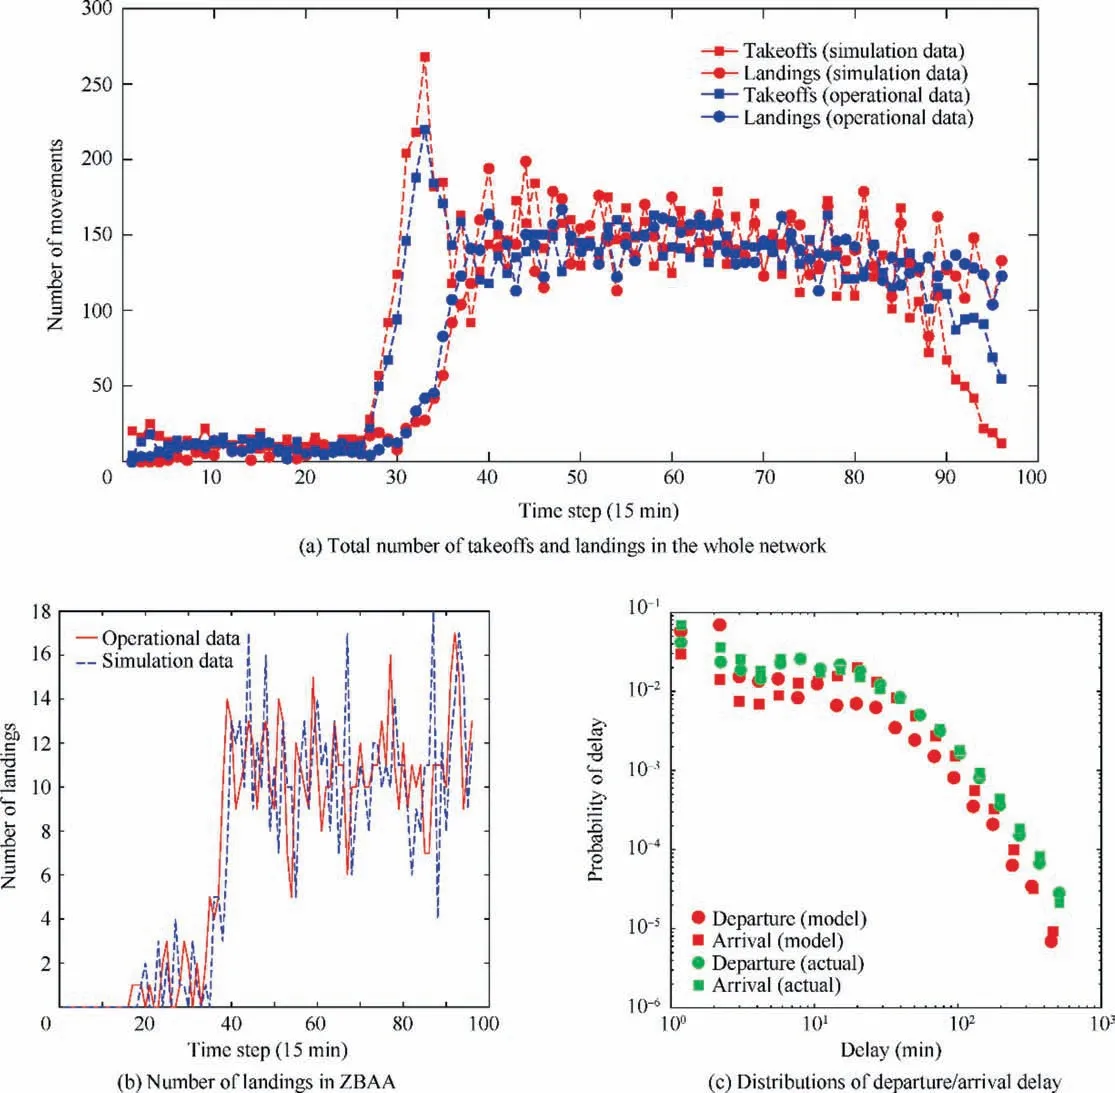
Fig.4 Comparison between simulation results and operational data.
5. Results
5.1. Impact of random disruptions in the network
To investigate the impact of randomly occurring disruptions to the air transport network, disruptive events are simulated by decreasing airport capacities. In the simulations presented in this section, disruptive events randomly occur in a certain number of airports. We mainly test two factors related to the disruptions: the scale of disruption which is captured by the number of airports under disruption (Nd), and the intensity of disruptive event, which is captured by increased required headway between two consecutive aircraft that are departing/-landing on the runway (Ts). The time periods of disruptive events are set during daily peak hours to intensify the impact.According to the hourly traffic distribution,the departure peak hours are between 08:00 and 10:00, and the peak hours for departures and arrivals combined are between 14:00 and 16:00.In each scenario,we randomly choose a certain number of airports to be disrupted airports and decrease their capacities during the two time periods identified above. A Monte Carlo simulation method was used to simulate each scenario 100 times.The flight data of a typical day,05/28/2017 was used for the baseline flight schedule and itineraries.Elements of randomness in the Monte Carlo simulation include flight times,turn-around times, runway configurations, all of which are drawn from empirical distributions, and the set of airports to be disrupted.
The impact of disruptive events on the air transport system is summarized in Fig. 5. We present the results for two sets of experiments.In the first set,we fix the intensity of disruption at a constant level - the minimum headway of affected airports during periods of disruption is set to 10 minutes, and we change the number of disrupted airports. The results are plotted in Figs. 5(a) and (b). Different colors represent different numbers of disrupted airports. In the second set of experiments,we set the scale of disruption as a constant-30 airports are disrupted-and vary the intensity of disruption. The results are presented in Figs.5(c)and(d),where different colors stand for different intensities of disruption.
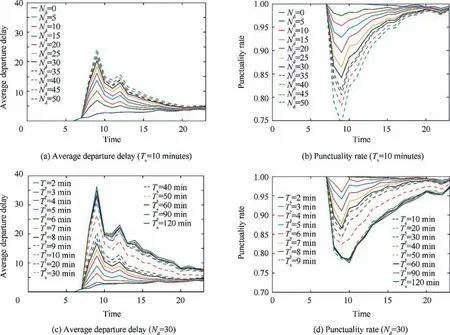
Fig.5 Average delay and punctuality (disruption period 08:00-10:00).
It is observed that both the scale and the intensity of disruptions affect the severity of performance degradation and the time to recover.As shown in Figs.5(a)and(b),when the number of airports under disruption becomes larger,the departure delay increases, the punctuality drops, and both slowly return to the normal condition.A similar trend is observed in Figs.5(c) and (d) when minimum headway is increased. Note that in the latter case, additional departure delay persists through midnight,although it will eventually clear sometime after that.
Another observation is that the performance degradation is more sensitive when the scale and the intensity of disruption are relatively small.After the scale and the intensity of disruption reach some threshold,the marginal performance degradation is very small. We observe that (A) there is not much difference either in flight delay or punctuality when the number of airports under disruption exceeds 30(see Figs.5(a)and b));(B) departure delay and punctuality reach theirs limits when runway separation is bigger than 30 minutes, as shown in Figs. 5(c) and (d).
As can be seen from Figs. 5(a) and (c), departure delay increases rapidly when the disruption starts at 08:00, and reaches its peak in the hour between 09:00 and 10:00. Afterwards, delay decreases as the disruption dissipates. Closer inspection reveals the second peak between 12:00 and 13:00.We checked the flying times between most Chinese cities,and they can be described as lognormal distribution:

With μ=4.87,σ=0.32, which means that typical flying times between Chinese cities are around 130 minutes. Adding the required ground turnaround time for an aircraft between its arrival and next departure, the scheduled departure time for a flight of an airframe whose first departure is around 08:00 should be around about 12:00. However, these flights were delayed. That is the reason for the second peak between 12:00 and 13:00 in the figure.
Figs.5(b)and(d)show the punctuality of air transport system. In the normal operation scenario, the punctuality approaches 1.0,while in the disruptive scenarios,the punctuality declines quickly as the number of disrupted airports increases.In the recovery stages, the rate at which punctuality recovers increases with the number of disrupted airports.However, as the number of disrupted airports increases, it takes longer time to return to any level of punctuality that might be deemed acceptable(for example 0.9).Under the more severe disruptions, the punctuality level has still not recovered by midnight.
We compute the General Resilience Indicator (GRI) to jointly compare the effect of disruption scale (number of airports under disruption) and disruption intensity (minimum headway between flights).In each disruption scenario,theoretical runway capacity is calculated based on the minimum headway between flights. An average GRI is then obtained. As shown in Fig. 6, GRI decreases with an increasing number of airports under disruption or a decreasing runway capacity(i.e. increasing minimum headway). The change is more sensitive to the changes in runway separation than the number of airports under disruption.

Fig.6 General resilience indicator of air transport network.
One of our aims is to understand the degree of disruption that an air transport network can stand. The GRI graph(Fig. 6) helps to answer this. Clearly, there are three different states that air transport system undergoes when increasing the disruption intensity or scale. During State I, the resilience of the system drops quickly when either runway capacity decreases or the number of disturbed airports increases.When averaged runway capacity is down to 11-12 aircraft per hour,or the number of affected airports is over 35,the whole system reaches to State II. Interestingly, we find that lower bound of air transport system resilience (State III in the Fig. 6). The dark blue area (runway separation >20 mins and number of airports under disruption >30) in the GRI graph is where the system reaches its resilience limit. Any disruption larger or more severe than that will make it difficult for the system recover.
5.2. Network measures and operational indicators for resilience
The second objective of this study is to identify airports whose operation has significant impact on the performance of the whole network. We rank the airports by network topological indicators, compute their operational indicators for resilience,and then compare these two indicators to see if airports that are important by topological indicators have a large impact on network resilience.
In network studies, topological indicators such as degree,Betweenness Centrality (BC), closeness, and H-index are used to measure the importance of nodes.Nodes that are ranked on the top of the list measured by these topological indicators are considered important nodes, and networks can be severely damaged when these nodes fail or are removed. The degree of a node is defined as the number of the neighbor nodes(i.e. directly connected nodes) that it has. It is the most intuitive and basic measure of interactivity of a node with other nodes in the network.The BC of a node is defined as the number node pairs whose shortest paths pass through this node.Closeness is obtained as the sum of the length of the shortest paths between the node and all other nodes in the network.H-index is proposed in complex networks by Hirsch in 2005 to evaluate the scholars’ academic achievements,39and has recently been found to be another important structural index to measure the importance of a node.30The H-index of a node in a network is defined has the largest value h such that thenode has at least h adjacent nodes of degree not less than h.Table 1 lists topological indicators of 20 airports in mainland China.
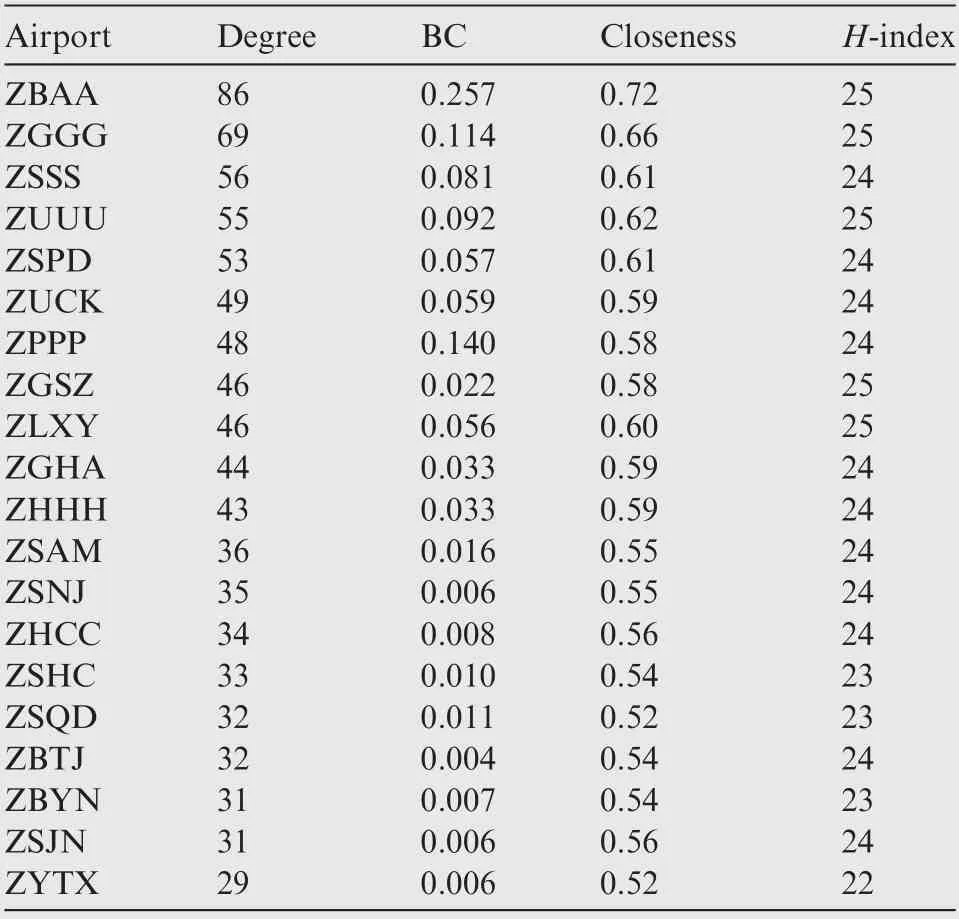
Table 1 Topological measures of top 20 airports in China mainland.
To examine the importance of an airport, we selectively decrease the airport’s capacity by increasing minimum headway to [10, 20, 30, 40, 50, 60] minutes. System Wide Delay(SWD) is calculated based on the description in Section 3. In order to intuitively show the correlation between node topological and operational indicators, we sort SWD according to the node’s network topological value (see Fig. 7).
Since the abscissas in Fig.7 are ordered by topological indicators of airport importance,a given plot should be monotonically decreasing if its associated topological indicator is perfectly correlated with the impact of a disruption on network performance. As shown in Fig. 7(a), for the five airports with the highest degree(ZBAA,ZGGG,ZSSS,ZUUU,ZSPD),the SWD increases as the degree increases.The curves show a general trend of ‘‘low left and high right”, but there exist many‘‘jump points”whose SWD is bigger than that of the next airport to its right, which has a higher topological indicator value. If an airport is associated with a ‘‘jump point,” it is more important based on the operational performance metric than it is with respect to degree.More‘‘jump points”appear in Fig.7(b)which plots SWD in order of airport betweenness.In Fig.7(d),we sort airports by H-index first then by SWD if the airports have same H-index. As shown in Fig. 7(d), jump points are different from the ones ranked by degree,closeness,and betweenness, but still exist. Degree, closeness, betweenness, and H-index all show similar patterns. Although the nodes with high values of topological indicators are critical to network connectivity, none of the indicators can be used to reliably assess airport importance in terms of operational impact of a disruption.
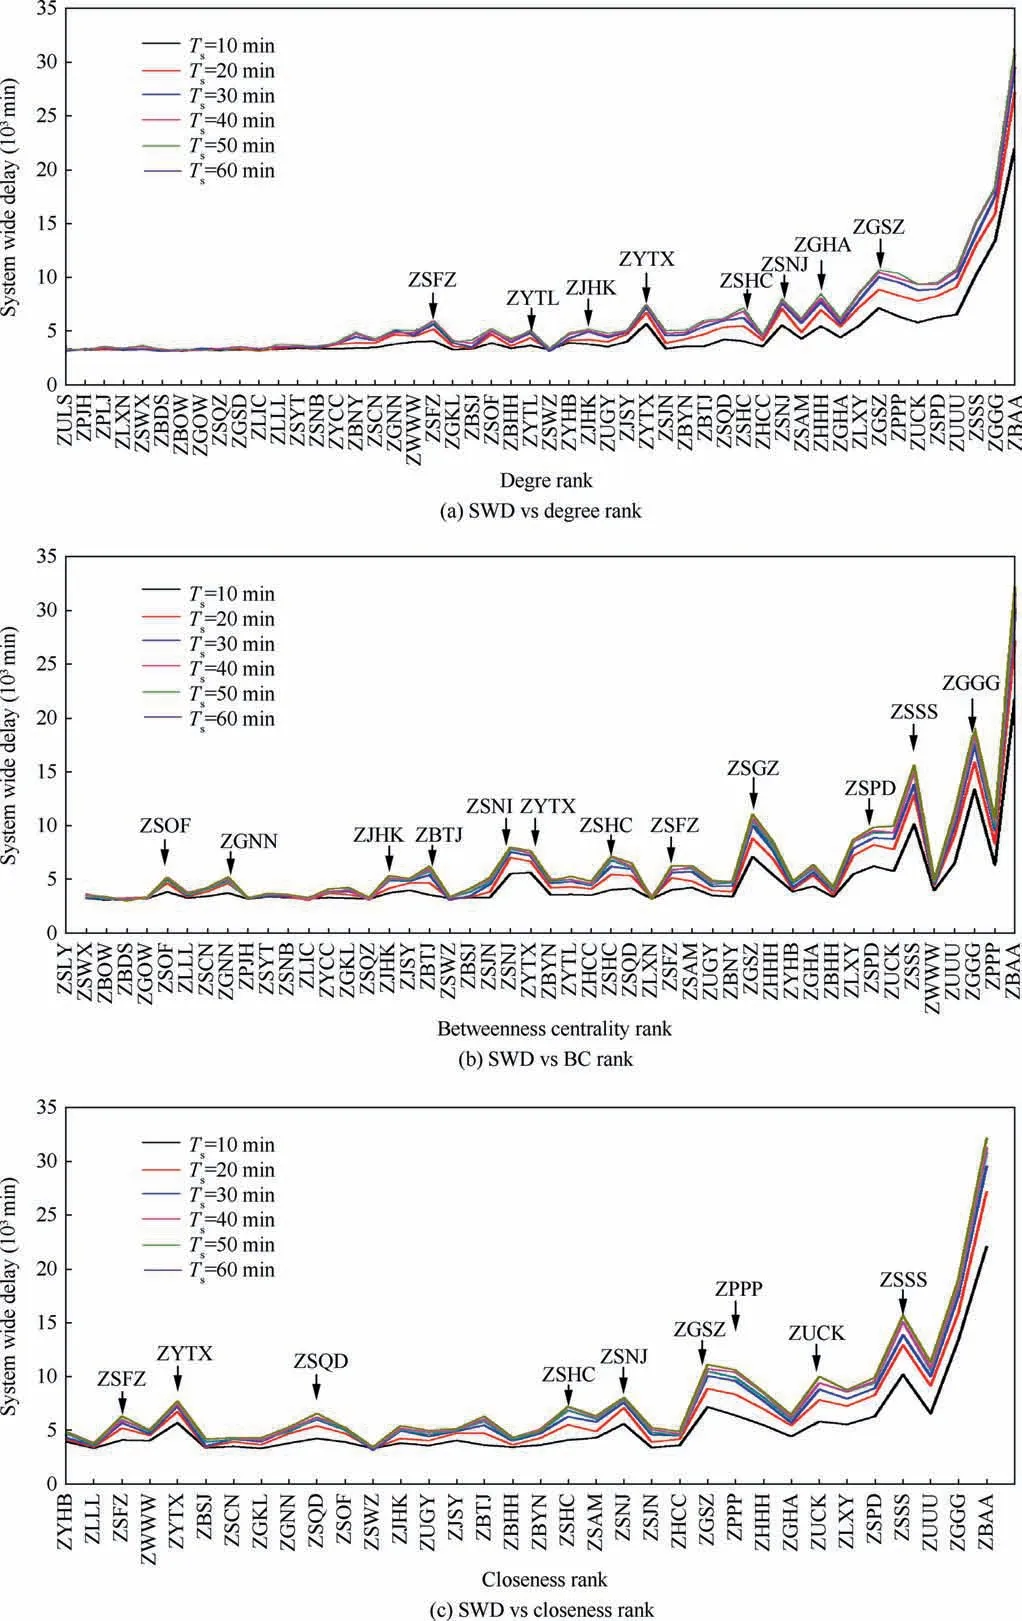
Fig.7 Performance of airport network when an airport is disrupted.
In addition to the topological indicators,gross measures of airport activity, such as the number of flight operations, may capture the importance of an airport in terms of operational disruption.Fig.7(e)shows SWD sorted by the number of daily flights. From the perspective of SWD, Fig. 7(e) shows fewer and smaller jump points suggesting that the number of flights is an important driver operational impact of airports. This is further confirmed by the Spearman correlation analysis between structural indicators and operation performance at the end of this section(see Fig.8).However,some jump points remain in Fig. 7(e), implying that that the number of flights is also not a perfect predictor of operational impact of an airport disruption.Other factors,including topological indicators considered above as well as metrics related to aircraft connectivity,may also play a role.

Fig.7 (continued)

Fig.8 Spearman’s rank correlations between structural indicators and operational measures.
We take a closer look at the ‘‘jump” airports in Fig. 7.Fig. 9 shows the locations of jumps in the whole air transport network. The colors of the circle indicate the frequency of jumps. ZYTX (Shenyang Taoxian International Airport) and ZSFZ(Fuzhou Changle International Airport)are the two airports that appear as jumps irrespective of which metric is used for sorting. This suggests that no readily available topological or activity measure can completely account for the importance of ZYTX and ZSFZ airports in terms of the operational impact of a capacity reduction: these airports are more operationally significant than any of these indicators suggest. ZPPP(Kunming Changshui International Airport), ZSNJ (Nanjing Lukou International Airport), ZSHC (Hangzhou Xiaoshan International Airport) appeared four times as jump points.Among these, the results for ZPPP are the most readily explainable: this airport has the second highest betweenness of the airports in the Chinese network, that is, the number of shortest paths through ZPPP in the network is relatively large. Therefore, the average travel time of the network will be greatly increased if ZPPP is disrupted,but the system delay impact is not necessarily large. System wide operation managers should take precautions if the capacity of these‘‘jumping airports” drops.

Fig.9 Frequency of jumps in the five sorting strategies.
We further analyze the correlation between topological and activity indicators and operational resilience measures through Spearman’s rank correlation coefficient. The ranking of airports by topological indicators is compared with the ranking of airports by SWD. The Spearman’s rank correlation coefficient assesses how similar two rankings are - a high value means the rankings are similar,while a low value indicates dissimilarity. The results are shown in Fig. 8. Apart from traffic volume rank, degree and H-index are the two indicators that have the highest correlations with the operational impact measures. BC is the least predictive indicator of the operational importance of nodes. None of the topological indicators has a high a rank correlation with SWD impact as traffic volume.This reinforces the finding that the operational importance of airports is best predicted by traffic volume.Fig.8 also suggests that, in general, SWD rank correlations with operational impact are highest when the disruption is most severe.
6. Conclusions
The resilience of the air traffic network should be an important consideration in the design and management of air transport systems. Limited studies have been carried out to assess the resilience of the air traffic network considering the impact of disruptive events on air traffic operations. In this paper, we developed a number of operational resilience measures, and used them to assess the resilience of the air traffic network in China via simulation studies. Critical airports which have significant influence on the performance of whole system are identified. We also compared the operational resilience measures with the network topological indicators which are commonly used in existing studies of air traffic network robustness and reliability.
Our simulation study captures key aspects of the process of how temporary capacity reductions disrupt the air transport system - from the original steady state to the disrupted state,the recovery state,and finally stabilizing at a new steady state.In addition, we explored the impact of two disruption factors on system resilience: the disruption scale (measured by the number of airports under disruption)and the disruption intensity (measured by minimum headway between flight operations). Both have a direct impact on the severity of system performance degradation and the time to recover. The marginal effect of these two factors becomes small when the system is approaching the limit of disruption tolerance. This could mean that as the two factors approach these limits,the system is driven to a state from which it cannot recover,or from which recovery would take a very long time. However, further work is required to develop a model that faithfully captures the mechanisms by which the air traffic network reaches this state.
Our simulation model captures how the disruption at a given airport affects operations throughout the network.There is considerable variation among airports in the severity of this systemic impact. While topological measures such as degree and H-index are somewhat predictive of the impact of a disruption, the single best predictor and is also the simplest: the flight traffic volume at the airport. This challenges the use of complex network theory as a basis for assessing resilience in the context of air transport networks. However, there are a few airports, such as ZYTX and ZSFZ, at which operational disruptions have large systemic impacts that are not explained by any of the topological or activity measures that have been considered. Future research should explore whether there are other measures which, either individually or in combination,could account for these impacts.
Although our study provides insights into the operational resilience of air traffic network, it has several limitations.The simulation scenarios could be enriched to consider more factors, such as baseline condition of the system, time of disruptive events,particular clusters of airports under disruption,etc. Also, the findings are not verified by real-world operational data.If one could collect empirical data of air traffic network undergoing disruptive events, and analyze the response of the air transport system in these natural experiments, our findings could be further validated.
Future work will investigate strategies to improve the resilience of air traffic network.Optimization tools can be built to design the network, flight schedules, and mitigation strategies,such as flight cancellations,aircraft swaps,and traffic management initiatives, in order to better contain the operational impact of airport disruptions, and thus improve the resilience of the air transport networks.
Acknowledgments
This research was supported by the National Natural Science Foundation of China (Nos. 61773203, U1833126, 61304190),the Open Funds of Graduate Innovation Base (Lab) of Nanjing University of Aeronautics and Astronautics of China(No. kfjj20180703), the State Key Laboratory of Air Traffic Management System and Technology of China (No.SKLATM201707), and the Hong Kong Research Grant Council General Research Fund of China (No. 11209717).
杂志排行

CHINESE JOURNAL OF AERONAUTICS的其它文章
- Fracture behavior and self-sharpening mechanisms of polycrystalline cubic boron nitride in grinding based on cohesive element method
- A CFD-based numerical virtual flight simulator and its application in control law design of a maneuverable missile model
- A formal approach using SysML for capturing functional requirements in avionics domain
- Target-enclosing aきne formation control of two-layer networked spacecraft with collision avoidance
- Distributed intelligent self-organized mission planning of multi-UAV for dynamic targets cooperative search-attack
- Design and analysis of a truss deployable antenna mechanism based on a 3UU-3URU unit