Influence of common feature points distribution on uncertainty of 3D coordinate transformation parameter estimation
2019-11-20ZHUChengguangZHAOJiankangLONGhaihuiXIAXuanWANGHongyu
ZHU Chengguang,ZHAO Jiankang,LONG haihui,XIA Xuan,WANG Hongyu
(1.School of Electronic and Electrical Engineering,Shanghai Jiao Tong University,Shanghai 200240,China; 2.Shenzhen Institute of Advanced Technology,Chinese Academy of sciences,Shenzhen 518000,China)
Abstract: Measurement precision and relative geometric distribution of common feature points are two factors affecting the parameter estimation and then the visual navigation precision.In view that the relative geometric distribution is easier to be adjusted than the measurement precision,the influence of the relative geometric distribution on the estimation accuracy of translation and rotation parameters is only discussed.Firstly,the nonlinear model and the weighted global least square algorithm are used to solve transformation parameters,and Monte Carlo method is used to summarize the influence of different feature points distribution on parameter estimation accuracy.Then,a method of reconstructing cofactor matrix is proposed,which quantifies the dispersion of coordinate point distribution as its weight for engineering application.Finally,comparison tests are carried out based on actual measurement data,which shows that the proposed method can improve the estimation accuracy of parameters without prior knowledge,where the posterior standard deviation of transformation parameters is reduced by at least 6.7%.
Key words: 3D coordinate transformation; uncertainty; weighted total least square; Monte Carlo method
Estimating the relative relationship between two coordinate frames based on two sets of points with correspondence is applied widely in such areas as photo- grammetry,robotics,object motion analysis,relating a camera coordinate system to others,as well as estimating the position and orientation of a recognized object (pose estimation)[1-2].What is worth mentioning is that it is the same with the issue above to use two groups of 3D feature points,randomly recognized,extracted and correctly matched with the rapid development of visual navigation technology,to estimate relative pose between two spacecraft.The feasibility of estimating the relative state between a satellite and another object based on stereo vision has been verified as well[3-6].Apparently,analyzing the factors which affect the uncertainty level of estimated parameters is supposed to be given considerable attention.
It is necessary to assess the precision of algorithms proposed in literatures,but there are few articles to analyze the influence of common points' layout on the precision of parameters estimation.In other words,scant attention was paid to the influence of layout of common points on the uncertainty of estimated parameters[7].Especially,the layout of common points exploited to estimate the relative relationship has an influence on the transformation uncertainty of output coordinates[7-8].The influence of distortions in coordinates on estimation parameters was quantified by a quality measure “reliabi- lity”[9].Two local applications have been also utilized to demonstrate this conclusion.However,general conclu- sion was not exploited to support practical applications further.Despite all this,there are few literatures to study the impact of common points' layout on the uncertainty of estimated parameters.The target of transformation com- putation is to determine the precise parameters so that the users from all related disciplines can utilize them without any doubt or concern.Therefore,this paper primarily focuses on the impact analysis of common points' layout on parameters precision.
Since the issue to estimate the relative relationship can be regarded as an algorithm to seek optimal solution based on two sets of common points with correspond- dence,seven parameters,consisting of Euler angles,scale factor and translation vector,is used to connect the two sets of common points.In addition,compared with the GMM (Gauss-Markov model),the EIV (errors-in- variables) takes the random errors in coefficient matrix into conside- ration.Hence,the latter is often employed to express this transformation relationship.What's more,the rotation angle of different magnitudes leads to different model algorithms.Aimed at the small rotation angle,the Bursa-Wolf model and the Molodensky model are often applied directly.The combination of interme- diate rotation matrix and Bursa-Wolf model was adopted to build the relation- ship between two sets of common points for rotation angles of arbitrary magnitude.
The difference between WTLS (weighted total least square) and LS (least square) mainly depends on whether the coefficient matrix connecting the parameters and observation vectors are contaminated by random errors.Since this nonlinear issue is complicated,numerous algorithms are developed.The detailed development of WTLS algorithm can be seen in literature [10].Four major algorithms designed to obtain closed form solution are compared in terms of robustness,accuracy and stability.In order to improve the precision of algorithms above,many literatures have proposed improvements to algorithms[11-12].For analyzing the layout impact on estimated parameters,the WTLS algorithm proposed in the reference will be adopted herein.
The covariance matrix of the estimated parameters is derived to express the uncertainty level of the esti- mated parameters based on the algorithm[12].A series of simulation experiments will be designed based on the Monte Carlo method[13-14].These experiments show that the layout of a set of common points has an influence on the parameters uncertainty.The standardized distance is regarded as weights of 3D coordinate points.In order to verify the effectiveness and feasibility of this theory,two contrast experiments are conducted.The results indicate that the novel method to rebuild the covariance matrix can improve the estimation precision.
1 Algorithm for parameter estimation
For the sake of integrity and convenience,some preconditions and notations will be introduced in advance.The source and target coordinate frames are denoted byandrespectively,both of which are of the Cartesian coordinates.The seven parameters,forging the relationship between them,consist of Euler anglesφ,θ,ψ,scale factorμ,and translation vectorτ=[ Δx,Δy,Δz]T.T denotes the transpose operation of a matrix or vector,andRis the rotation matrix with rotation order 1-2-3[15].
1.1 Weighted total least square algorithm
Since observation data are inevitably contaminated by random errors,the EIV model is selected to character- rize the connection between estimated parameters and observation vector conceptually as follows.

Obviously,Eq.(1) is the non-linear vector function,refined with implicit function as follows:

whereξ=[ Δx,Δy,Δz,μ,φ,θ,ψ]Tmeans the 7 parameters estimated based onNcommon points (i.e.,Nis no less than three),andisthe implicit vector function with dimensionm.The constraint Eq.(2) can be rewritten as follows:


According to the WTLS algorithm,the target func- tion can be represented by Eq.(5):
For clarity,the iterative process of algorithm is briefly introduced below.Let's do Taylor series expansion for the right-hand members of Eq.(3) at


Therefore,Eq.(5) will be reorganized further based on Lagrange objective function as follows:

To solve the target function above,the partial derivative of Eq.(5) with respect tois set as zero.The detailed procedure to solve it,which can be referred to in the reference [12],needn't be repeated herein.It is worth noting that the matrices should be updated at each step,and an appropriate threshold value is selected and set to stop the iteration,e.g.,
The posterior variance factor and the covariance ma- trix of the estimated parameters can be estimated as follows:

1.2 Uncertainty analysis
From the Eq.(8) and Eq.(9),the covariance matrix ofdepends not only on the measurement precision of common points,but also on coordinates (layout) thereof.

The overall uncertainty of estimated parameters is represented numerically in Eq.(10) by the trace of covari- ance matrix of estimated parameters[7,16],which indicates the same conclusion above as well.In other words,the uncertainty level in the whole measurement volume is not homogeneous.In practice,the measurement uncer- tainty is inevitable in obtaining observation points.However,the layout of common points might be adjusted or selected based on individual influence on the esti- mated parameters.It is of vital importance to study the layout to seek the optimal solution.Hence,the issue that layouts of points improve the uncertainty of parameters will be discussed hereafter.
2 Simulation for influence of layout
According to the analysis in the section above,the posterior variance component,which contains the random errors of coordinates in bothand,measure- ment uncertainty of coordinates,and the derivative ofφwith respect toe,is a scalar.What's more,the deriva- tive ofφwith respect toξcontains common points viewed from the.In practical application,the uncertainty of common points can't be reduced once the observation data are obtained.Clearly,it is meaningful to pay sufficient attention to the layout influence on the uncertainty of estimated parameters herein.Hence,four schemes will be designed to study it.
In general,it is recommended to select 6 to 10 common points to estimate parameters in practical appli- cation.Without losing generality,6 common coordinates with varying layout are set to solve them based on Eq.(7).It is also assumed that the random errors of common points are subject to the normal distribution as follows:

whereσe=0.0001 m.
The complexity to analyze the issue in theory makes it necessary for the Monte Carlo method with 105runs to be utilized to guarantee the reliability of experimental results.The layouts to scatter the common points in the coordinate framefor three schemes are represented in Fig.1(a).Correspondingly,common points resolved inare transformed by the true 7 parametersT(ξ) repre- sented in the last row of Table 1.

Tab.1 Monte Carlo simulations for three schemes
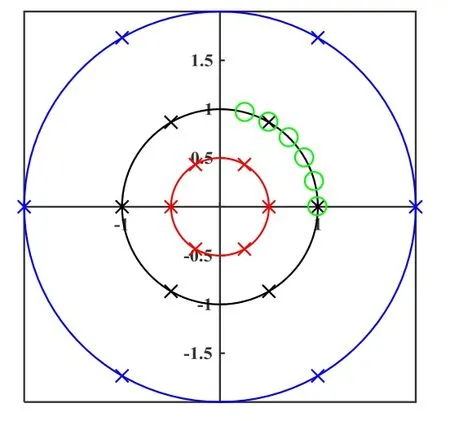
Fig.1(a) Distribution of common points in three schemes.The black cross denotes the points in scheme I,and green circles the points in scheme II

Fig.1(c) The standard deviation of scale factor varied with the radius,ranging from 0.5 m to 2 m

Fig.1(b) The standard deviation of Euler angles varied with the radius,ranging from 0.5 m to 2 m

Fig.1(d) The standard deviation of components of translation vector varied with the radius,ranging from 0.5 m to 2 m
Six common points are distributed on the circle with a radius 1 m in scheme I,with the coordinates of starting point being [1,0,0]T,and just on the first quadrant of circle with a radius 0.5 m in scheme II.It is the combina- tion of scheme I and scheme II that is adopted in scheme III,but this scheme contains only 10 common points without repeated points.All schemes are shown in Fig.1(a).
In Table 1,E(ξ)denotes the expectation ofξ,namely,the mean value of all the simulation results; std(ξ) represents the standard deviation ofξ.
The simulation results have been shown in Table 1,and three conclusions are reached as follows:
1) While the same number is used to solve the optimal parameters,more dispersed distribution of points will lead to smaller uncertainty by comparing scheme I and scheme II;
2) If scheme I is regarded as the reference,scheme III fails to improve the precision obviously.In other words,the points defined in scheme I contribute more than those in scheme II in terms of estimation precision;
3) When the uncertainty level of coordinates is fixed,the increase in the number of common points leads to the reduction of uncertainty to some extent.

Tab.2 Procedure of generating weights of common points
In order to dig deeper,scheme IV is designed based on scheme I.Six common points are uniformly distributed in a series of circles,the radius of which varies from 0.5 m to 2 m,with an interval of 0.1 m.In particular,the common points distributed in circles with radius 0.5 m,1 m,and 2 m are shown concisely in Fig.1(a).The simulation conditions for this scheme are the same as those for simulation experiments above except forσe=0.01 m.The experimental results are represented in Fig.1(b)~(d).
Obviously,the standard deviations of Euler angles and scale factor decrease with the increase of radius.In other words,when the uncertainty level of random errors does not change with the increase of radius,bigger disper- sion of common points will lead to smaller uncertainty of the estimated parameters.However,there is no trend to demonstrate the impact of dispersion of common points on the uncertainty level of translation parameters in Fig.1(d).

Tab.3 Data for contrast experiments

Tab.4 Results for contrast experiments
3 Contrast experiments
To utilize the above conclusion in practical applica- tion,the dispersion of common points should be quan- tified.In other words,a certain standard is supposed to be further exploited to assign the weight to each common point.A method is to be introduced about how the dispersion is quantified as the weight of the common points to rebuild the cofactor matrix in Eq.(4),which is of vital significance.
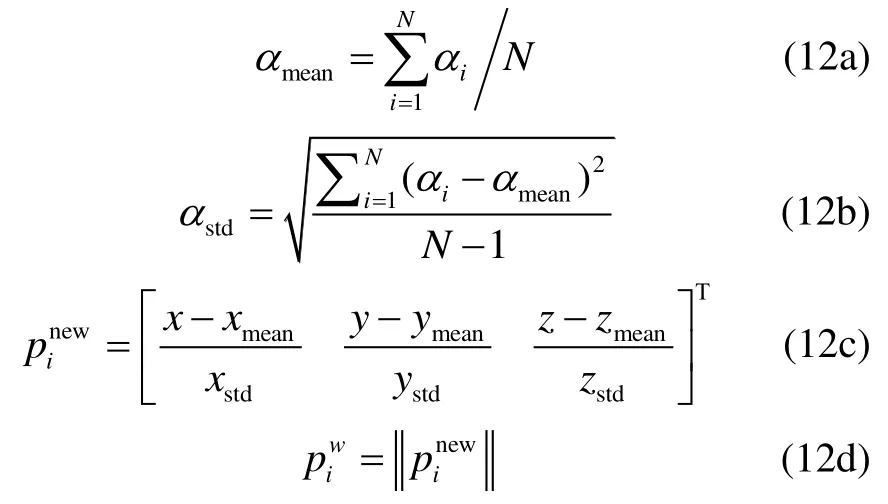
The steps to quantify the dispersion of common points can be described in Table 2.Meanwhile,Eq.(12) represents mathematically the method about how to calculate the weights of common points.To be brief,the possible values of variableαconsist ofx,y,zlike Eq.(11).αmeanexpresses the C.M.(center of mass) of some set of common points,αstdthe standard deviation of these common points,pinewtheith newly standardized common point,andpiwthe weight ofit hcommon point.
To verify the effectiveness and feasibility of the method,two contrast experiments will be carried out.The set of data stems from the literature [12] as shown in Table 3,which are also utilized to estimate the seven parameters based on the WTLS algorithm.The perfor- mances of two algorithms are listed in Table 4 with and without their newly rebuilt cofactor matrix.
According to the results shown in Table 4,the advantage of the new method is self-evident.For one thing,compared with the original algorithm,the uncer- tainty level of all estimated parameters is decreased ob- viously by more than 6.7% from 7thto 12thcolumn.For another,3thcolumn compared with 5thcolumn,7thcolumn with 9thcolumn,the errors of Euler angles and scale factor are smaller than those of the original algorithm,but the tr anslation vector fails to improve,for Δyin particular,which coincides with the conclusion in Section 3.
4 Conclusion
Aimed at the issue regarding the analysis of the uncertainty of estimated parameters in 3D coordinate transformation,the WTLS algorithm is adopted to solve the complicated problem.The covariance matrix of estimated parameters is derived to analyze the factors which impact the level of uncertainty.In order to analyze the impact of common points' layout on the uncertainty,the Monte Carlo method is exploited to generalize the conclusion conceptually.These simulation experiments show that bigger dispersion will lead to smaller uncer- tainty of parameters.In addition,taking into account the application of this theory to practice,it is necessary to quantify this standard used for the weights of common points.A novel method to rebuild the cofactor matrix of common points based on the new weights is proposed in this paper.Two kinds of algorithms are employed to verify this new algorithm,and contrast experiments show that this novel method for quantifying the weights and rebuilding the corresponding cofactor matrix can im- prove the performance of the algorithm.
