Chromosomal level assembly and population sequencing of the Chinese tree shrew genome
2019-10-31YuFanMaoSenYeJinYanZhangLingXuDanDanYuTianLeGuYuLinYaoJiaQiChenLongBaoLvPingZheng2DongDongWuGuoJieZhangYongGangYao
Yu Fan,Mao-Sen Ye,Jin-Yan Zhang,Ling Xu,Dan-Dan Yu,Tian-Le Gu,Yu-Lin Yao,Jia-Qi Chen,Long-Bao Lv,Ping Zheng2,3,,5,6,7,Dong-Dong Wu,Guo-Jie Zhang,Yong-Gang Yao,3,,5,*
1 Key Laboratory of Animal Models and Human Disease Mechanisms of the Chinese Academy of Sciences&Yunnan Province,Kunming Institute of Zoology,Chinese Academy of Sciences,Kunming Yunnan 650223,China
2 Center for Excellence in Animal Evolution and Genetics,Chinese Academy of Sciences,Kunming Yunnan 650223,China
3 Kunming College of Life Science,University of Chinese Academy of Sciences,Kunming Yunnan 650204,China
4 Kunming Primate Research Center of the Chinese Academy of Sciences,Kunming Institute of Zoology,Chinese Academy of Sciences,Kunming Yunnan 650223,China
5 KIZ-CUHK Joint Laboratory of Bioresources and Molecular Research in Common Diseases,Kunming Institute of Zoology,Chinese Academy of Sciences,Kunming Yunnan 650223,China
6 State Key Laboratory of Genetic Resources and Evolution,Kunming Institute of Zoology,Chinese Academy of Sciences,Kunming Yunnan 650223,China
7 Yunnan Key Laboratory of Animal Reproduction,Kunming Institute of Zoology,Chinese Academy of Sciences,Kunming Yunnan 650223,China
ABSTRACT Chinese tree shrews (Tupaia belangeri chinensis)have become an increasingly important experimental animal in biomedical research due to their close relationship to primates.An accurately sequenced and assembled genome is essential for understanding the genetic features and biology of this animal.In this study,we used long-read singlemolecule sequencing and high-throughput chromosome conformation capture (Hi-C)technology to obtain a high-quality chromosomescale scaffolding of the Chinese tree shrew genome.The new reference genome(KIZ version 2:TS_2.0)resolved problems in presently available tree shrew genomes and enabled accurate identification of large and complex repeat regions,gene structures,and species-specific genomic structural variants.In addition,by sequencing the genomes of six Chinese tree shrew individuals, we produced a comprehensive map of 12.8 M single nucleotide polymorphisms and confirmed that the major histocompatibility complex (MHC) loci and immunoglobulin gene family exhibited high nucleotide diversity in the tree shrew genome.We updated the tree shrew genome database(TreeshrewDB v2.0:http://www.treeshrewdb.org)to include the genome annotation information and genetic variations.The new high-quality reference genome of the Chinese tree shrew and the updated TreeshrewDB will facilitate the use of this animal in many different fields of research.
Keywords: Tupaia belangeri; Chromosomal level assembly genome;Population sequencing;Database
INTRODUCTION
Tree shrews (Tupaia belangeri) are widely distributed throughout South Asia,Southeast Asia(Fuchs&Corbach-Söhle,2010),and South and Southwest China(Peng et al.,1991).They possesses many unique characteristics that are useful in biomedical research models,such as small adult body size(100-150 g),easy and low cost maintenance,short reproductive cycle(~6 weeks),moderate life span(6-8 years),high brain-to-body mass ratio,and very close relationship to primates(Fan et al.,2013;Xiao et al.,2017;Xu et al.,2012;Yao,2017;Zheng et al.,2014).Hitherto,tree shrews have been used in a wide variety of studies,including research on viral infection(Amako et al.,2010;Guo et al.,2018;Kock et al.,2001;Li et al.,2014;Li et al.,2016;Yang et al.,2013),visual cortex function(Bosking et al.,2002;Lee et al.,2016;MacEvoy et al.,2009;Mooser et al.,2004;Veit et al.,2014),brain development and aging(Fan et al.,2018;Wei et al.,2017), and neuropsychiatric disorders induced by social stress (Fuchs, 2005; Meyer et al., 2001). Previously, we successfully sequenced the genome of the Chinese tree shrew(Tupaia belangeri chinensis)using Illumina short-read sequencing(KIZ version 1:TS_1.0)and showed their close relationship to non-human primates,thereby settling a longrunning debate regarding the phylogenetic position of tree shrews within eutherian mammals (Fan et al., 2013).Furthermore,to advance the use of the tree shrew genome,we developed a user-friendly tree shrew database(TreeshrewDB:www.treeshrewdb.org)(Fan et al.,2014).The successful genome sequencing(Fan et al.,2013)and genetic manipulation of tree shrews(Li et al.,2017)have opened up new avenues for the wide usage of this species in biomedical research(Yao,2017).
Accurate genome sequencing and assembly are essential for understanding phylogenetic relationships and genome and phenome evolution(Kronenberg et al.,2018).Despite the fact that short-read sequencing technologies remain the most popular methods used to generate high-throughput data at relatively low cost (Schatz et al., 2010), whole-genome assembly of mammalian genomes based on these older sequencing technologies contains many problems,including assembly gaps and incomplete gene models(Sohn&Nam,2018). For instance, approximately 50% of the human genome comprises non-random repeat elements(Cordaux&Batzer,2009)and a complex sequence structure,which is a major challenge in reference genome assembly(Phillippy et al.,2008).Although our earlier Chinese tree shrew genome(KIZ version 1:TS_1.0)produced in 2013(Fan et al.,2013)had high sequencing coverage(79x),the assembled genome still contained 223 607 gaps(including 65 222 gaps in the genic region),and thus did not fully meet research needs.Single-molecule sequencing technology can generate reads tens of kilobases in size and can span most repeat sequences, which allows for complete reference genome assembly(Bickhart et al.,2017;Chaisson et al.,2015).Highthroughput chromosome conformation capture (Hi-C)technology can be used to study the three-dimensional architecture of genomes and can order,orient,and anchor contigs into chromosome-scale scaffolds(Burton et al.,2013).Here,we applied both long-read single-molecule sequencing and Hi-C technology to obtain a new reference genome for the Chinese tree shrew. We also generated a single nucleotide polymorphism(SNP)map of the tree shrew by whole-genome sequencing of six individuals.We updated the TreeshrewDB v2.0 (http://www. treeshrewdb. org) to incorporate the new reference genome and population genetic variations.
MATERIALS AND METHODS
Tissue samples and genome sequencing
A male Chinese tree shrew from the Experimental Animal Center of the Kunming Institute of Zoology,Chinese Academy of Sciences,was used for single-molecule,real-time(SMRT)long-read sequencing (PacBio) and Hi-C sequencing. Ear tissues of six Chinese tree shrews were used for wholegenome sequencing using Illumina HiSeq X Ten(USA).This study was approved by the Institutional Review Board of the Kunming Institute of Zoology,Chinese Academy of Sciences(KIZ-SYDW-20101015-001 and KIZ-SMKX-20160315-001).
We generated long-insert (20-40 kb) genomic libraries based on standard SMRT sequencing protocols developed by Pacific Biosciences(PacBio).The libraries were sequenced using the PacBio RS II instrument with the P6-C4 sequencing reagent.Brain tissue from the same individual was used to construct the Hi-C libraries.Briefly,minced brain tissue was fixed in 2%formaldehyde for 10 min and then lysed in 2.5 mol/L glycine.Cross-linked genomic DNA was digested with Mbol(#B7024,New England Biolabs,UK).Sticky ends were filled with nucleotides,one of which was biotinylated.Ligation was performed under extremely dilute conditions favoring intramolecular ligation events:the Mbol site was lost and a NheI(#R3131,New England Biolabs,UK)site was created.DNA was purified and sheared, and biotinylated junctions were isolated using streptavidin beads.Interacting fragments were sequenced by Illumina HiSeq X Ten(USA).
For whole-genome sequencing of the six tree shrew individuals,short-insert read(300 bp)genomic libraries were constructed using the Illumina TruSeq Nano DNA Library Prep Kits(USA)and sequenced using the Illumina HiSeq X Ten(USA).
Genome assembly and quality evaluation
We applied Canu(Koren et al.,2017)to correct the SMRT reads, then used smartdenovo (https://github.com/ruanjue/smartdenovo)to perform de novo assembly.The assembly was error-corrected using Quiver(Chin et al.,2013)and Pilon(Walker et al.,2014)based on alignment of 30-fold Illumina paired-end reads.The Hi-C sequencing reads were aligned to the assembled contigs using the bowtie2 end-to-end algorithm(Langmead&Salzberg,2012).We used Lachesis(Burton et al.,2013)to cluster,order,and direct the assembled contigs onto 31 pseudo-chromosomes(TS_2.0 assembly),which was arbitrarily defined based on the number of haploid chromosomes of the tree shrew(Liu et al.,1989).A total of 4 104 benchmarking universal single-copy orthologs in the mammalian dataset of the Benchmarking with Universal Single-Copy Orthologs(BUSCO)(Simao et al.,2015)were mapped to the assembled contigs using tBlastn(Altschul et al.,1997)to assess overall assembly quality.We also used the whole-genome sequencing data of the male Chinese tree shrew to assess the quality of the TS_2.0 assembly.In brief,we aligned the reads to the TS_2.0 assembly and previous TS_1.0 assembly(Fan et al.,2013)using BWA(Li&Durbin,2009). We called genetic variants (SNPs and indels(insertions and deletions)) using FreeBayes (Garrison &Marth,2012)and the structural variants(SVs)using Lumpy-SV(Layer et al.,2014),respectively.The feature response curve(FRC)(Vezzi et al.,2012)was estimated based on the aligned reads. The quality value (QV) was calculated as described previously(Bickhart et al.,2017):
where,S indicates the cumulative length of all SNPs and indels identified using FreeBayes(Garrison&Marth,2012)that had a probability of being heterozygous greater than 0.5,and B indicates the number of base pairs in the assembly that had at least 3x sequencing coverage.
Annotation of repeats in genome
We employed Tandem Repeats Finder v4.09(Benson,1999)to annotate the tandem repeats in the TS_2.0 assembly.The transposable elements (TEs) were identified based on a combination of de novo and homology-based predictions,as described in our previous study(Fan et al.,2013).Briefly,the RepeatModeler(Chen,2004)was used to construct a de novo repeat library. We used RepeatMasker and RepeatProteinMask(Chen,2004)to identify different types of TEs by aligning the TS_2.0 assembly with the known RepBase library(Chen,2004)and the constructed de novo repeat library.
Gene prediction and annotation
A total of 13 RNA-seq datasets from our previous studies(Fan et al.,2013,2018)were cleaned using Trimmomatic(Bolger et al.,2014),then aligned to the TS_2.0 assembly using Tophat2(Kim et al.,2013).The cleaned reads were also de novo assembled using Trinity(Grabherr et al.,2011).The above RNA-seq assemblies were further combined using PASA(Haas et al.,2008).
For homology-based gene prediction, we downloaded protein sequences of humans(Homo sapiens),chimpanzees(Pan troglodytes),macaques(Macaca mulatta)and mice(Mus musculus)from Ensembl(release 71;https://asia.ensembl.org/index.html),which display more accurate annotation of gene models.These protein sequences were mapped to the TS_2.0 assembly using TblastN (Altschul et al., 1997). GeneWise(Birney et al.,2004)was used to define gene models.For ab initio gene prediction, Augustus (Stanke & Waack, 2003),Genescan(Salamov&Solovyev,2000),SNAP(Korf,2004),and GeneMark(Besemer&Borodovsky,2005)were used to predict coding genes.
We employed EVidenceModeler (Haas et al., 2008) to combine the RNA-seq,cDNA,and protein alignments with different weights (RNA-seq>cDNA/protein>ab initio gene predictions)to achieve a comprehensive and non-redundant reference gene set.This gene set was further updated using PASA(Haas et al.,2008),followed by annotation based on the best matches derived from the protein sequence alignments described in the SwissProt and TrEMBL databases(O'Donovan et al., 2002) using Blastp (with default parameters)(Altschul et al.,1997).We annotated motifs and domains of proteins using InterPro(Mulder&Apweiler,2007)to search publicly available databases,including Pfam(http://pfam.sanger.ac.uk/),PRINTS(http://www.bioinf.manchester.ac.uk/dbbrowser/PRINTS/index.php),PROSITE(http://prosite.expasy.org/),ProDom(http://prodom.prabi.fr/prodom/current/html/home.php),and SMART(http://smart.embl-heidelberg.de/).Descriptions of gene products,such as Gene Ontology(Ashburner et al., 2000) information, were retrieved from InterPro(Mulder&Apweiler,2007).Pathway information was obtained by blasting the above reference gene set with the KEGG database(Kanehisa&Goto,2000),with the best hit for each gene used for the annotation.
Gene synteny map among different species
We used the human(hg38;https://www.ncbi.nlm.nih.gov/grc/human),macaque(rheMac3(Yan et al.,2011)),and mouse(GRCm38;https://www.ncbi.nlm.nih.gov/grc/mouse)genomes and TS_2.0 to build a gene synteny map, as described previously(Fan et al.,2013).Briefly,the gene synteny map was constructed on the basis of orthologous genes.We did not use the whole genome alignment due to great sequence diversity among the species.The longest human,macaque,tree shrew,and mouse transcripts were chosen to represent each gene with alternative splicing variants. All protein sequences from the four species were aligned against the same protein set using BlastP with a similarity cutoff threshold of e-value=1×10⁻⁵.With the human protein set as a reference,we found the best hit for each protein in the other species,with a criterion that more than 30%of the aligned sequence showed identity above 30%.Reciprocal best-match pairs were defined as orthologs. Orthologs not in the gene synteny blocks were removed from further analysis.For example,for three continuous genes(A,B,and C)in the human genome,if all three orthologs could be identified between humans and tree shrews based on the cutoff threshold described above,and the B gene in the tree shrew genome was not between genes A and C,or located in other scaffolds or other places within the same scaffold,then the B gene was removed.Using this method,we identified four-way gene synteny relationships for humans,macaques,tree shrews,and mice.The gene order information of the human genome was used to identify the macaque,tree shrew,and mouse genomic SVs.
Whole genome sequencing and SNP calling
Low-quality raw short reads were removed using Trimmomatic v0.32(Bolger et al.,2014)with the parameters"LEADING:3 TRAILING:3 SLIDINGWINDOW:4:15 MINLEN:36".Qualityfiltered reads were aligned to the reference TS_2.0 assembly using BWA-MEM(Li&Durbin,2009).Picard Tools(http://broadinstitute.github.io/picard/) were used to flag duplicate reads.Only non-duplicate reads were used for subsequent analyses. GenomeAnalysisTK-3.7 (GATK) (McKenna et al.,2010)was used to realign indels and recalibrate base quality.We retained all single-nucleotide variants(SNVs)called by GATK UG with a Phred-quality score>Q10.The SNVs were hard filtered with the parameters"DP>8&QD>5.0&HRun<5& SB<0.00 & QUAL>50 & FS<60.0 & MQ>40.0 &HaplotypeScore>13.0". ANNOVAR was used to classify variants into different functional categories according to their locations and expected effects on encoded gene products(Wang et al.,2010).
Population genetic analyses
Nucleotide diversity(π)and Tajima's D value(Tajima,1989)were estimated using VCFtools based on the six wild Chinese tree shrews,with a sliding window of 100 kb in each genome.For each coding gene,we estimated the population genetic parameters, including π, Watterson theta estimate (θw)(Watterson,1975),Tajima's D(Tajima,1989),Fu and Li's D(Fu&Li,1993),Fu and Li's F(Fu&Li,1993),and Fay and Wu's H (Fay & Wu, 2000), using in-house perl scripts.Manhattan plot analysis was performed using the R package qqman(https://cran.r-project.org/web/packages/qqman/index.html).
mRNA expression analysis
The raw RNA-seq data (Supplementary Table S1) were trimmed to remove sequencing adapters and reads containing one or more Ns>5%or of low quality(more than 20%of the base's qualities were less than 10).The filtered reads were aligned to the reference genome TS_2.0 assembly using HISAT2(Kim et al.,2015).The HTSeq-count(Anders et al.,2015) was used to count aligned reads mapped with the above reference gene set. We calculated the FPKM(fragments per kilobase per million mapped reads) value using in-house perl script to quantify mRNA expression as follows:

where,FPKM refers to the mRNA expression level of gene A,C is the number of fragments uniquely aligned to gene A,N is the total number of reads uniquely aligned to all genes,and L is the base number in the coding region of gene A.
For co-expression analysis, we used reported RNA-seq data from seven tree shrew brain tissues(Fan et al.,2013,2018)to calculate Pearson's correlation coefficients for each gene pair. A co-expression gene pair was defined by a Pearson's correlation coefficient cut-off of 0.8.
Tree shrew database
Our developed tree shrew database(TreeshrewDB v2.0)runs on a dual-processor server with an Ubuntu operating system and is implemented under the LAMP(Linux-Apache-MySQLPerl)software stack.The Chinese tree shrew genome TS_2.0 assembly,gene set,gene annotation,and other information are stored in the MySQL,and are administrated with the help of phpMyAdmin.The web interfaces were developed using various computer languages such as HTML,CSS,JavaScript,and Perl.
RESULTS
Assembly of reference genome and quality evaluation
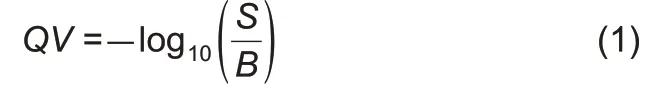
We generated ~55x (148.58 Gb) whole-genome sequence coverage for the sampled adult male Chinese tree shrew using SMRT long-read sequencing technology(PacBio).After filtering poor-quality reads, we programmed a combination method of de novo assembly to generate a high-quality tree shrew genome(KIZ version 2:TS_2.0,with a size of 2.67 Gb).The new assembly produced a total of 3 344 sequence contigs,with a 112-fold reduction in the number of contigs compared to that of our previous assembly(KIZ version 1:TS_1.0)based on short reads(Fan et al.,2013)(Table 1).The contig N50 of TS_2.0 was 3.2 Mb and exhibited remarkable improvement(146-fold)compared with that of the previous assembly(TS_1.0)(Fan et al.,2013).Nearly 60%of contigs(1 963/3 344) were longer than 100 kb and accounted for 97.4%of the assembled genome.The longest contig was 16.2 Mb(Table 1;Figure 1).We used BUSCO analysis,which is a powerful tool for assessing genome assembly and annotation completeness with single-copy orthologs(Simao et al.,2015),to evaluate the quality of the TS_2.0 contigs.About 91.4%of the 4 104 core genes in the mammalian dataset were complete BUSCO genes (Table 2). These tests all showed that the newly assembled tree shrew genome contigs had superior quality to those in recently reported ape genomes(Kronenberg et al.,2018).
We also generated ~264 x(705 Gb)Hi-C data(Table 3)to cluster the contigs into chromosome-scale scaffolds.A total of 1 728 contigs(comprising 96.2%of the assembled genome sequence)were anchored into 31 pseudo-molecules,whereas 1 616 contigs (102 Mb, 3.8% of assembled genome sequence)were unanchored(Table 4).The final chromosomescale scaffolding of the de novo genome assembly of the Chinese tree shrew(TS_2.0)had a scaffold N50 length of 104 Mb,which is much more complete than the previous TS_1.0 assembly(Fan et al.,2013)(Table 1).
To compare the long-read tree shrew genome assembly(TS_2.0)in this study with the previous short-read assembly(TS_1.0) (Fan et al., 2013), we generated ~30x coverage Illumina paired-end read sequences from another tree shrew and aligned it to both assemblies.The identified SNPs and indels were used to estimate assembly accuracy.The TS_2.0 assembly(quality value=28.56)had a higher quality value,as estimated using the number of non-matching base calls from FreeBayes(Bickhart et al.,2017;Garrison&Marth,2012),than that of the TS_1.0 assembly(quality value=26.75)(Table 5).In addition,the TS_2.0 assembly had 3-fold fewer SVs than that of TS_1.0(Fan et al.,2013),thus suggesting fewerassembly errors(Table 5).Quality evaluation using the FRC method(Vezzi et al.,2012)also showed TS_2.0 to be a better assembly(Table 5).
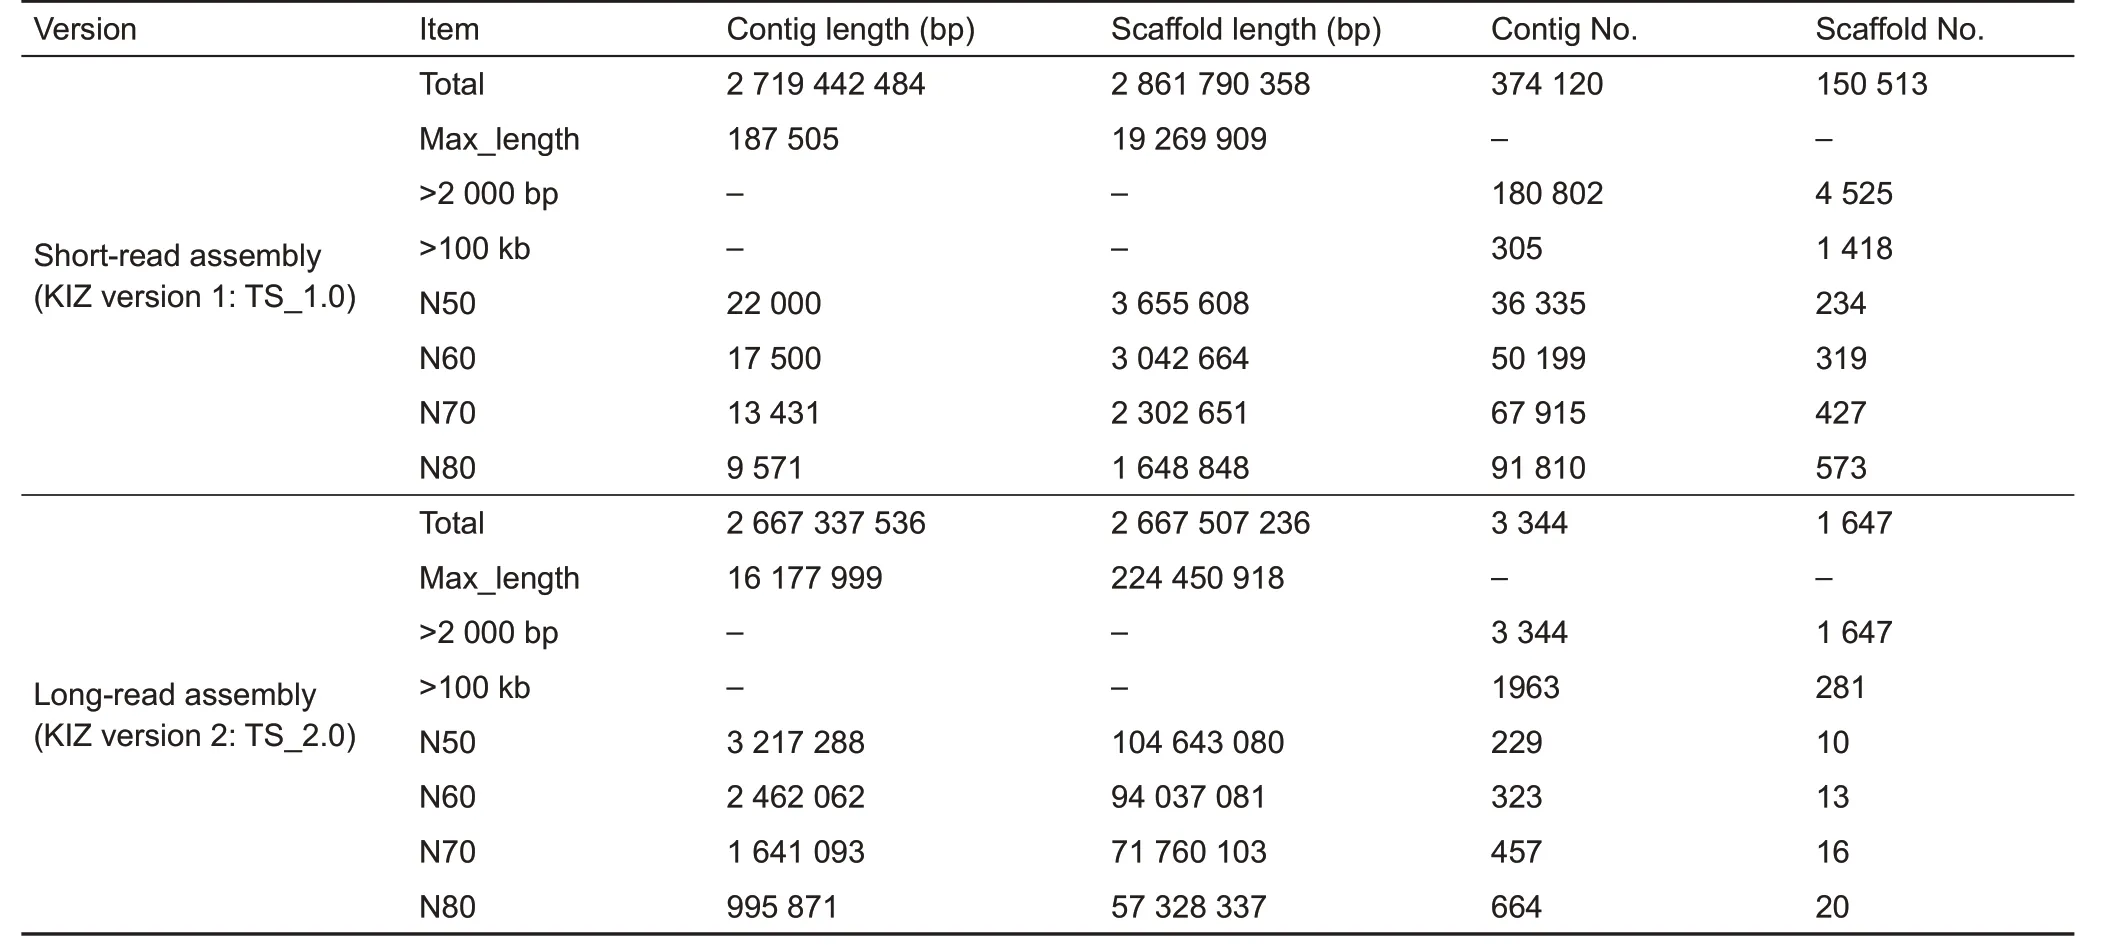
Table 1 Comparison of Chinese tree shrew assembly quality between assemblies TS_1.0 and TS_2.0
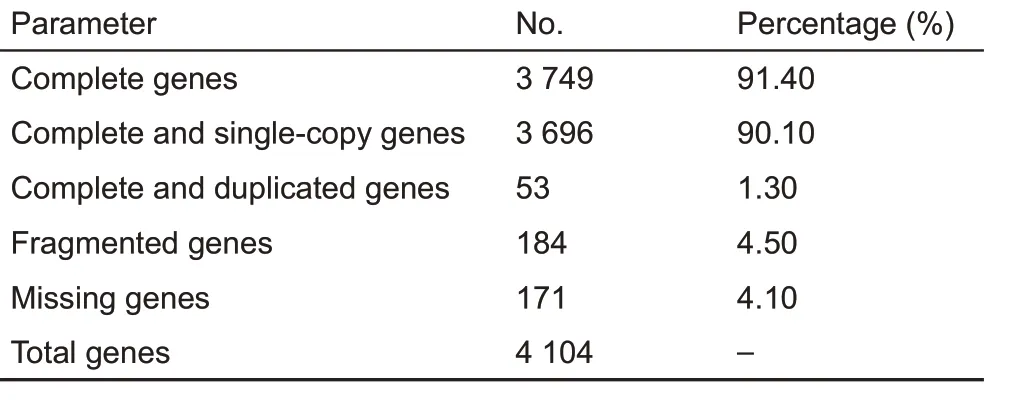
Table 2 Assessment of assembly completeness in Chinese tree shrew using BUSCO
About 73%of the gaps(163 220 gaps,93.10 Mb)in the TS_1.0 assembly(Fan et al.,2013)were filled by the 49.15 Mb long-read sequences in the TS_2.0 assembly.Among these fully closed gaps,65 222 were located in the genic regions.Only 39 gaps in TS_2.0 were fully closed by TS_1.0(Table 6).We note that 4 112 gaps in TS_1.0 had flanking sequences that were mapped to separate pseudo-chromosomes in TS_2.0,indicating assembly errors in TS_1.0(Fan et al.,2013).
The updated genome assembly is available at TreeshrewDB v2.0 (http://www.treeshrewdb.org) and hasbeen deposited in GSA(accession No.PRJCA001472;http://gsa.big.ac.cn/)(Wang et al.,2017).

Table 3 Statistics of Hi-C data for mapping
Repeat content in tree shrew genome
Figure 1 Assembly,annotation,and nucleotide diversity of Chinese tree shrew genome
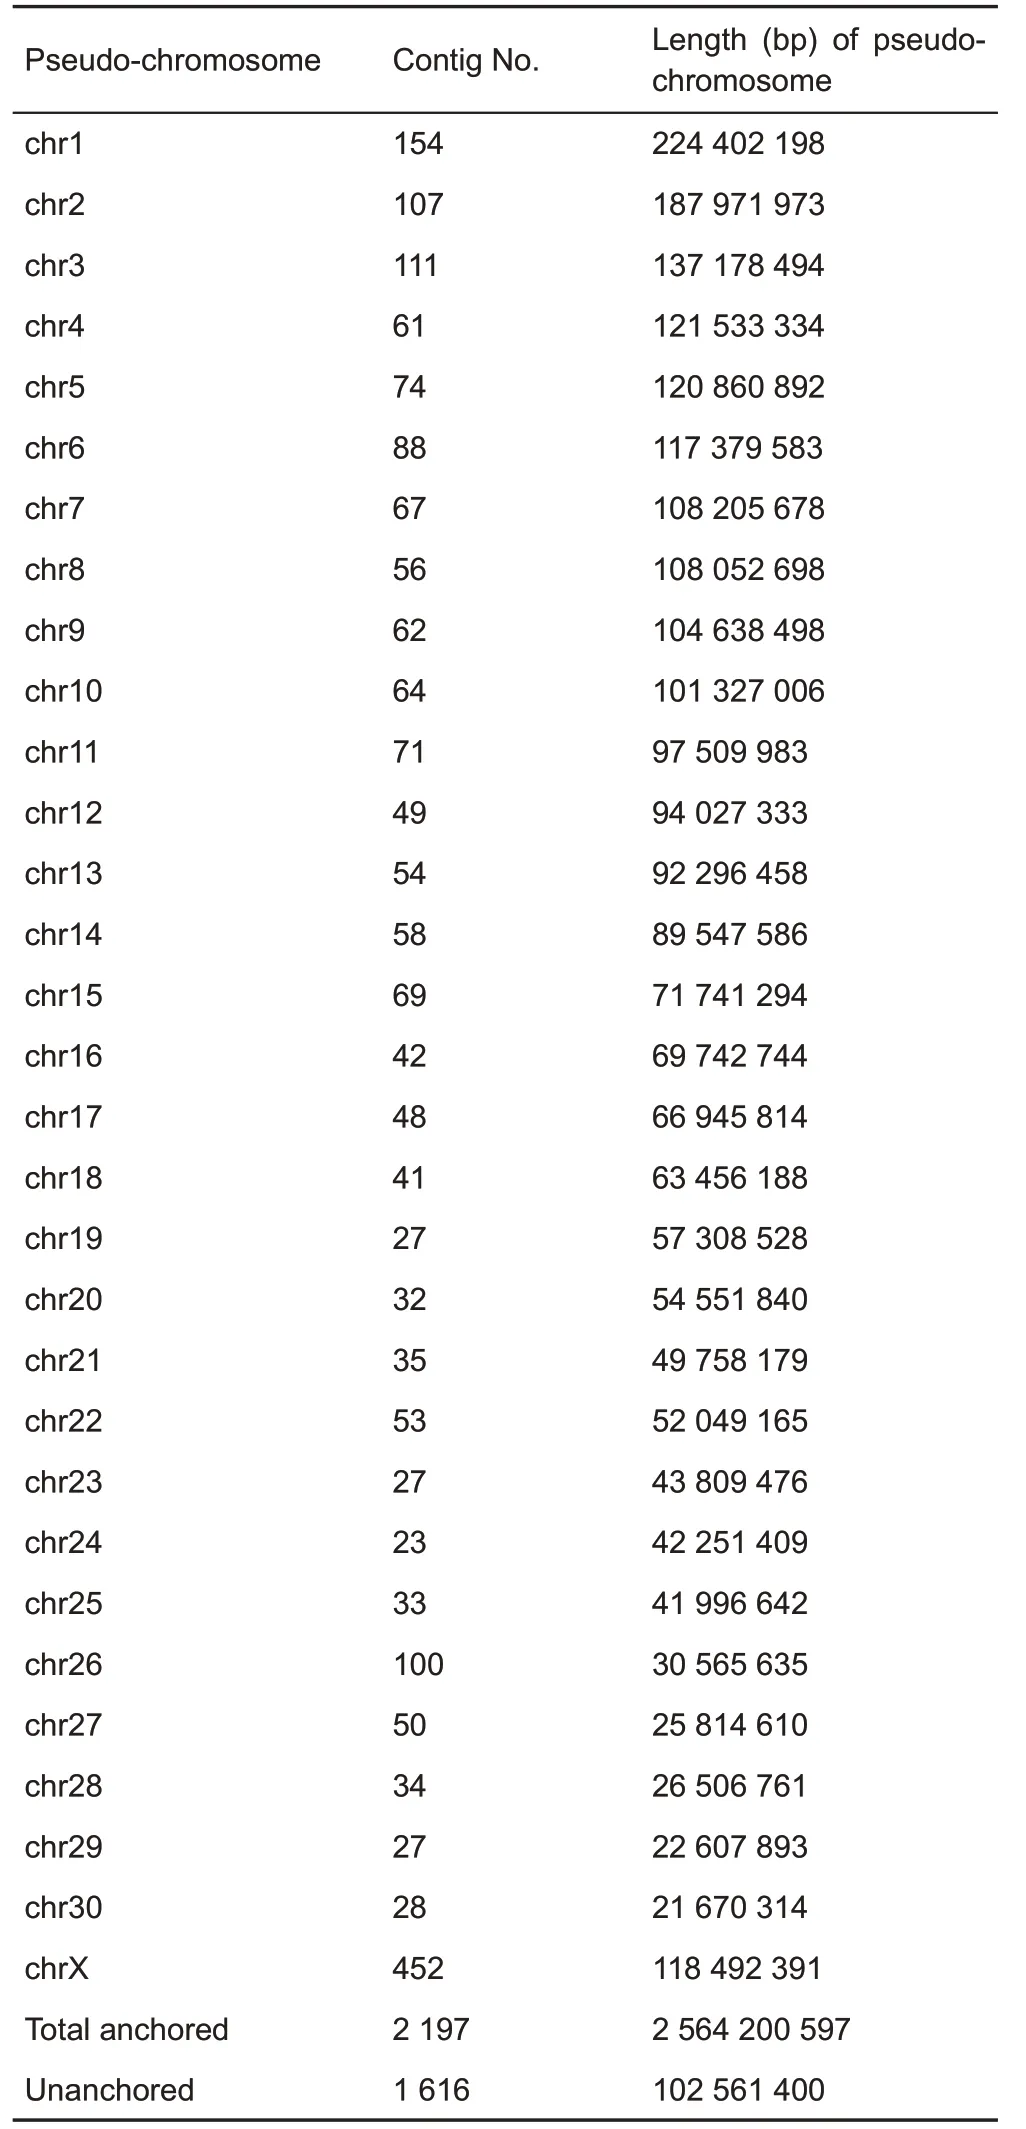
Table 4 Pseudo-chromosome sizes and assignment of Hi-C scaffolds
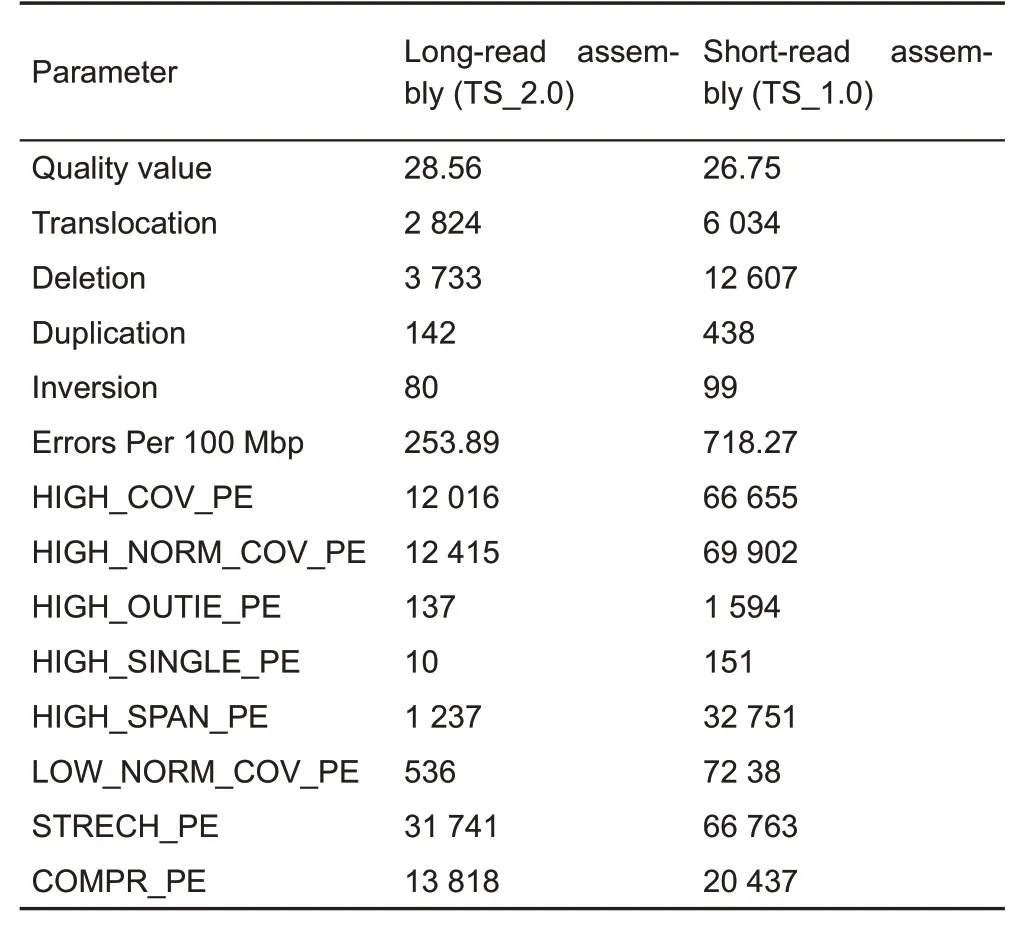
Table 5 Assembly quality score value statistics
Repeat content in a genome poses a daunting difficulty for sequence assembly(Kronenberg et al.,2018).The function of repeat content has also begun to be recognized(Chuong et al.,2017).The TS_2.0 assembly presented an opportunity to identify and study full-length repeats.Here,49.14%(up to 1.31 Gb) of the TS_2.0 assembly was identified as interspersed repeats,which represents an increase of 308 Mb repeat elements relative to TS_1.0(Fan et al.,2013)(Table 7).Among the defined repeat elements, LINE1 (L1, long interspersed nuclear elements 1)repeats accounted for the highest proportion in TS_2.0(18.54%of genome size;Table 8),similar to that of L1 in the human genome(Beck et al.,2010).The tree shrew specific tRNA-derived Tu-III family,the largest proportion of the SINE (short interspersed nuclear elements)in the Chinese tree shrew genome(Fan et al.,2013),accounted for 15.17%of genome size in TS_2.0(Table 8).The reason for the unusually high prevalence of the tRNAderived Tu-III family in the tree shrew genome remains to be determined.Because of the improvement in genome quality,we were able to identify 127 long transposable elements(each >20 kb). We also defined 4 411 709 satellites (total length of 131 Mb)in TS_2.0.Among them,4 293 990 were short tandem repeats(each <150 bp)and 1 152 were long tandem repeats(each>5kb).The longest tandem repeat was mapped to a non-coding region in the end of pseudochromosome 26 and had a length of 168.3 kb(period size=359 bp,copy number=471).We note that some long tandem repeats within the genic regions were located in gaps in the TS_1.0 assembly(Fan et al.,2013).For instance,a longtandem repeat (period size=1 917 bp, copy number=26)overlapped with the coding sequence of the OS9 gene(osteosarcoma amplified 9, endoplasmic reticulum lectin),which plays a key role in the endoplasmic reticulum stress response associated with hypoxia (Satoh et al., 2010).Therefore, these long tandem repeats in the tree shrew genome may be functional. However, focused studies are required for their characterization.

Table 6 Gap closure statistics of the two genome assemblies
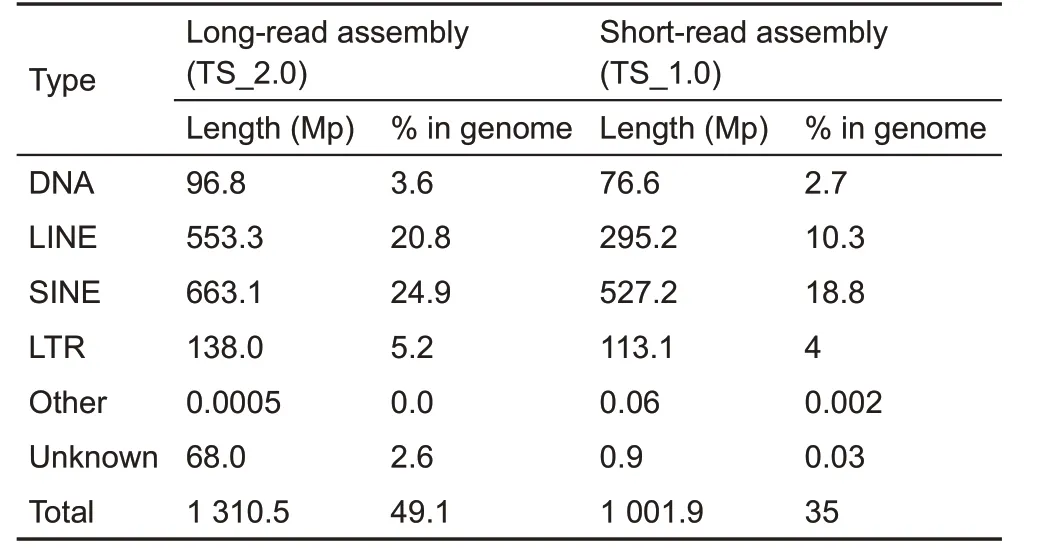
Table 7 Comparison of transposable elements in Chinese tree shrews between short-read assembly(KIZ version 1:TS_1.0)and long-read assembly(KIZ version 2:TS_2.0)
Gene annotation updates
We combined the homology-based, de novo, and transcriptome-based methods(Haas et al.,2008)to predict protein-coding genes in the TS_2.0 assembly and identified a total of 23 568 non-redundant protein-coding genes(Fan et al., 2013) (Table 9; Figure 1B).Among these genes, the majority(22 907 genes)were supported by the reported RNAseq data in our recent studies(Fan et al.,2013,2018).The newly updated gene set had longer coding sequences,which were, on average, composed of more exons (Table 9)compared with the TS_1.0 gene set(Fan et al.,2013).The gaps in 2 091 exons in TS_1.0(Fan et al.,2013)were all filled in TS_2.0,thus providing better annotation information for the genes.For instance,LILRB3(leukocyte immunoglobulin like receptor B3), which binds to the major histocompatibility complex(MHC)class I molecules on antigen-presenting cells to inhibit stimulation of immune response(Huang et al.,2010),was complete in TS_2.0, but less than 50% of this gene sequence was retrieved in TS_1.0(Fan et al.,2013).BMP8A(bone morphogenetic protein 8a),which plays a role in the development of the reproductive system(Wu et al.,2017),exhibited low protein sequence identity(57.22%)with human homolog in TS_1.0(Fan et al.,2013)due to assembly error and gaps,but the sequence identity reached 88.94%in TS_2.0. In addition, ALOX15 (arachidonate 15-lipoxygenase),which uses polyunsaturated fatty acid substrates to generate various bioactive lipid mediators, such as eicosanoids,hepoxilins, and lipoxins (Kuhn et al., 2018; Singh & Rao,2019),had only one copy in TS_1.0(Fan et al.,2013)but four copies in TS_2.0.The updated versions of these important genes have provided a good basis for further specific functional characterization.
Of the annotated genes,20 811(88.3%)were functionally classified according to InterPro(Mulder&Apweiler,2007),GO(Ashburner et al.,2000),KEGG(Kanehisa&Goto,2000),Swissprot,and TrEMBL(O'Donovan et al.,2002).In addition,586 genes were newly annotated in TS_2.0(Table 10).All these genes can be retrieved from TreeshrewDB v2.0.
It should be mentioned that the MHC region(starting from MOG to COL11A2(Beck et al.,1999)in pseudo-chromosome 3) was completely assembled (Figure 2A) in the TS_2.0 assembly.It was previously difficult to assemble this region using short-read sequencing technologies as it is highly polymorphic and repetitive.There were 412 gaps in the MHC region in TS_1.0(Fan et al.,2013),which were all filled in TS_2.0.Thus,the tree shrew has more MHC class I genes(n=8 according to TS_2.0)than those identified in humans(n=6),although fewer than those identified in mice(n=12)(Elmer&McAllister,2012)(Figure 2B).
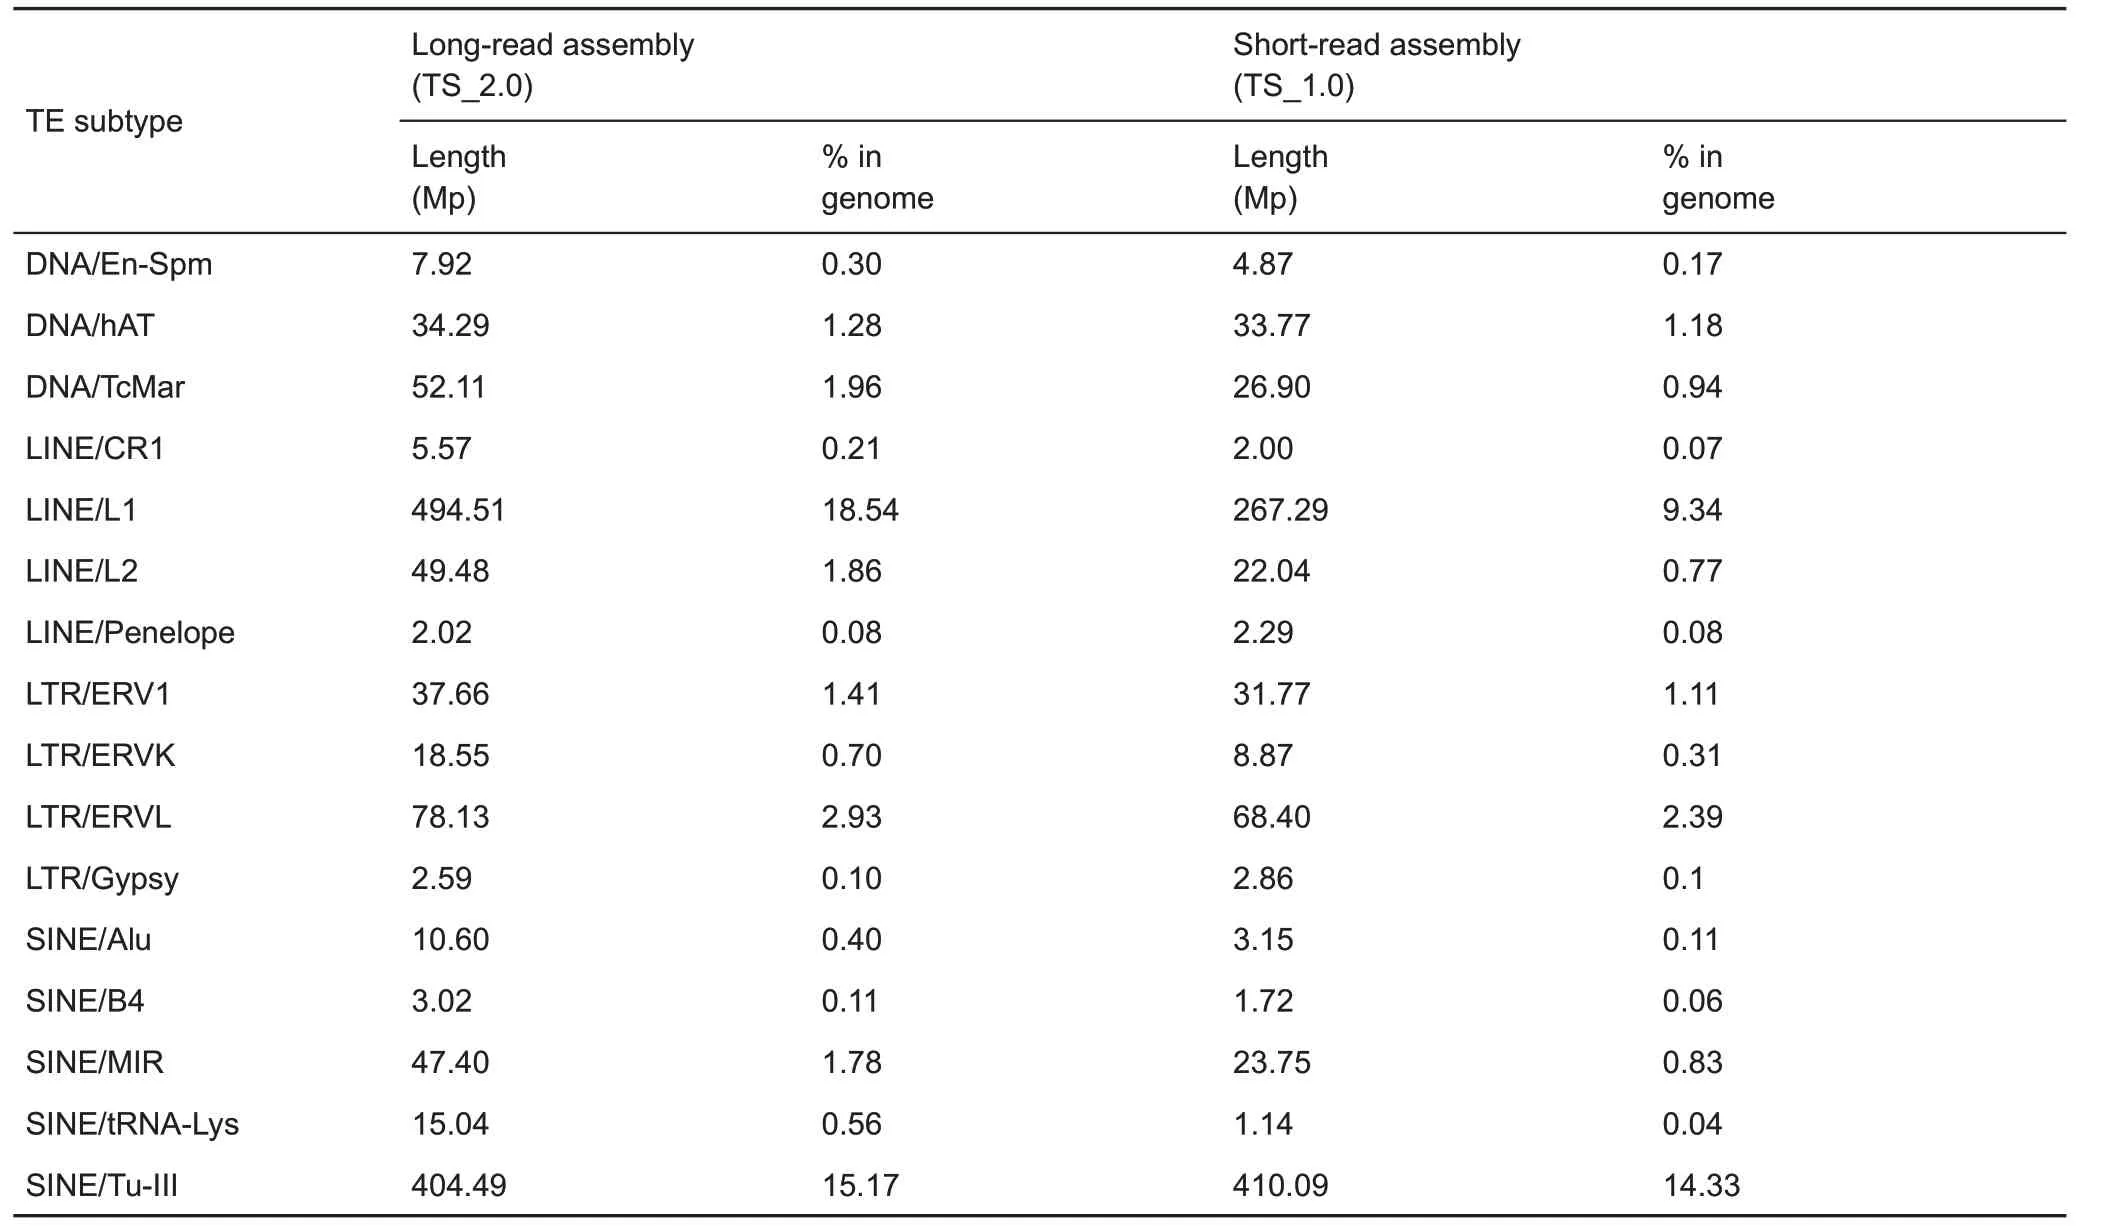
Table 8 Comparison of transposable element subtypes in Chinese tree shrews between short-read assembly(KIZ version 1:TS_1.0)and long-read assembly(KIZ version 2:TS_2.0)

Table 9 Comparison of Chinese tree shrew gene annotation between short-read assembly(KIZ version 1:TS_1.0)and longread assembly(KIZ version 2:TS_2.0)
Genomic structural variants
The genome TS_2.0 assembly improved sequence continuity and provided an opportunity to explore species-specific genomic SVs in genic regions.We used the human(hg38;https://www.ncbi.nlm.nih.gov/grc/human),macaque(rheMac3(Yan et al.,2011)),and mouse(GRCm38;https://www.ncbi.nlm.nih.gov/grc/mouse) genomes and TS_2.0 to construct a synteny map of orthologous genes,using the human genomeas a reference. We identified 221 SVs in tree shrews(Supplementary Table S2), 188 SVs in macaques(Supplementary Table S3), and 387 SVs in mice(Supplementary Table S4),suggesting that the tree shrew's genomic structure had an overall higher similarity to that of primates than to that of mice.A detailed comparison of the SVs showed that the tree shrews had a seemingly mosaic pattern with some similarities to rodents and others to primates.For instance,the tree shrew and primates(human and macaque) had a specific genomic SV in the region starting from MYSM1 to SLC35D1,which was inverted in the mouse genome(Figure 3A).Some SVs existed in the tree shrew and mouse,but primates had different counterparts,such as the region from PRKAB2 to POLR3GL(Figure 3B).Note that in this region,GPR89B(G protein-coupled receptor

Table 10 Comparison of Chinese tree shrew gene functional annotation between short-read assembly(KIZ version 1:TS_1.0)and long-read assembly(KIZ version 2:TS_2.0)
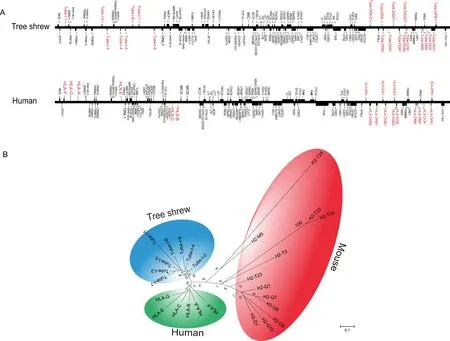
Figure 2 Chinese tree shrew and human MHC genes
Genomic sequence variations at population level
To understand genomic sequence variations in the Chinese tree shrew,we analyzed the whole-genome sequencing data of six individuals(each with a sequencing depth of 30x).After mapping to TS_2.0,we identified a total of 12.8 million(M)SNPs in these individuals(Figure 1B),with 293 128(including 194 751 synonymous and 98 377 non-synonymous SNPs)located in the coding regions.
We estimated population genetic parameters for the 89B)and NOTCH2NL(notch 2 N-terminal like A)were only present in the human genome(Figure 3B).The updated TS_2.0 assembly has thus provided more opportunities to understand the evolution of SVs and potentially disrupted genes in the tree shrew genome.The exact reason for the occurrence of species-specific SVs and their potential evolutionary and functional effects await further study.
Chinese tree shrew using the six captive individuals. We calculated the nucleotide diversity based on SNPs located in coding regions and identified 30 genes with high nucleotide diversity based on a cut-off π value of 0.025(Figure 1C).Among these genes,five were located in the MHC loci or belonged to the immunoglobulin gene family,suggesting that immune genes may have a relatively high evolutionary rate in tree shrews,although this needs to be validated by analyzing more samples and including non-coding regions(Figure 1C).
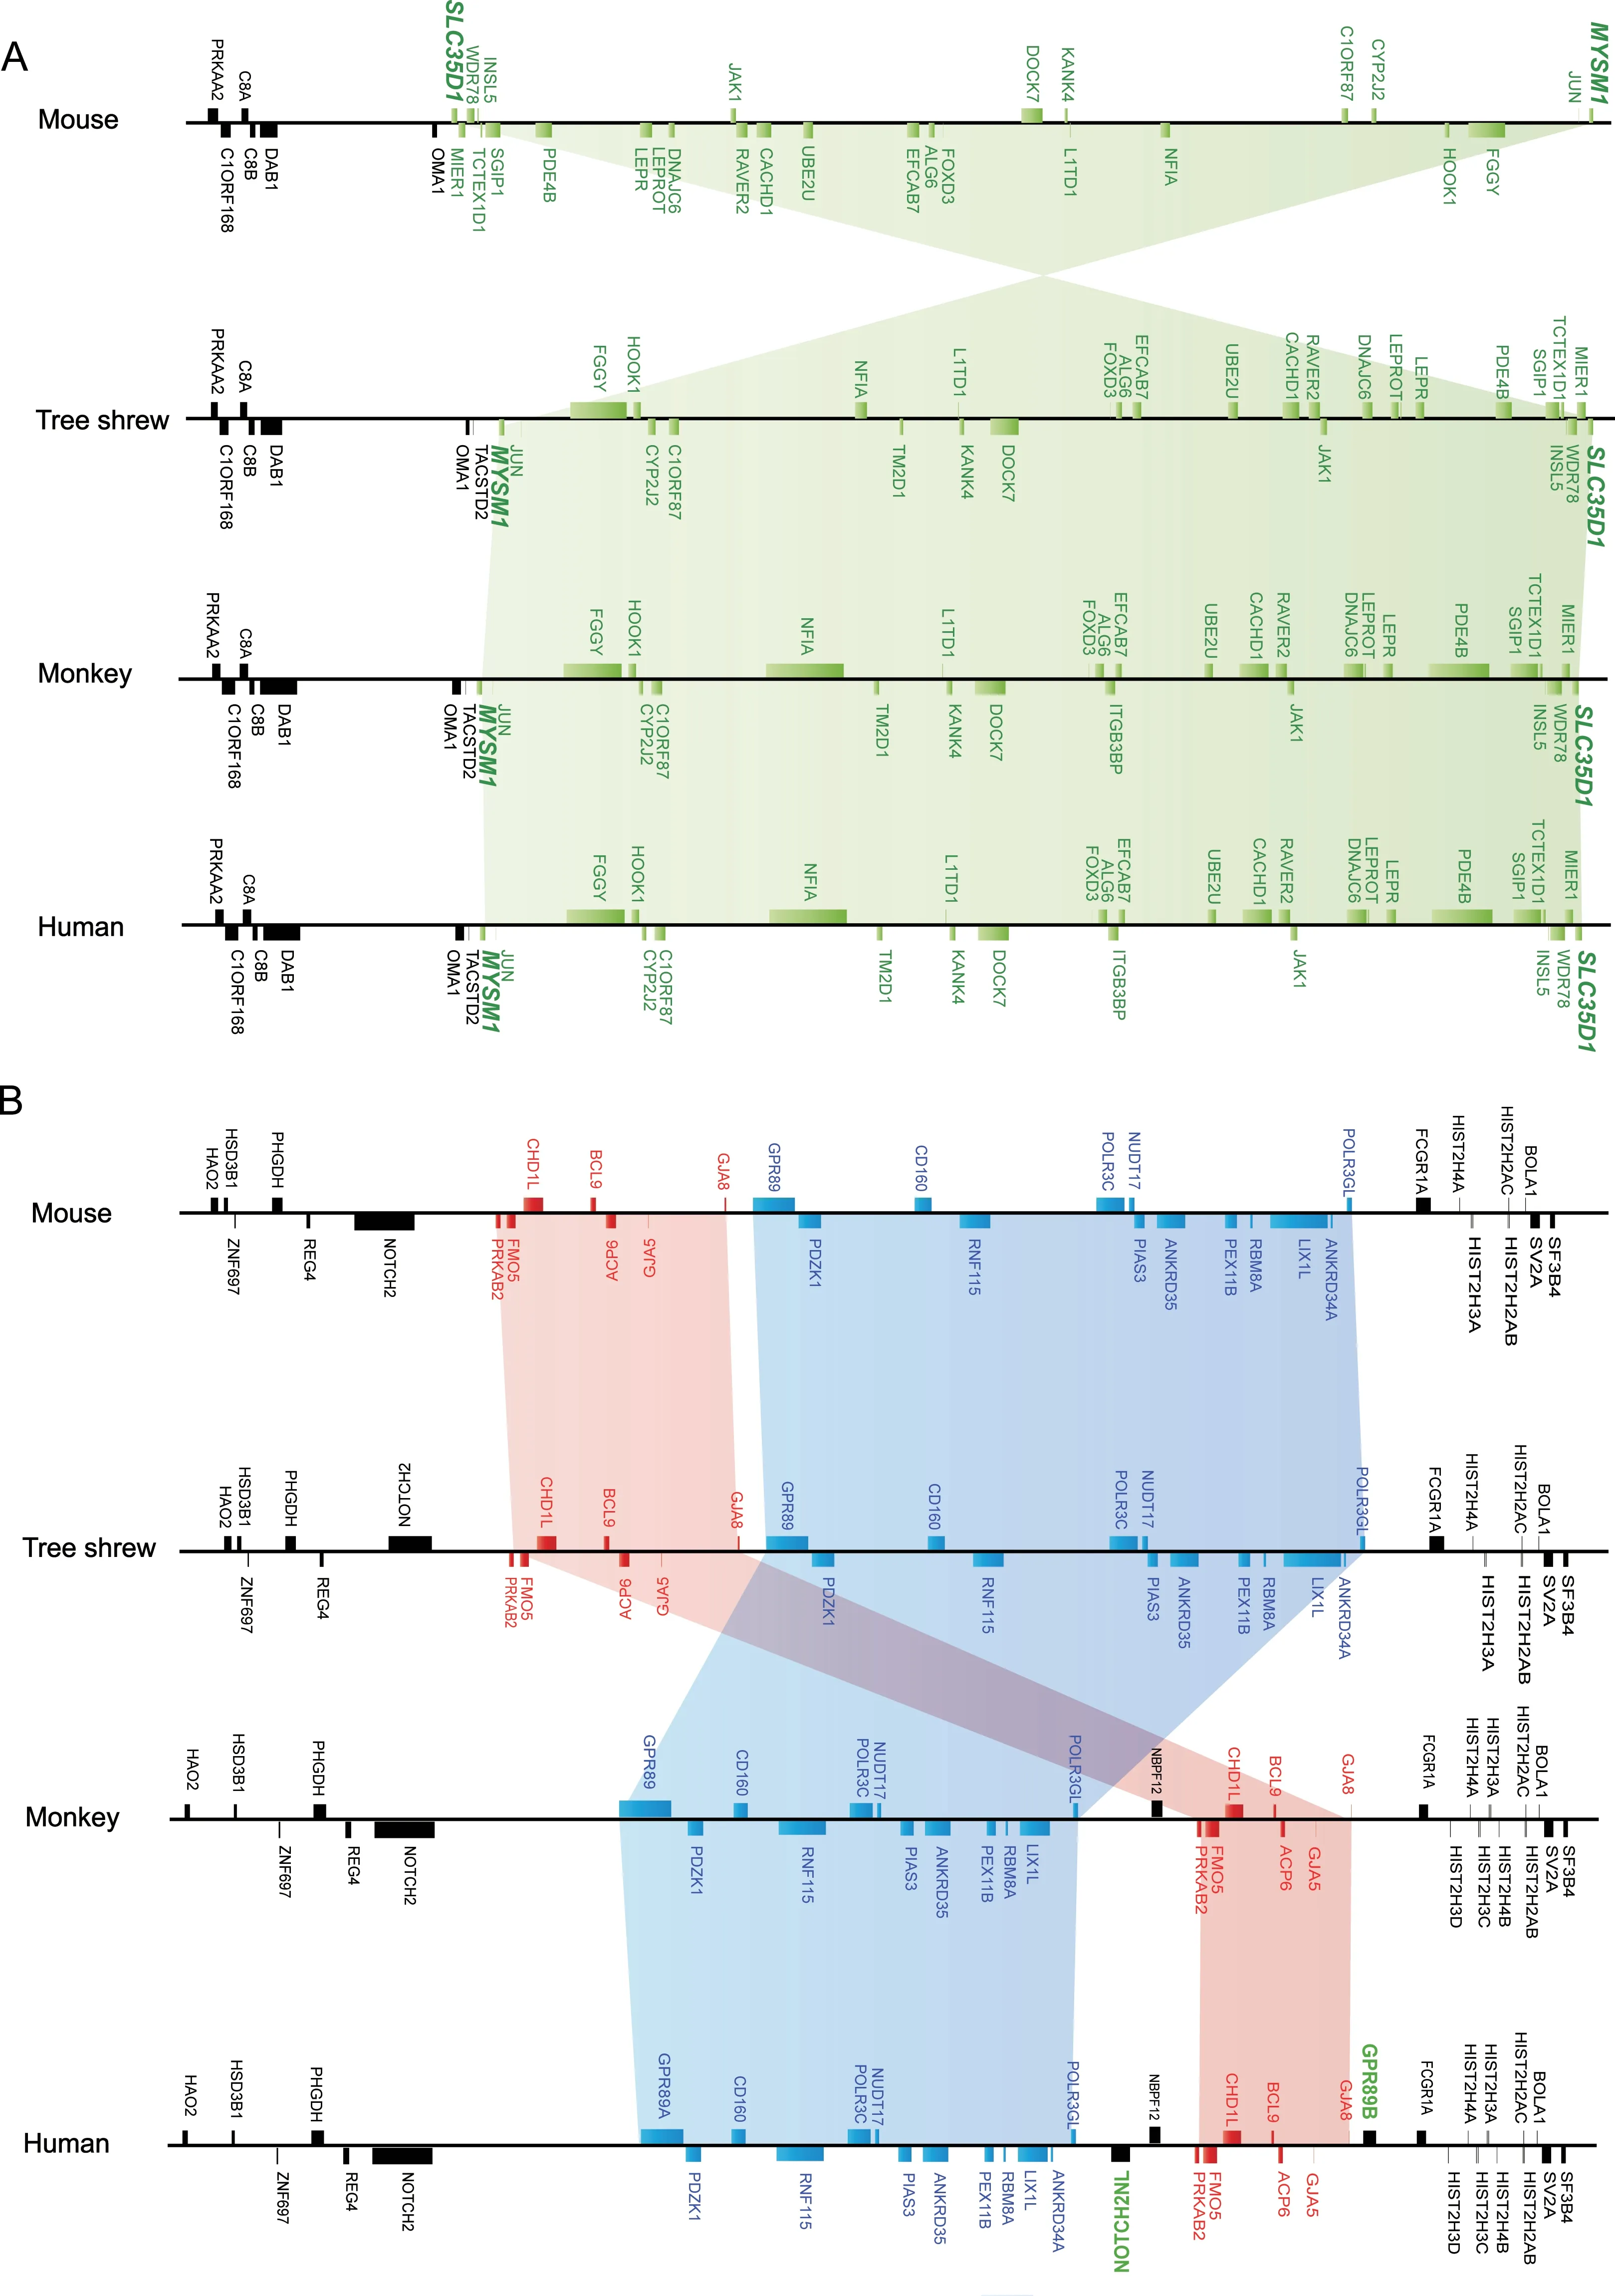
Figure 3 Examples of structural variants in mouse,macaque,tree shrew,and human genomes
Whether or not this pattern reflects a compensatory effect due to the loss of RIG-I in the tree shrew genome(Fan et al.,2013;Xu et al.,2016;Yao,2017)remains to be studied.We calculated Tajima's D(Tajima,1989)for each gene,and found discrete distribution, with no obvious clustering(Supplementary Figure S1).Results for Fu and Li's D test(Fu&Li,1993),Fu and Li's F test(Fu&Li,1993),Fay and Wu's H test(Fay&Wu,2000)all showed a pattern similar to the Tajima's D test. Nonetheless, these results should be treated with caution,as they may be biased by the limited sample size.
Tree shrew database updates
Based on the TS_2.0 assembly,we updated TreeshrewDB v2.0(Figure 4)to distribute the new high-quality tree shrew genome and our newly annotated gene and genome information.The main database updates included revision and expansion of genomic data, gene co-expression patterns,population genetic statistics,and improvements to the web interface.Briefly,for the retrieval module,we updated the reference sequence ID,genomic location and map,transcript sequence,and functional annotation based on the new gene set. We added five primate species (gibbon (Nomascus leucogenys), golden snub-nosed monkey (Rhinopithecus roxellana), black snub-nosed monkey (R. bieti), Bolivian squirrel monkey (Saimiri boliviensis boliviensis), and bushbaby(Otolemur garnettii))in the orthologous gene sets from Ensembl(release 71;https://asia.ensembl.org/index.html)to allow for better comparison for one-to-one homologs.The mRNA expression pattern was upgraded based on RNA-seq data from 26 tissues and/or cells(Supplementary Table S1).For each gene query, it is possible to retrieve basic information on the queried gene,sequence alignment with homologs of other species,mRNA expression levels in tissues/cells, co-expression patterns in brain tissues, sequence variations at the population level,and results of population genetic parameters (including π, Watterson theta estimate(θw)(Watterson,1975),Tajima's D(Tajima,1989),Fu and Li's D(Fu&Li,1993),Fu and Li's F(Fu&Li,1993),and Fay and Wu's H(Fay&Wu,2000))(Figure 4).
We added the new Chinese tree shrew reference genome(TS_2.0)to the TreeshrewDB v2.0,which is free to download.The updated gene sequences can be extracted in batches or individually by our homemade ExtractSeq.We incorporated Blast(Altschul et al.,1997)and Genewise(Birney et al.,2004)to show the mapping of genes in the genome.Overall,the updated database now provides a comprehensive annotation of the Chinese tree shrew genome to satisfy the needs of evolutionary analysis and biomedical research.
DISCUSSION
The combination of long-read sequencing and long-range chromosome interaction mapping(such as Hi-C)represents the most efficient approach to produce high-quality reference genome assembly(Bickhart et al.,2017;Kronenberg et al.,2018).In this study,we used these techniques to generate an updated reference genome for the Chinese tree shrew(KIZ version 2:TS_2.0)and resolved some of the problems from our earlier tree shrew genome(Fan et al.,2013).The updated TS_2.0 assembly enabled accurate identification of large and complex repeat regions,gene structures,and species-specific genomic SVs in the genic regions.This high-quality tree shrew genome will facilitate the use of this species in both biomedical and basic research, such as annotation and interpretation of RNA-seq data from normal and pathological tissues (Supplementary Table S1), and for a more comprehensive understanding of the evolution of primatespecific SVs and their potential regulatory changes(Kronenberg et al.,2018).For instance,we identified 221 SVs in the genic regions of the Chinese tree shrew genome and found that the overall pattern of SVs in the tree shrew more resembled that of primates than that of rodents(Supplementary Tables S2-4),further confirming the very close relationship between tree shrews and primates(Fan et al.,2013;Yao,2017).It should be mentioned that the TS_2.0 assembly still misses many large and complex SVs due to the limitations of current sequencing technology and assembly approaches.Moreover,we did not experimentally validate the SVs between TS_1.0 and TS_2.0,which would offer further information regarding the construction of a well-defined reference genome of the Chinese tree shrew.We will continue to refine the tree shrew genome using more data in the future.In general,the new TS_2.0 assembly filled most of the gaps and corrected most assembly errors present in the previous tree shrew genome(Fan et al.,2013),thereby providing better gene annotations.To understand the unique genetic features of the tree shrew genome,such as long tandem repeats,repeat content,and genomic SVs,detailed studies should be carried out in the future.
In our previous study,we built the TreeshrewDB(Fan et al.,2014)for easy access to the Chinese tree shrew genome data based on short-read sequencing technology (Fan et al.,2013),which has been visited frequently and used by many researchers.We comprehensively updated TreeshrewDB v2 based on the new high-quality reference genome(TS_2.0)generated in this study.We optimized the visualizations of gene annotation and genomic variations of the tree shrew and included results from population genetic parameters for this species. Furthermore, the inclusion of the reported transcriptomic data from 26 tissues and cells(Supplementary Table S1)has enhanced our knowledge of mRNA expression profiling in the Chinese tree shrew.This database will be regularly updated to include recently released genetic data and serve as a platform for data sharing among tree shrew studies and for further elucidation of the genetic features of this animal. We believe that the tree shrew genome assembly TS_2.0 and the updates will meet the increasing needs in the field.
SUPPLEMENTARY DATA
Supplementary data to this article can be found online.

Figure 4 Overview of updated tree shrew database(TreeshrewDB version 2.0)
COMPETING INTERESTS
The authors declare that they have no competing interests.
AUTHORS'CONTRIBUTIONS
Y.F.and Y.G.Y.conceived and designed the research.J.Q.C.and L.L.participated in the material preparation. Y.F. performed the genome assembly,annotation,and database update.Y.F.,M.Y.,J.Y.Z.,L.X.,D.Y.,T.G.,Y.L.Y.,P.Z.,D.D.W.,and G.J.Z.performed comparative analyses and/or provided critical comments.Y.F.and Y.G.Y.wrote the manuscript.All authors read and approved the final version of the manuscript.
ACKNOWLEDGEMENTS
We thank Ian Logan for critical comments and language editing for this manuscript.We are grateful for the three reviewers for helpful comments on the early version of the manuscript.
杂志排行

Zoological Research的其它文章
- From our roots,we grow Celebrating the 60th anniversary of the Kunming Institute of Zoology,Chinese Academy of Sciences
- Genomic insights into ruminant evolution:from past to future prospects
- Antimicrobial peptides:new hope in the war against multidrug resistance
- Superior intestinal integrity and limited microbial translocation are associated with lower immune activation in SIVmac239-infected northern pig-tailed macaques(Macaca leonina)
- Conserved sequences identify the closest living relatives of primates
- Systematic relationships of Chinese freshwater semisulcospirids(Gastropoda,Cerithioidea)revealed by mitochondrial sequences