Experimental investigation of oil particles filtration on carbon nanotubes composite filter
2019-10-15XuChengweiYuYanXieWenxiaZhangJunYangJiangang
Xu Chengwei Yu Yan Xie Wenxia Zhang Jun Yang Jiangang
(1Key Laboratory of Energy Thermal Conversion and Control of Ministry of Education, Southeast University, Nanjing 210096, China)(2School of Electrical, Energy and Power Engineering, Yangzhou University, Yangzhou 225127, China)(3College of Engineering, Hebei Normal University, Shijiazhuang 050024, China)
Abstract:Due to the lipophilicity of carbon nanotubes (CNTs),the carbon nanotubes composite filter for removing oil particles in cooking fumes is synthesized. The composite filter was fabricated by the chemical vapor deposition (CVD) method. The filtration characteristics of the resultant filter and the influence of the parameters were investigated. The results show that the filtration efficiency of the CNT filter during the saturation period is 99.92%, which satisfies the high efficiency particulate air (HEPA) standard. Pressure drop increases linearly before saturation and the pressure drop at the saturation stage is only two times that of the initial stage, which is far less than that of conventional glass fiber filters. The efficiency increases by enhancing filtration velocity. Pressure drops in the composite filter at the equilibrium stage are equal under different aerosol concentrations. The increase in concentration can improve the efficiency of composite filters. Therefore, the CNT filter is suitable for decreasing oil particle pollution due to its lower increase ratio of pressure drop and higher efficiency.
Key words:carbon nanotubes; composite filter; oil particle; filtration efficiency; pressure drop
Oil liquid aerosols commonly exist in the fog from Chinese cooking activity, which pose a risk to human health and atmospheric environments[1-2].The emission concentration of aerosol particles in cooking fumes can reach 186.4 to 1 406 μg/m3during the dinner period[3-4]. The cooking fumes emissions in urban areas is uncontrolled and disperse, which is adverse to air quality and public health. Great attention should be paid to the cooking fumes emissions. To decrease air pollution caused by cooking fumes, an effective and commonly used method is filtration technology.
The oil liquid particles are the main component of cooking fumes. In the past decades, the filtration of liquid aerosols on the fibrous filters has been investigated intensively. Frising et al.[5]and Contal et al.[6]studied the clogging phenomena of HEPA filters and divided the filtration process of liquid aerosols into four stages according to the change in pressure drop. They found that the oil liquid aerosols filtration was notably different from the solid aerosols filtration and the pressure drop increased exponentially during the filtration process due to the formation of a large liquid film. The filtration efficiency and pressure drop are the important criteria of liquid aerosols filtration, as well as solid particles filtration. Many authors studied the filtration characteristics of liquid aerosols based on filter structure, filter media, fiber diameter, packing density, and filter thickness[6-10].The results show that the exponential increases of pressure drop during the filtration process is a common phenomenon of tradition fibrous material filters, which dramatically increase the energy consumption of filtration and decrease the filter quality factor.
To obtain a high-quality factor filter, nanofiber filters have attracted great attention because they can achieve high filtration efficiency and a low pressure drop. Theoretically, as the fiber diameter decreases to nanometer-scale, the effect of slip flow becomes significant which is beneficial for low airflow resistance and high filtration efficiency[11]. There are two main types of nanofibers, carbon nanotubes (CNTs)[12-14]and electrospun nanofibers[15-16]. However, there are some limitations, such as poor mechanical properties and chemical stability, when employing electrospun nanofibers as filter media[13, 17].
In addition, the surface properties of fibers affect the distribution and flow of oil droplets on the filter[18-20]. The distribution shape of collected oil droplets is important for the airflow and aerosols capture efficiency. The oleophilic surface allows oil liquid to spread rapidly on the surface and keeps large clamshell droplets from blocking the gas flow channels.
CNTs have good oil-wetting property and lipophilicity[21], a large surface area[13], and nanometer-scale fiber diameter, and thus they are a promising material for capturing oil liquid aerosols. In this work, we designed and fabricated a CNT filter based on the frame of porous metal material for capturing the oil liquid aerosol, and its filtration performance was studied for oil particles. In addition, we investigated the influence of operating conditions (aerosols concentration and gas velocity) on the filtration efficiency and pressure drop.
1 Experimental
1.1 Synthesis and characterization of CNT filter
Nickel foams (thickness of ca.3 mm, PPI of 110,w(Ni)≥99.9%) were cut to a desired shape after ultrasonic pre-treatment in acetone and distilled water. Then, Al2O3-modified nickel foams(Al2O3/NF) were prepared according to the procedure described in Ref.[22]. Xylene was employed as carbon source. Ferrocene was used as the catalyst. Xylene and ferrocene were purchased from the Aladdin Industrial Corporation Shanghai, China. CNTs were grown on the substrate via a CVD method. Ferrocene was dissolved in xylene (0.03 g/mL). Before the CVD process, the furnace was heated to 800 ℃ over 30 min and a gas flow of N2(0.9 L/min) passed through the tube furnace. Then, the temperature of the furnace was maintained at 800 ℃ for 180 min and the flow rate of N2was changed to 0.6 L/min. Simultaneously, the mixed solution of xylene and ferrocene was continuously injected into the tube by a syringe pump at a feeding rate of 5 mL/h for 3 h. After a reaction time of 3 h, the furnace was cooled down to room temperature under N2environments and the CNT filter was obtained. The morphology of the CNT filter had been described in detail in our previous work[23].The properties of the CNT filter are shown in Tab.1.

Tab.1 Characteristics of the test filter
The packing densityαis calculated by
(1)
wheremfis the fiber mass;Vis the filter volume; andρfis the fiber density.
1.2 Experimental set-up
The filtration experiment was conducted on a specially built apparatus as shown in Fig.1. The test filter was first placed into a filter holder with an inner diameter of 40 mm. The dried compressed air was used as the carrier gas. Liquid aerosols were generated by atomizing an oleic acid solution using a simple atomizer manufactured in-house. Oleic acid was selected as a mock pollutant because it was the main organic contaminant in cooking fume particles and is commonly found in animal and vegetable oils. A thermostat water bath was used to keep the oil temperature at a constant value and thus oil physical properties were constant throughout the experiments. The aerosol concentration and size distribution before and after the CNT filtering were measured using an Electrical Low Pressure Impactor (ELPI, DEKATI). A pressure transmitter and recorder (Asmik, MIK-9600D) were used to measure online the pressure drop of the filters. A high efficiency particulate air (HEPA) filter was placed in front of the flow meter to prevent the oil mist from entering the flow meter and pump. The vacuum pump was allowed to change speed for achieving different filter face velocities. The weight of the filter at the saturation state was measured by an electronic balance (Sartorius, 100 μg precision).
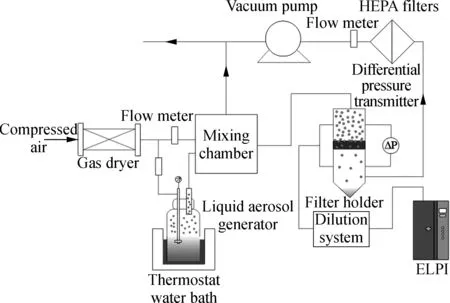
Fig.1 Experimental set-up
A polydisperse fog of oleic acid was used as mock cooking fumes for the filtration performance tests. The particle size distributions are shown in Fig.2. The particle diameters are in the range of 40 nm to 8 μm (including ultrafine, accumulation and coarse oil particles), and peak at 210 nm. The number concentrationCNof mock fumes is 1.97×107cm-3, and the mass concentrationCmis 1 383 mg/m3.

Fig.2 Particle size distributions of oleic acid liquid aerosol
1.3 Description of the experiments
The experiments included the pressure drop and efficiency evolution of the CNT filter throughout the whole filtration experiment, up to the saturation stage. The droplet mass concentration generated by the atomizer was maintained at constant for all the experiments at 1.383 g/m3.To obtain different aerosol concentrations, the fog from atomizer was diluted with cleaned compressed air to 690 and 460 mg/m3. Three filtration velocitiesUwere employed: 0.42, 0.64 and 0.92 m/s. To determine the amount of liquid aerosols collected into the filter, the filter was weighed at the end of each experiment. At least two independent experiments were performed to verify the reproducibility of the measurements.
2 Results and Discussion
2.1 Pressure drop
2.1.1 Pressure drop profile
The filtration performance can be evaluated from the pressure drop and efficiency.Fig.3 represents the evolution of pressure drop and filtration efficiency of the CNT filter for the entire filtration process. It can be seen that the increase in pressure drop can be divided into two stages:
1) At the beginning of the filtration process (initial stage), the pressure drop increases approximately linearly at the entire initial stage, and the filtration efficiency experienced a significant fluctuation at the beginning of the initial stage and then increased gradually.
2) At the second stage of the dynamic filtration (equilibrium stage), a pseudo-steady state is established between the collection and drainage of liquid particles. The pressure drop and efficiency are constant in this stage and the filter reached saturation.

Fig.3 Changes in the pressure drop and filtration efficiency of the CNT filter during filtering (Cm=1 383 mg/m3, U=0.91 m/s)
According to Refs.[5-6, 24-25], the dynamic process of liquid aerosol filtration was broken down into three or four stages for tradition glass fiber filters. No matter three or four stages, there was an evident exponential increase in pressure drop owing to the formation of “liquid bridge” and “liquid film” before the equilibrium stage. In the present work, it is noted that the exponential growth of the pressure drop does not appear and the increase ratio of the pressure drop is only about 2 times in the entire filtration process. The change in pressure drop indicates that the captured liquid particles attach and spread rapidly on the fiber surface to form only “liquid tubes” or “barrel droplets” due to the excellent oil wetting property of the CNT fiber[5, 26].
For investigating the distinction between the CNT filter and glass fiber filter clearly, a traditional glass fiber filter with HEPA standard was employed as control filter. Fig.4 shows the pressure drop evolution of the CNT filter and control filter. The change in the pressure drop of control filter shows an exponential raise before the saturation stage, which is consistent with Refs. [5-6, 24-25]. The result indicates that the carbon nanotubes material can restrain the formation of “liquid bridge” and “liquid film” and even avoid it. The slow and linear increase in pressure drop can reduce the energy consumption.

Fig.4 Pressure drop evolution versus filtration time for the CNT filter and HEPA glass fiber filter (Cm=1 383 mg/m3, U=0.91 m/s)
The fluctuation in efficiency occurred at the beginning of the initial stage in Fig.3. The reason for the decrease in total efficiency is that the captured particles deposited on the filter lead to the decrease in the fiber collection area at the initial stage[6]. With the accumulation of particles, the droplets spread on the fiber and wetted it to form “liquid tubes” or “barrel droplets” due to the surface tension and capillary action, which enhances the collection area. The redistribution of droplets contributes to the enhancement of the collection area and the efficiency improves gradually. In addition, the increase in the diameter of wetted fiber leads to the increase in gas interstitial velocity and the reduction of free sections, which also improves the efficiency due to impaction and interception[27].
2.1.2 Effects of filtration velocity
Fig.5 shows that the variations of pressure drop in the dynamic filtration process at different face velocities for the CNT filter. All the cases have the same liquid aerosols concentration. For understanding clearly, the increase ratio is used as ordinate to demonstrate the changes in pressure drop, as shown in Fig.5(a). The change profiles of the pressure drop are a similar shape under different face velocities, as shown in Fig.5(b).The higher the filtration velocity, the more quickly the equilibrium state was reached, and the lower the increase ratio. The increase in face velocity represents the increase in the number of collected liquid particles during the same filtration time. Therefore, the time required to reach the saturation stage reduces. The higher increase ratio represents a larger liquid holding capacity. The holding capacity of liquid of the filter at the saturation state can be reflected by the liquid saturation. The liquid saturation of the equilibrium state is an important parameter which affects the resistance flow and filtration efficiency of the filter. The saturationSis defined as
(2)
whereVliquidis the volume of collected liquid on filter at the equilibrium stage;Vvoidis the void space in the clean filter. The values of saturation are calculated under different face velocities and listed in Tab.2. It reveals that the liquid saturation increases with the decrease in filtration velocity.
Tab.2The saturation at the equilibrium stage at different face velocities

Filtration velocity/(m·s-1)Saturation0.910.3940.640.5140.420.549

(a)

(b)
Fig.5The evolution versus filtration time for different filtration velocities. (a) The increase ratio of the pressure drop; (b) Pressure drop (Cm=1 383 mg/m3)
The air resistance coefficient of the wet filter is also an important parameter, and it can be defined as[24]
(3)
whereRis the air resistance coefficient of the filter, m-2; ΔPis the pressure drop of the filter, Pa;Uis the filtration velocity, m/s;μis the dynamic viscosity of air, Pa ·s;Zis the thickness of the filter, m.
Based on Eq.(3), the air resistance coefficient is calculated, as shown in Fig.6.The resistances of the filter are close under different filtration velocities at the beginning of the experiment. However, the increase rate and the final value at the equilibrium state depend on the face velocity. The value of resistance at the equilibrium stage is higher for lower face velocities. A high velocity leads to less saturation and lower resistance of the filter. However, the high velocity also represents a high pressure drop and high energy consumption.

Fig.6 Resistance coefficient for different filtration velocities(Cm=1 383 mg/m3)
In addition, from the final value of the wet filter at the saturation stage, we conclude that a correlation connecting the face velocity and the resistance of the wet filter,R:

(4)
whereR0is the resistance of the clean filter, m-2.
2.1.3 Effect of particle concentration
The effect of aerosol concentration was investigated, as shown in Fig.7. In these cases, the face velocity was constant and equal to 0.91 m/s. It can be seen that the final value of the increase rate is almost the same for different liquid aerosol concentrations. The time required to

Fig.7 Pressure drop evolution for different oil acid aerosol concentrations (U=0.91 m/s)
reach the equilibrium stage increases with the decrease of the aerosol concentration. A possible reason is that a higher concentration represents a larger trapped amount of liquid aerosol particles during the same time period. The aerosol concentration has no influence on the resistance of the wet filter at the saturation state because there is the same final pressure drop at the equilibrium state.
2.2 Droplet collection
2.2.1 Collection efficiency profile
Fig.8 shows the change of the filtration efficiency of different sizes of liquid aerosol particles. During this test, the mass concentration and face velocity were maintained at constant at 1 383 mg/m3and 0.91 m/s, respectively. It can be seen that the most penetrating particle size (MPPS) is approximately 80 nm. The MMPS of the CNT filter is smaller than that of traditional materials. The reason is that the MPPS was moved towards a smaller diameter by reducing the fiber diameter[11].The filtration efficiency of the CNT filter reaches 99.92%. The efficiency of the CNT filter at MPPS (less than 300 nm) is 99.99%, which is higher than that of the HEPA standard filter (99.97%).
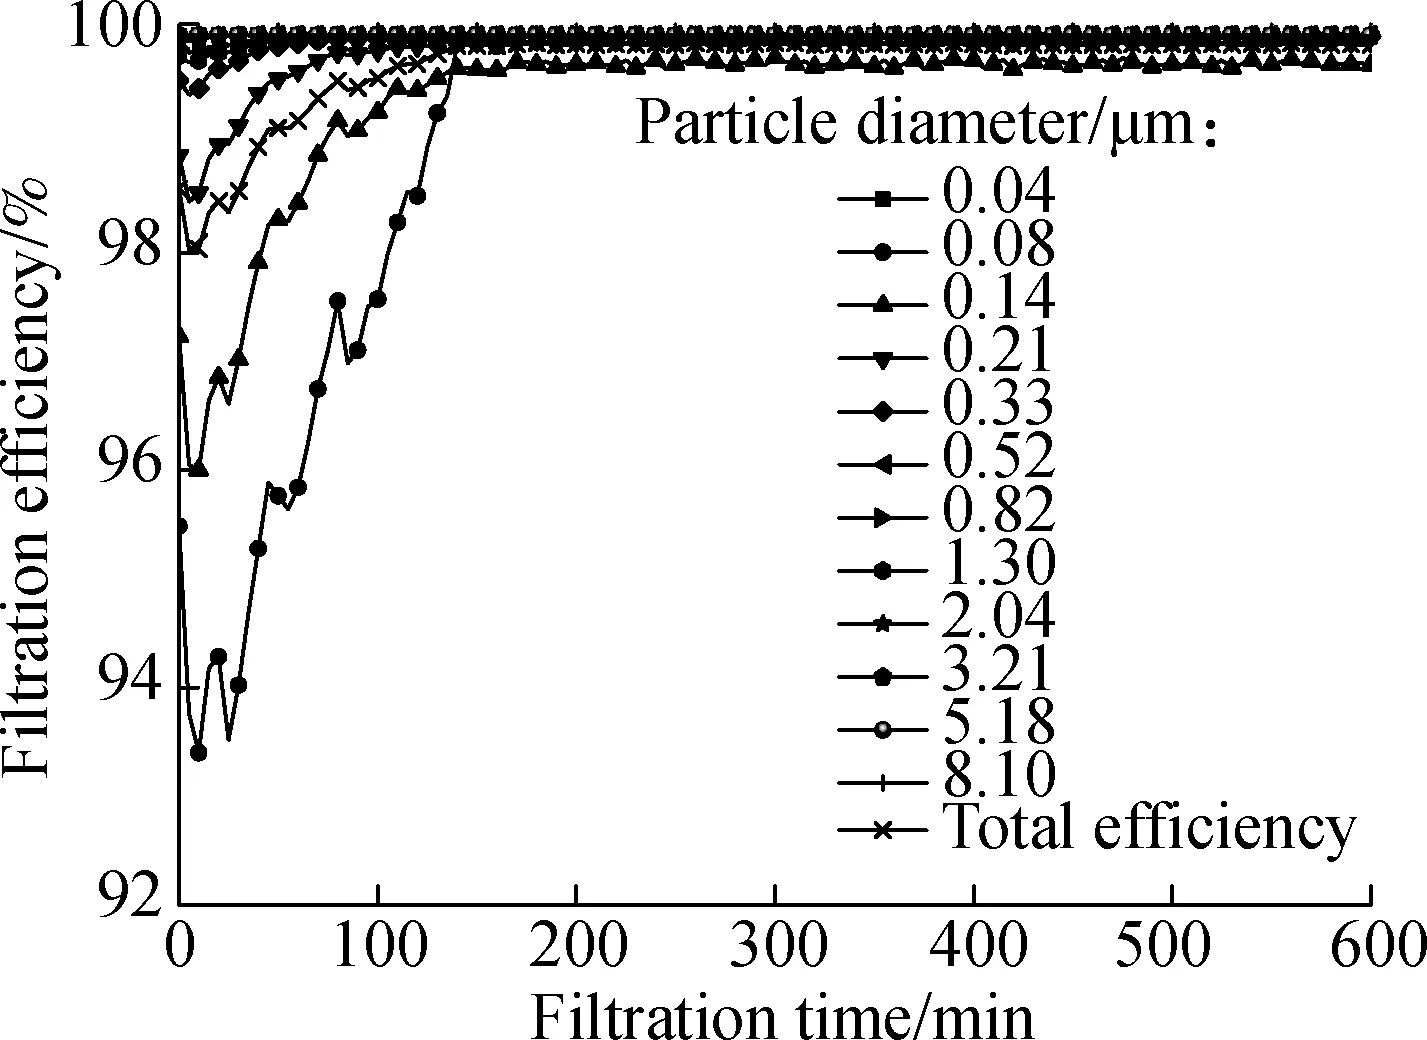
Fig.8 Filtration efficiency evolution for different particle diameters (Cm=1 383 mg/m3,U=0.91 m/s)
For the particles with a diameter of about 40 nm, the filtration efficiency is close to 100% during the test. The prevailing capture phenomenon for 40 nm particles is the diffusion mechanism. The efficiency of diffusion is related to the dimensionless numberPe(Peclet number). The Peclet number has a negative impact on the efficiency of diffusion, which is an increasing function of the fiber diameter[28]. As the fiber size decreases to nanometer-scale, the captured efficiency was calculated and was close to 100% based on the classical diffusion formula[26]. In addition, owing to the excellent lipophilicity, the surface force perhaps improves the capture efficiency for small particles.
For the particles with the diameter of 80 to 210 nm, there is a significant fluctuation at the beginning of filtration. For the particles in this range, the main capture mechanisms are diffusion and interception[29]. With the filtration processing, the packing density of the filter increases due to the accumulation of oil droplets. It induces a reduction in the empty space of the filter and consequently an increase in the gas velocity. When the packing density of the filter increases, the efficiency by interception also increases[27]. However, the increase in gas velocity has a negative impact on the efficiency by diffusion. From the change tendency of efficiency, it can be concluded that the diffusion mechanism dominates the efficiency at the beginning of the test, and with the further increase in velocity, the diffusion and interception dynamically alternate, and the interception makes a greater contribution to the efficiency finally. It is noted that the fluctuating range declines with the increase in particle size. This demonstrates that the effect of diffusion increases with the decrease of particle size, which is consistent with the classical theory[28].
For particles with the diameter greater than 210 nm, the mechanism of interception and impaction dominates the efficiency. The increase in gas velocity improves the efficiency caused by the two mechanisms. In addition, the change of the collection area also influences the efficiency and leads to the fluctuation of the curve, which is mentioned above. For the particles whose diameter is larger than 1 μm, the particle size is larger than the pore size of the filter. Its efficiency reaches 100% during the entire process.
2.2.2 Effect of filtration velocity
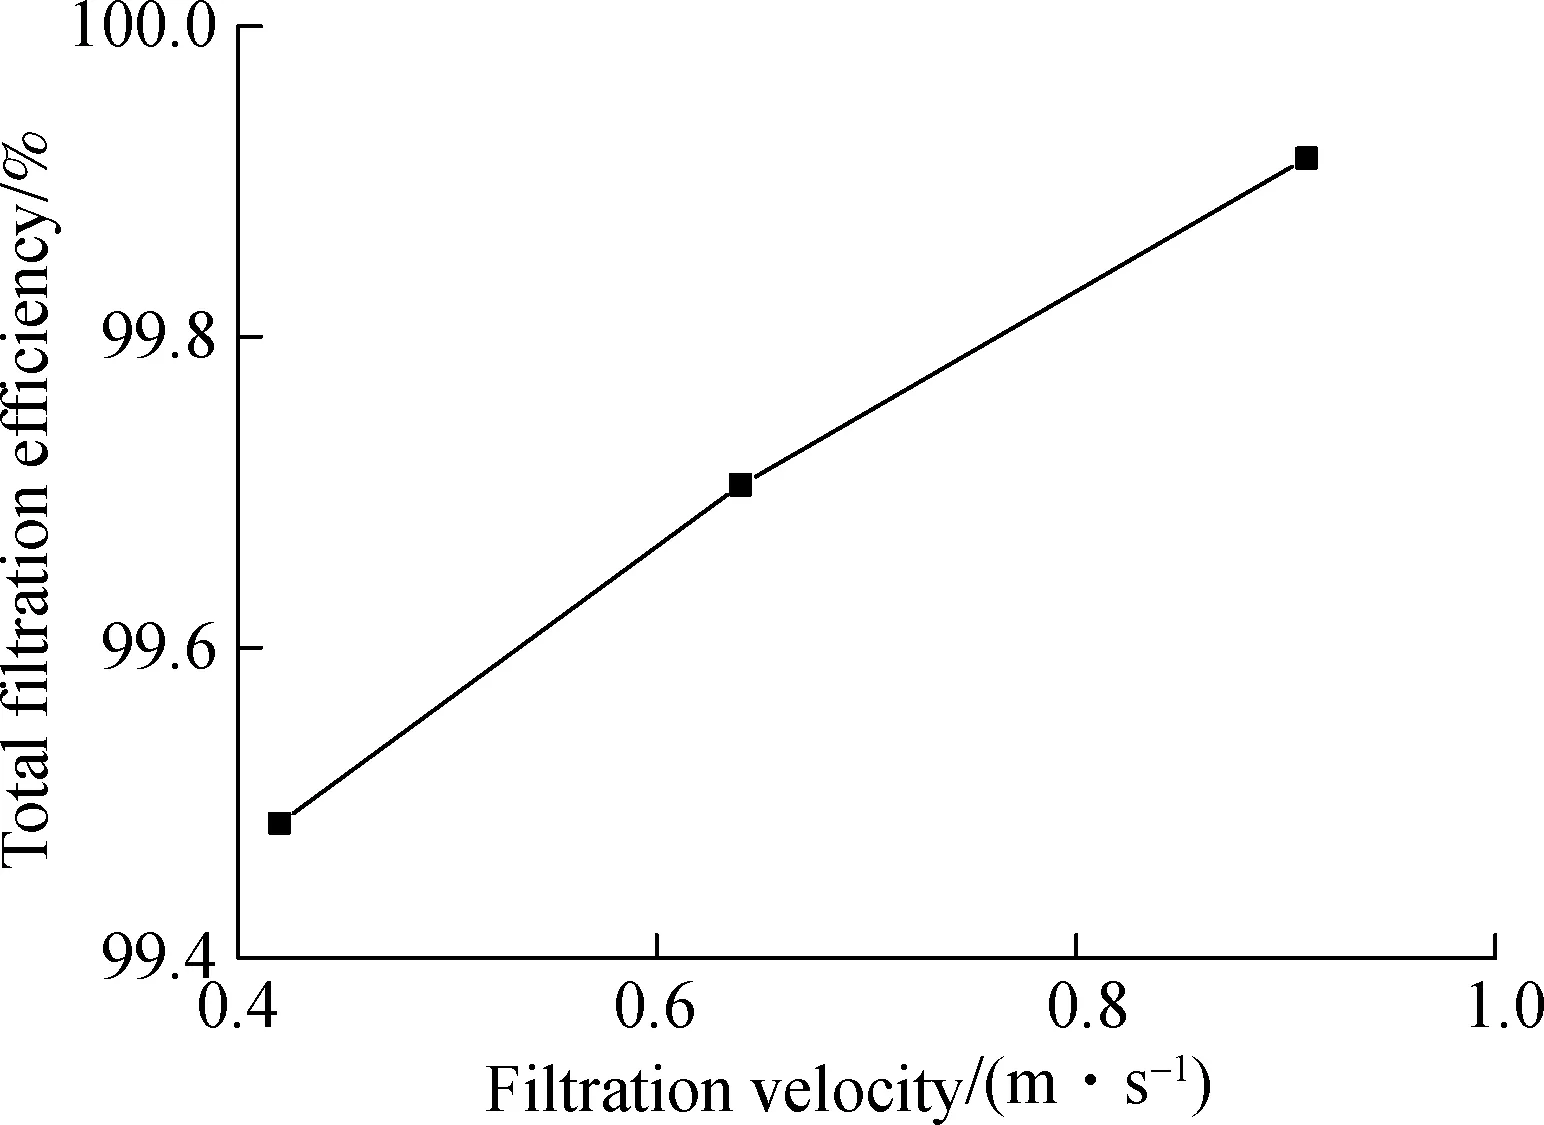
Fig.9 shows that the effect of face velocity on the efficiency at the saturation stage. Although the gas velocity has a negative effect on the efficiency caused by diffusion, the total collection efficiency increases with the enhancement of face velocity for the particles with the diameter of 0.08 to 0.52 μm, as shown in Fig.9(a). This result indicates that the improvement of interception efficiency is larger than the declination of diffusion efficiency by enhancing the face velocity. In addition, the total number efficiency is proportional to the face velocity, as shown in Fig.9(b). The results indicate that the increase in face velocity makes a remarkable improvement for capturing small particles. Moreover, the efficiency at 0.82 μm has a significant slope, which can be attributed to re-entrainment.

(a)
(b)
Fig.9Filtration efficiency for different filtration velocities at the saturation stage. (a) Efficiency with different particle sizes; (b) Total efficiency(Cm=1 383 mg/m3)
2.2.3 Effect of aerosol concentration
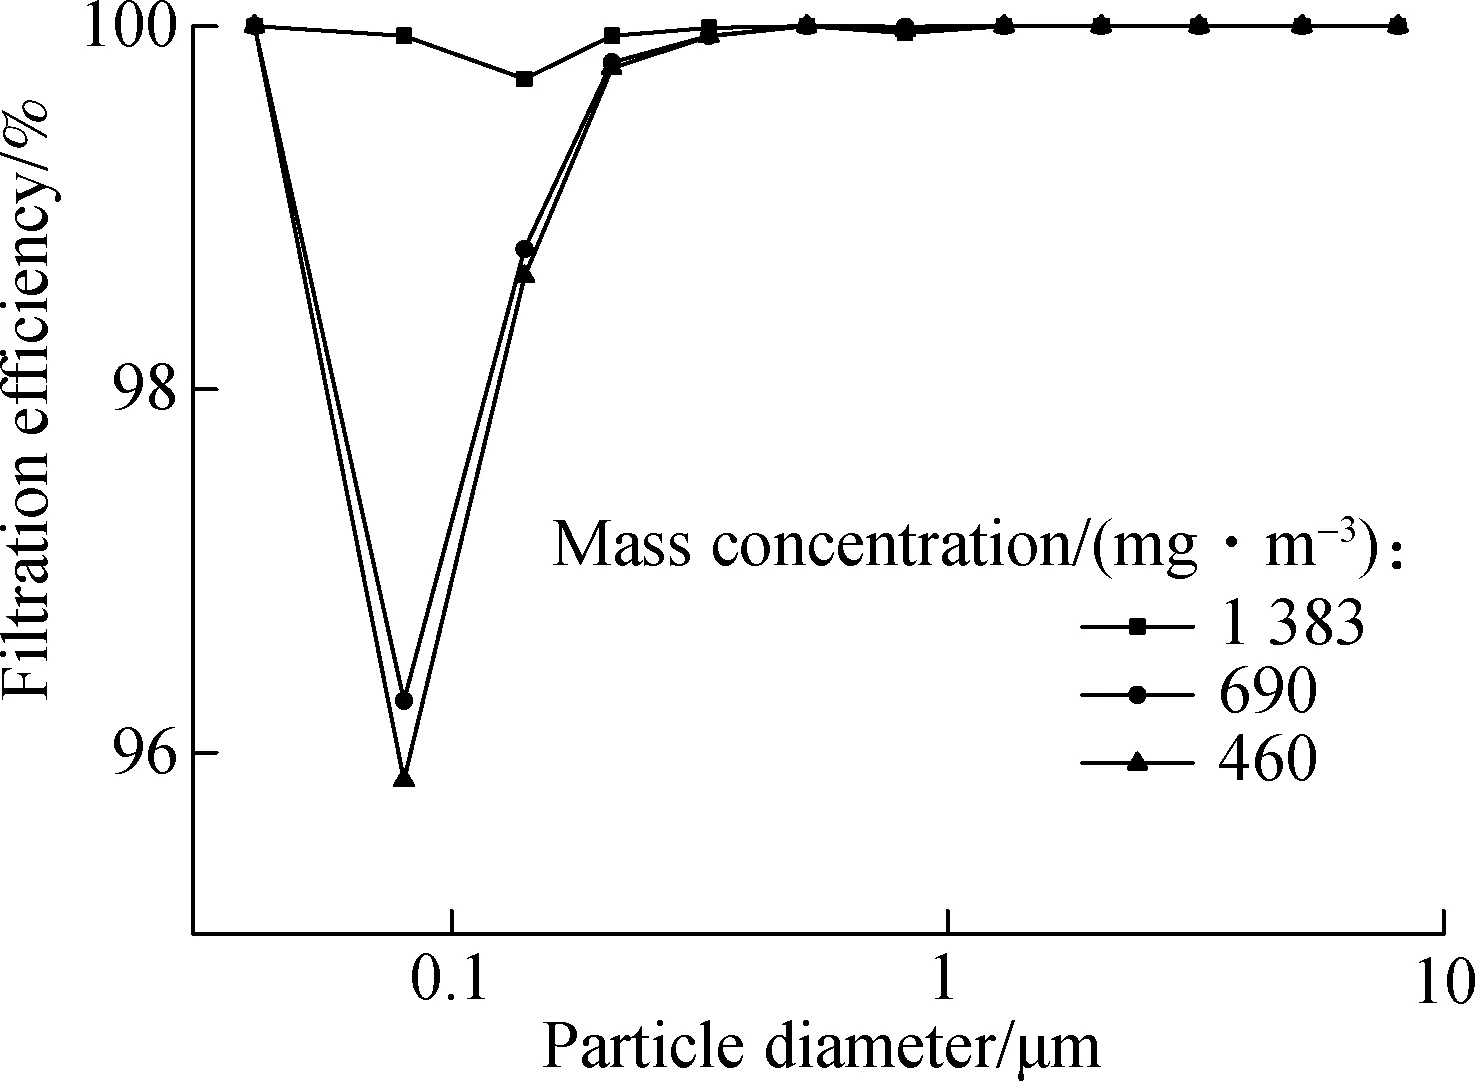
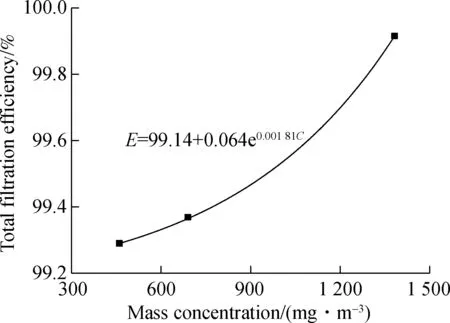
The effect of liquid aerosol concentration on the filtration efficiency is illustrated in Fig.10. The face velocities are the same in those cases. It can be seen that the efficiency increases especially at small particle diameters for mists with higher concentration. A possible reason is that the increase in concentration improves the change of collision. The increase in the collision probability leads to the coalescence of particles and the declination of the concentration of small particles, which is confirmed by Fig.10(b). The efficiencies at two low concentrations are about 99.3%. When the aerosol concentration increases significantly, the total efficiency is enhanced from 99.3% to 99.9%. This result clearly shows that the collision probability is greater at higher particle concentration. In
(a)
(b)
Fig.10Filtration efficiency for different aerosol concentrations at the saturation stage.(a) Efficiency with different particle sizes; (b) Total efficiency (U=0.91 m/s)
addition, an exponential relationship between the total efficiency and aerosol concentration is fitted and shown in Fig.10(b).
3 Conclusions
1) For the carbon nanotubes composite filter, the evolution of pressure drop can be divided into two stages. The pressure drop increases linearly before the saturation stage, which is different from the exponential increase of typical filters, and the raise ratio is only 2 times. At the beginning of filtration, the redistribution of liquid on the filter induces the change of the contact area and leads to the fluctuation of the efficiency curve.
2) The higher the face velocity, the more quickly the equilibrium state is reached, and the higher the filtration efficiency. However, higher face velocity represents the greater initial pressure drop of clean filters. Therefore, the choice of filtration velocity needs to consider the integrated effect between pressure drop and efficiency.
3) The change of aerosol concentration has no effect on the final pressure drop at the equilibrium stage. The time required to reach the equilibrium stage increases with the declination of aerosol concentration.
杂志排行
Journal of Southeast University(English Edition)的其它文章
- Projection pursuit model of vehicle emission on air pollution at intersections based on the improved bat algorithm
- Effect of waste concrete with different strengthon mechanical properties of recycled fine aggregate mortar
- Tensile behaviors of ecological high ductility cementitious composites exposed to interactive freeze-thaw-carbonation and single carbonation
- Travel time prediction model of freewaybased on gradient boosting decision tree
- Image denoising method with tree-structured group sparse modeling of wavelet coefficients
- Delay-performance optimization resource scheduling in many-to-one multi-server cellular edge computing systems
