The Marking Technology in Motion Capture for the Complex Locomotor Behavior of Flexible Small Animals (Gekko gecko)
2019-09-27ZhouyiWANGWeijiaZONGBingchengWANGJunjieZHUKaiQINandZhendongDAI
Zhouyi WANG, Weijia ZONG, Bingcheng WANG, Junjie ZHU, Kai QIN and Zhendong DAI*
1 Institute of Bio-inspired Structure and Surface Engineering, Nanjing University of Aeronautics and Astronautics, 29 Yudao Street, Nanjing 210016, Jiangsu, China
2 Shanghai Institute of Aerospace System Engineering, 3888 Yuanjiang Road, Shanghai 201109, China
Abstract Animals have evolved a variety of behavior patterns to adapt to the environment. Motion-capture technology is utilized to quantify and characterize locomotor behaviors to reveal the mechanisms of animal motion. In the capture of flexible, small animals with complex locomotor behaviors, the markers interfere with each other easily, and the motion forms (bending, twisting) of the moving parts are obviously different; thus, it is a great challenge to realize accurate quantitative characterization of complex locomotor behaviors. The correlation between the marker properties, including the size and space length, and the precision of the system are revealed in this paper, and the effects of diverse marker shapes on the capturing accuracy of the captured objects in different motion forms were tested. Results showed that the precision of system is significantly improved when the ratio of the space length to the diameter of the markers is larger than four; for the capture of the spatial twisting motion of the flexible object, the hexagon markers had the lowest spatial lost-marker rate relative to the circle, triangle, and square. Customized markers were used to capture the locomotor behavior of the gecko-inspired robot (rigid connection) and the gecko (flexible connection). The results showed that this marking technology can achieve high accuracy of motion capture for geckos (the average deviation was approximately 0.32 mm, and the average deviation’s variation rate was approximately 0.96%). In this paper, the marking technology for the motion capture of flexible, small animals with complex motion is proposed; it can effectively improve the system precision as well as the capture accuracy, and realize the quantitative characterization of the complex motion of flexible, small objects. It provides a reliable technical means to deeply study the evolution of the motion function of small animals and advance systematic research of motion-capture technology.
Keywords small flexible animals, marking technology, motion capture, quantification of locomotor behavior, gecko
1. Introduction
Animals have evolved a variety of behavior patterns (flight, swimming, running) to adapt to the environment (Deetjenet al., 2017; Hoytet al., 1981; Webb, 1984). These behavior patterns reflect the internal structures and functional components of the entire motion system, as well as its interaction with the environment. Locomotor behavior is an external representation of the interaction of these motion systems and intrinsic properties (Dickinsonet al., 2000). Motion-capture technology is the most intuitive method for quantitative representation of locomotor behavior; it can obtain various kinematic parameters such as the speed, acceleration, and trajectory of animal motion (Gleicher, 1999; Xianget al., 2013). Therefore, the systematic advancement of motioncapture technology provides powerful technical support for the revelation of coordination mechanisms of animal motion components, which aids understanding of the development of animal movement function and inspires the design of new biomimetic robots. In recent years, motion-capture technology has been systematically developed from system layout (camera layout (Liet al., 2008; Yuanet al., 2009), scene planning (Mittalet al., 2004)), data acquisition and processing (camera calibration (Heikkilaet al., 2002; Wanget al., 2007), data processing (Shenget al., 2009)), object recognition and tracking (markers feature (Alexandersonet al., 2017), tracking algorithm (Jr, 2003)), and many other aspects. Marker-based technology and markerless technology are generally used for object identification and tracking. Markerless technology simplifies the marking process of the experiment and avoids the impact of the markers on the object’s motion. However, it has higher requirements for the object structure and the capturing environment, and it is typically used for 2D joint kinematics indoors (Sureret al., 2011). At present, marking technology is still used extensively. The capturing accuracy of the objects according to the data acquisition mode based on markers depends on the recognition and tracking of the markers, and the recognition and traceability of the markers on the objects should relate closely to the shape, size, color, numbers, placements, etc. (Hedrick, 2008; Medina-Carniceret al., 2009).
In the motion capture of human limb joints, markers with diameters of not less than 10 mm are placed at each joint (Menache, 1999). In the study of human pelvic stress deformation, 80 markers of 6.5 mm in diameter are used (Göpfertet al., 2011). A total of 79 markers of 6.5 mm diameter are adopted to capture human facial motion (Sifakiset al., 2005). It can be seen that the size and number of the selected markers are closely related to the feature size and complex structure of the captured objects. In addition, studies show that the obtained capture accuracy is quite different (Eichelbergeret al., 2016) despite the two markers adopted for motion capture in different body parts (hip joint, knee joint and foot) having the same diameter and fixed spacing. The large size of the markers allows for a higher accuracy of the motioncapture system through motion-capture tests for different diameter (9.5 mm, 15 mm, 25 mm) markers (Windolfet al., 2008). In particular, the precision in capturing fine movement is significantly affected by the size of the marker (Smith, 1997). According to another study, by testing the system precision with different space lengths between two fixed-size markers, the space length resulting in the error recognition of the motion-capture system is 10 mm (Milleret al., 2002; Richards, 1999). Therefore, the size and relative position of the markers has a significant effect on the lost-marker rate and accuracy of the motioncapture system.
Currently, the researches on marking technology in motion capture systems are generally targeted towards large/medium-sized captured objects with a fixed relative marker position. There are insufficient studies on the complex locomotor behavior of small-sized, flexible animals. For geckos with the characteristics of adhesive climbing movement (Wanget al., 2015a; Wanget al., 2015b), the accurate capture and quantification of their movement is of great importance to reveal the mechanism of adhesion movement and the evolution of movement function. However, the gecko has a small-sized body, great flexibility, and agile locomotion, resulting in the locomotor behavior with higher complexity. For example, the high joint overlap in motion leads to easy interference of joint markers, and the motion amplitude (plane bending, spatial twisting) of various moving parts is obviously different (Wanget al., 2018; Zonget al., 2018). The marking technology faces new challenges in the complex behavior of flexible small animals: how do we mark so that the markers in the motion capture are highly recognizable and do not interfere with each other to achieve the accurate capture of complex movements of the animal? Specifically, what is the principle of selection of the marker on small animals’ joints? With a great flexible moving part, how do we determine the discrete position of the markers on it to accurately capture and characterize its locomotor behavior? Does the marking method need to be adjusted to the different locomotor behavior of each body part?
With respect to these issues, this paper attempts to promote the development of marking technology and provide a more accurate, stable, and reliable technical support to accurately capture the adhesion movement of flexible geckos by means of studying the size, relative position, and shape of the markers on the objects. In particular, the motion capture for different shapes of marker on flexible motion objects was tested, and the marker shape which is the optimum to improve the capture accuracy for complex locomotor behavior of flexible targets is proposed. Aiming at two objects of the gecko-inspired robot (rigid connection) and the gecko (flexible connection), the size, shape, and relative position of the markers were customized. The capture results of different markers on these two kinds of objects were compared and analyzed. The effectiveness and applicability of the customization-based marking technology were verified. The marking technology for flexible, small animals with complex locomotor behavior was advanced and the systematic study of motion-capture technology was improved and perfected.
2. Materials and Methods
2.1. Experimental equipment and setupThe self-built motion capture system (Figure 1) in this study comprised of four motion capture cameras obtained from OptiTrack Ltd., USA, (Prime 17 W, 200 FPS), markers, motion plane, data acquisition and processing software, signal transmission equipment, and a camera-fixed frame. The size of the motion plane was 700 mm × 550 mm within a three-dimensional force-measuring platform (300 mm×100 mm) in the inter-position (Daiet al., 2011) while the camera-fixed frame was approximately 820 mm×900 mm×400 mm. Data acquisition and processing were carried out using motion analysis software and DLTdv6 tools.
The motion capture system was configured and deployed based on the shape and locomotive range of the experimental objects including small animals with a large range of locomotion and gecko-inspired robots (Zonget al., 2018). The experimental platform was 3.85×105mm2in area. Because the shape of geckos and robots were similar to flat and long squares and the range of their motion was in a long channel, a half-annular layout was suitable for the experimental procedure. Because of the limited size of the platform and camera-fixed frame, the working distance was determined to be about 500 mm; the pitch angleαwas 30° ± 5°, the camera angleθwas 30° ± 5°; the motion length of the gecko was ~300 mm. The platform was placed horizontally, and the fourcamera system was focused on the one-third position of the 300-mm length (Figure 2).
2.2. System calibration and data acquisitionA halfannular layout of the multi-camera was employed, and circular markers were used to calibrate the motion capture system to determine the relative positional relationship between the cameras, the positional relationship between each camera and the ground plane, in order to reconstruct the three-dimensional coordinates of the markers in space (Heikkila and Silvén, 2002). To compare the responses of different marking techniques for different modes of data acquisition, two kinds of data acquisition modes were used for the camera calibration experiment. a) Post-processing calibration based on image acquisition mode: the movement of the calibration bar (three fixed markers on the same line) in three-dimensional cartesian coordinate system were recorded by the multiple cameras (Figure 3A). The image processing software and the calibration algorithm program were used to calibrate the cameras so that the data could be edited appropriately to obtain optimized calibration results (Hedrick, 2008). b) Automatic calibration based on the object acquisition mode: the object acquisition mode was used to obtain the stable motion of the calibration bar within the intersecting volume of the cameras’ field of view (Figure 3B) so that the computer could automatically obtain the available data required to obtain the calibration results. An L-shaped calibration plate (which consists of three markers arranged at planar right angles) was then used to determine the position of the camera relative to the ground.
To explore the effects of different marker sizes and their relative positions on the accuracy of the motion capture system, the ratio of the diameter of two markers to their space length (P)was defined. A calibration bar was then designed to freely adjust the space length of the markers in Figure 4A and the circular markers with different sizes (3 mm, 4.5 mm, 6 mm, 7.5 mm, 9 mm) (Table 1). By comparing the average standard deviation rate (ASDR)of the system calibration for a series ofPvalues (1, 1.5, 2, 3, 4, 5, 6), the correlation between thePvalues and the accuracy of the motion capture system was obtained. In the same vein, the correlation between the size of the markers and the accuracy of the capture system could also be obtained by comparing the root mean square error (RMSE) of the markers of different diameters in the same space length.
2.3 Experiments
2.3.1. Motion-capture experiments of a flexible object
To simulate and verify the multi-dimensional complex motion (spatial twisting and plane bending) of the object in space, a rod with high elasticity (E= 1.2 GPa) was selected (Figure 4B). Because the system’s tracking identification was based on pixel matching, a set of pixels were used as the marker. The space length (L) between two markers was related to the maximum contour spacing (S). Four identical shapes of markers were selected in the experiment and the maximum contour spacing (S) was the same (Table 2). To compare the effect of different marker shapes on the capturing effect of different motion forms, 10 markers of the same shape were attached to a generatrix of the flexible rod at equal intervals, thereby replacing the shape of the markers. The experimental process involved plane bending (similar to the swinging motion of theGekko gecko’s spine and tail) and spatial twisting which occurs by fixing one end of the rod and moving it around the fixed end (similar to the movement of theGekko gecko’s legs). It was ensured that all markers on the flexible rod were within the focus of the multicamera system. However, this research did not discuss the color of the markers, as there were no difference in the recognition and tracking of the marker’s color by the different data-acquisition modes. Therefore, the color of the marker had no effect on the accuracy of the system.
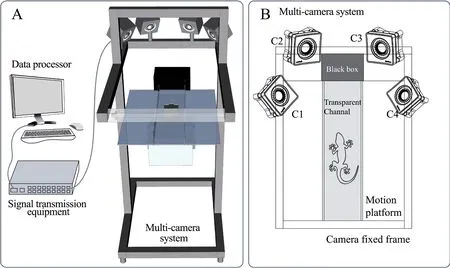
Figure 1 The self-built multi-camera motion-capture system.
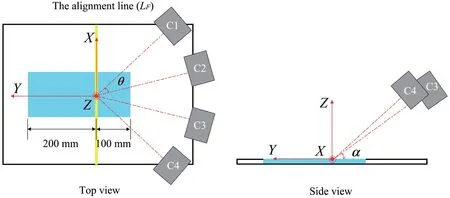
Figure 2 The multi-cameras in a half-annular layout pattern.
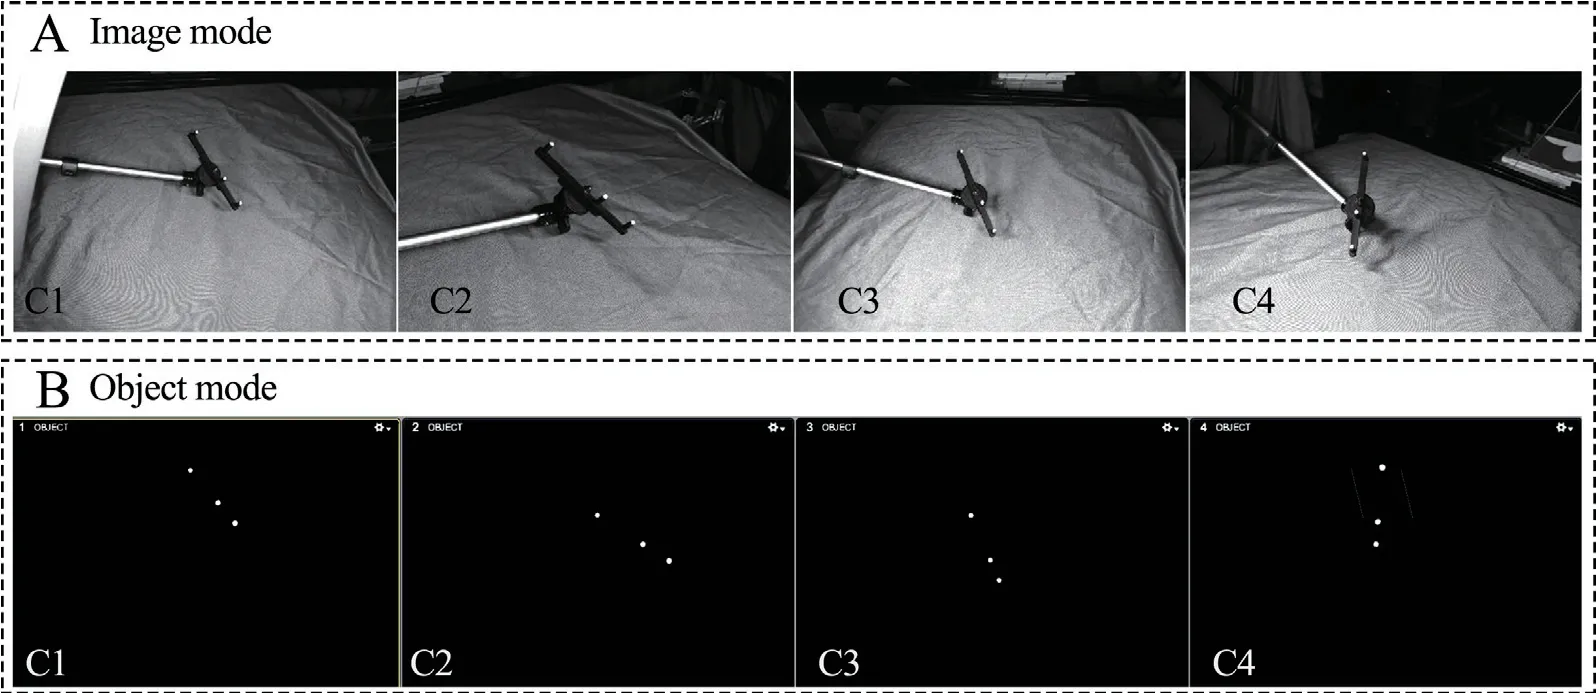
Figure 3 A: Post-processing calibration based on image mode; B: Automatic calibration based on object mode (white points were markers, black was background).
2.3.2. Motion-capture experiments of gecko and gecko-inspired robotGecko: Three geckos (Gekko gecko, Linnaeus) (N= 3, mass: 60.5 ± 5.2 g, snout-vent length: 141.2 ± 3.2 mm, tail length: 140.4 ± 8.3 mm, mean ± s.d.) were obtained from a gecko feeding base in Guangxi Province, China for use in the experiment. The animals were kept in an artificial chamber with controlled humidity (65%-75%) and temperature (26 ± 2 °C). The markers were attached to the geckos’ snout, head, cervical vertebrae, caudal vertebrae, tail, and limbs (hip, knee, ankle) (Figure 5A). Four shapes of markers (circle, hexagon, square and triangle) were then marked on the joints of the limbs respectively.
Gecko-inspired robot: This was a robot mimicking the gecko’s sprawling structure. The rigid body system was constructed of a bilaterally symmetrical aluminum-alloy structure (overall size: 358 mm×189.4 mm×55 mm, thigh length: 50.35 ± 0.35 mm, crus length: 60.2 ± 0.48 mm, mean ± s.d.). Four types of markers were attached to the thigh rotating joint-R1, the crus rotating joint-R2, and the wrist joint-R3 of the gecko robot (Figure 5B).
2.4. Data filteringIn this research, 336 sets of calibration trials with different markers and spacing lengths were carried out, out of which 84 sets of samples were selected for statistical analysis. For 280 trials of the motion capture of flexible object (70 sets of each shaped marker), 48 samples were selected for statistical analysis. Also, 60 sets of verification trials were performed on the gecko and the robot, from which 10 sets of samples were selected for statistical analysis. The number of samples selected accounted for 10%-20% of the total number of experiments, in line with statistical requirements. The movements of the calibration bar and the flexible rod in their respective experiments were close to a smooth uniform motion while the range of motion of all the markers was within the focus of the multi-camera. TheASDRandRMSEof the rigid connection of the two markers in the calibration test were calculated while the lost-marker’s rate in time (TLMP) and spatial lostmarker’s rate (SLMR) of the markers in different motion forms of the flexible objects were also calculated (Support Documents-S1).

Figure 4 A: The self-made calibration bar that can change the calibration markers and adjust the space length (L); B: A rod with high flexibility attached by ten same markers.

Figure 5 Experimental objects with markers A: Gecko; B: Geckoinspired robot.
The experiments involving the gecko and robot moving along a straight line were selected. The velocity was almost uniform and its value was 15% of the average velocity. At least one complete gait cycle was included in the selected video segment, and the motion range of the capturing objects was closest to the center of the volume captured by the multi-camera. The markers on the wrist and knee joints of the right rear leg of the gecko were selected as samples from which the average deviation (AD), average deviation variation rate (ADVR), and trajectory deviation rate (TDR) were calculated (Support Documents-S1). Similarly, the markers on the wrist joint, crus rotating joint and thigh rotating joint of the geckoinspired robot’s right rear leg were selected as samples from which theADand theADVRwere also calculated (Support Documents-S1).
2.5. StatisticsSPSS software was used in the analysis of the samples (SPSS 22.0 version, SPSS Inc., Chicago, IL, USA). Correlation analysis was used to analyze the ratio of the markers’ space length to the diameter and the corresponding system precision (ASDR). Analysis of variance (ANOVA) was also carried out to study the motion capture results of different markers and data acquisition modes on different capture objects (flexible small animal and rigid robot), with the average deviation and the variable rate of the average deviation used as the dependent variables. WhenP< 0.05, the factor variables “capture objects” and “data-acquisition modes” were significant for the dependent variables “capture deviation” and “average deviation variation rate” at 0.05 significance level.

Table 1 Parameter definition of markers.

Table 2 Definition of parameters for four shapes of markers.
3. Results
3.1. Effect of the space length and dimension of different markers on system accuracyTheASDRdecreased with the increase in thePvalue and therefore had a negative correlation with thePvalues (R= -0.65) (Figure 6A). However, it was much larger whenP= 1 was compared withP= 1.5, 2, 3, 4, 5, and 6 (Figure 6). WhenPwas 1.5 and 2, there was no significant difference in the corresponding values ofASDR. WhenPwas 3, 4, 5 and 6, there was also no significant difference inASDR. However whenPwas 5 and 6, theASDRwas near a steady state and was smallest (Figure 6B). In addition, theRSMEof the rigid body calibration experiment decreased as the diameter of the marker decreased (Figure 6C), while theASDRof the marker of 9-mm diameter was 16% higher than that of the 6-mm and 4.5-mm marker diameters.
3.2. Lost-markers’ rate (LMR) of different shaped markers on a flexible objectTheSLMRof the hexagonal marker on the flexible body had the lowest value in the spatial twisting motion. The circular marker had the highestSLMRwhich was 2.21 times theSLMRof the hexagonal marker. The triangular marker had the second highestSLMR, which 7.23% higher than that of the square marker. On the other hand, theSLMRof the square marker was 3.21% higher than theSLMRof the hexagonal marker (Figure 7A). In the same vein, theSLMRof the flexible rod used for bending motion in plane was significantly smaller than that in the space movement. TheSLMRof the bending motion in plane was 2.03%, which was 26.52% smaller than the twisting motion in space. TheSLMRof the hexagonal marker was smallest when the two motion forms were compared. TheSLMRwas 15.58% smaller in the plane motion when compared with the space motion. When the flexible rod performed spatial twisting locomotion, the result was displayed by theTLMRof 10 markers (P1-P2) (Figure 7B) in which the differences in theTLMRof the markers at different placements was maximum. P1 and P2 had the smallestTLMRof 9%. P3-P10 had theTLMRabove 10%. P3 had aTLMRof ~49%. P5 and P6 hadTLMRabove 30% while P7-P10 hadTLMRranging from 25%-30%.

Figure 6 A: The standard deviation rate (ASDR) for different marker diameters (D); B: The ASDR for different P (1, 1.5, 2, 3, 4, 5, 6) values; C: The root mean square error (RMSE) of calibration experiment for different D.

Figure 7 The lost markers rate of different shape markers on the flexible rod. A: The SLMR for spatial twisting motion and plane bending motion for four different shape markers; B: The TLMR of 10 markers on flexible body performing spatial twisting motion.
3.3. Results of motion-capture experiment of gecko and gecko-inspired robotThe average lost-markers’ rate (ALMR) and the average rate of automatic recovery (ARAR) of the gecko were ~90% and ~50% respectively for the object mode, while they were ~25% and ~80% for the image mode (Figure 8B). TheADandADmaxof the gecko in the object mode were 1.75 mm and 3.85 mm respectively, while theADandADmaxin the image mode were 0.32 mm and 0.86 mm respectively. Similarly, theADandADmaxof the robot in object mode were ~0.53 mm and 1.26 mm respectively, while theADandADmaxin image mode were ~0.88 mm and 1.21 mm respectively. Moreover, theADVRof the gecko in the object mode and image mode were 3.46% and ~0.96% respectively, while theADVRof the robot in the object mode and image mode were ~0.58% and 1.24% respectively (Figure 9). There were significant differences between the two data acquisition and processing methods for the capture of the locomotor behavior of gecko (P<0.05), besides, significant differences which were not as obvious as that in gecko were also observed in the movement of the gecko-inspired robot (P=0.047). In addition, there was a significant difference in theADVRcaptured by the gecko in these two ways (P=0.002), whereas theADVRobtained by the two methods did not have a significant difference (P=0.134).
3.4. Trajectory deviation rate of gecko using markers with different shapesIn our previous research, we found that theADVRof the motion capture of the gecko’s leg was significantly larger than that of the head and dorsal parts of the body (Supporting Document-Table S5). Therefore, markers of different shapes were used to capture the movement of the legs. The trajectory of the marker on the gecko’s right rear wrist joint was obtained in image mode (Figure 10A). The results revealed that the circular marker had the highestTDRof ~27%, the square and triangular markers both had the TDR of ~23% and the hexagonal marker had the leastTDRof 16% (Figure 10B). However, there was no significant difference in theTDRobtained by the gecko-inspired robot using four markers with different shapes (Figure 10B).
4. Discussion
4.1. Customization of marker size and placement for flexible small animal’s motion captureThe selection of the diameter of the markers for small-sized animals at a fixed joint position could be guided through this study. Some studies carried out motion-capture tests on two markers with different dimensions (50, 40, 30, 20, 10, 0 mm) and proposed that the higher the spacing, the higher the recognition degree of the markers, and that the minimum spacing between two markers that can be identified automatically is 10 mm (Richards, 1999). In addition, studies have been conducted on markers with different diameters (9.5 mm, 15 mm, 25 mm), suggesting that the larger marker size had a higher capture accuracy (Windolfet al., 2008), and that the marker size may be a determining factor in the capture of very fine movement (Smith, 1997). The calibration testing results of the markers of different sizes with the same space lengthLdemonstrated that small-size markers were more conducive to improving the capture accuracy of the system (Figure 7). This was mainly because the small size of the capture object inevitably leads to a shorter space length of the markers, which results in mutual interference and occlusion. In this manner, the recognition of the markers is reduced. Therefore, the size and space length of the markers can be regarded as two interrelated key factors of the precision of a system. Of course, the best possibility is to maximize the size of the markers while ensuring that the two markers are identifiable. Therefore, this paper explores the relationship between the size of the markers and their space length. According to the results of the calibration tests under differentPvalues, whenPwas larger than four, the system had the best capture accuracy (ASDRwas approximately 1.48%). The size of the joints of small-sized animals was very small. For example, the length of the thigh of the gecko was approximately 22.5±0.8 mm, and the maximum outer contour spacing (S) of the markers should be 1/5 of the thigh length.
The motion capture of animals’ highly flexible moving parts could be further guided by the results of studies on the relationship between the different space lengths and sizes of the markers. Locomotor behavior of highly flexible parts was required to determine the discrete positions of the markers on them to accurately capture and characterize their motion. For example, for multi-joint movements such as of the gecko spine and tail, the multijoint segmentation method could be attempted (Figure 11): the overall structure was discretized into a number of rigid segments (Book, 1984);nmarkers (M1, M2, ..., Mn) were used to perform equidistant segmentation according to the linear distance (l); each segment (Mi-Mi+1) approximated a rigid body as a single module for the entire multi-joint connection. The corresponding marker size was selected based on the segment length.

Figure 8 A: Schematic diagram of the lost marker and the retrieving marker; B: The average lost marker rate ALMR in the object mode and image mode and the automatic retrieve accuracy rate ARAR of the marker on gecko wrist joint.

Figure 9 Comparison of AD and ADVR of gecko and robot. A: The AD of gecko; B: The AD a of robot; C: The ADVR of gecko; D: The ADVR of robot.
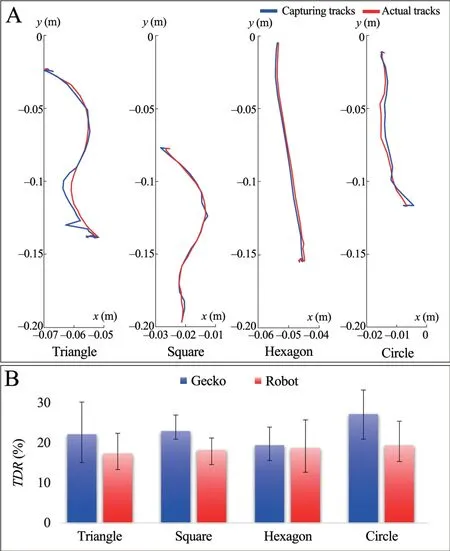
Figure 10 Capture trajectory results of gecko and robot under different shape markers. A: Comparison of typical trajectories of geckos using different shape markers for motion capture; B: The TDR of different shape markers in gecko and robot motion-capture experiments.
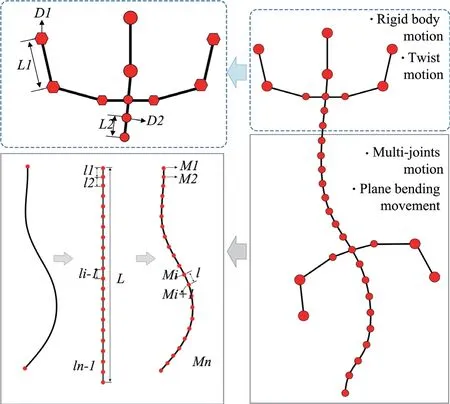
Figure 11 Abstract schematic diagram of the selection and placement of markers for small-sized and complex moving small animals (Gecko) motion capture (bottom left: Segmentation processing diagram of multi-joint tandem structure right: Large gecko body is defined according to different joint lengths and movement patterns Different points).
4.2. Customization of marker shape for small-size and complex motion’s captureThe behavior characteristics of different parts of small animals are quite distinct. This paper attempts to improve the capture accuracy of complex space motion by changing the shape of markers. For example, the locomotion of the gecko’s legs was the twisting movement in space, and the movement range was large; thus, the markers on the joint position of the leg were easily blocked. In contrast, the locomotion of the spine and tail was mostly plane-bending deformation motion, which is very different from the motion of a rigid connected object. This paper explores the influence of the shape of the marker on the motion capture of the gecko. Flat markers made of reflective material were used to eliminate the influence of the space volume of the marker on the motion capture. In addition, although the shape of the markers varied, four shapes, namely circle, hexagon, square, and triangle, were selected in this work. Since the principle of motion tracking was based on the center position of the markers, these four shapes were guaranteed to have a center of symmetry in nature, and they were able to be represented as typical shapes.
The effect of marker shapes on the capture accuracy of different motion forms (plane bending and spatial twisting) of flexible targets was tested. TheSLMRof hexagonal markers in complex motion was only 16.24%, which is smaller than those of the other three shapes, and the value of the circular markers was as high as 35.82% (Figure 7A), which is most likely caused by the principle of marker recognition and tracking. In software recognition and analysis, markers were characterized by a collection of pixel points (Gleicher, 1999), and the recognition of markers was related to image sharpness. The greater the number of pixels per unit area, the higher the resolution and image sharpness. Regarding the largesized marker, the shape had no effect on the success rate and accuracy of motion capture (diameter of larger than 6.4 mm (Smith, 1997)). However, the experimental hardware system (camera resolution, etc.) and capture objects (point size, position, etc.) often had constraints; in the case of small-size markers, limited resolution was a constraint (the maximumSin this study was 4.5 mm and the camera resolution was 200 FPS). The markers were represented by a small number of pixels, and then the edges of the image and the grayscale transition become clear (Schavemakeret al., 2001). The contours of the markers in the image affect the recognition and tracking of the marker in the system. At this time, the results of motion capture using different shaped markers differed. Therefore, this paper proposes that the selection of marker shape could help to improve the capture effect (lowering the lost marker rate and improving the accuracy) for small-size, flexible objects, and the motion-capture experiment on the gecko verified that the hexagon marker achieved the smallest trajectory deviation rate (18.99%).
4.3. Motion-capture acquisition mode selection for different objectsData acquisition methods generally include the object mode and the image mode. Object mode can quickly obtain the kinematic parameters of the object by image binarization, which is mostly limited to the motion representation and dynamics modeling of rigid body systems (human body, large animals) (Carseet al., 2013; Hutchinsonet al., 2006; Qinet al., 2008). Image mode obtains the video sequence containing a large amount of animal motion information through continuous capture and recording of motion behavior (Fanet al., 2011; Huang, 2004; Luoet al., 2002); in particular, it has good inclusiveness and adaptability to complex locomotor behavior, and is thus widely used in animal locomotor behavior research (insects, etc.) (Miller, 2017). The object mode can generate kinematic data in real time and realize automatic detection, automatic calculation, and transmission, and the original 3D data acquisition can be obtained without human operation. The image mode adopts an intelligent algorithm for image processing and prediction tracking, and has a low lost-marker rate, high capture accuracy, and low acquisition requirements for equipment relative to the object mode (see Figure 8B). Therefore, this method can clearly and accurately obtain parameters such as motion trajectory, and has been applied to the capture of many complex motions (moth, mosquito, etc.) (Zhenget al., 2013).
TheADof the gecko in the object mode was more than twice that in the image mode. TheADof the gecko robot in both acquisition modes was small. In addition, theADVRintuitively indicates the stability of motion capture: the smaller the variation value, the higher the stability. Therefore, the image mode had a great advantage in the stability of the gecko motion capture (Figure 9C). For the rigid body system, theADVRof the object mode was approximately 50% smaller than that of the image mode (Figure 9B). Thus, the object mode had an advantage for rigid-body motion capture. It is obvious that the case of losing markers also occurs in image mode. Probable reasons are as follows: a) the markers were occluded; b) there was interference from surrounding noise; and c) the marker brightness or size was lower than the set threshold. Improvements can be made from some aspects as follows: by improving the tracking algorithm, adopting the human eye recognition, and increasing the recognition threshold (this threshold can be set according to the size of the markers and the surrounding environment).
5. Conclusions
Animals have evolved a variety of behavior patterns to adapt to the environment. For the complex locomotor behavior of flexible small animals--Gekko gecko, our group have systematically studied the motion-capture technology from the perspective of multi-camera structure configuration, marker recognition and tracking, and data acquisition and processing, and attempted to upgrade the motion-capture system by the matching of multi-camera layout pattern, optimization of marking technology, selection of data acquisition, processing method, etc. This work focused on advancing marking technology, improving the high accuracy of motion capture of the target from the shape, size, position, and other aspects of the marker. The design principle of markers size and relative position in the marking technology was revealed through calibration tests under different combinations of markers space length and size. It was found that for the motion-capture system utilizing small-size markers, the system precision not only relied on the sizes and placements of the markers, but also on the shapes of the marker. In the experiment of the gecko and geckoinspired robot, the use of customized markers greatly improved the accuracy and stability of motion capture of the gecko. This paper has perfected the marking technology for complex motion capture of flexible, small animals, providing a more precise technical method for the quantitative characterization of animal locomotor behavior. It provides a more reliable technical support for the study of the locomotor behavior and the movement function of small-size, flexible animals with complex locomotion behavior.
Ethical StatementsThis manuscript adheres to the appropriate reporting guidelines and community standards for data availability. This manuscript has not been published or presented elsewhere in part or in entirety. All contributing authors are aware of and agree to the submission of this manuscript. All study participants provided informed consent, and the study design was approved by the appropriate ethics review boards. This study was carried out accordance with the Guide of Laboratory Animal Management Ordinance of China. The experimental procedures were approved by the Jiangsu Association for Laboratory Animal Science (Jiangsu, China).
AcknowledgmentsWe would like to thank Donghao SHAO to help to translate and modify this manuscript. We are grateful to Hao WANG for his guidance at the start of this study. We also need to thank the Department of Biology of University of North Carolina at Chapel Hill for the opening the software system for video processing. This work was funded by the National Natural Science Foundation of China (Grant Nos. 31601870 and 51435008), Natural Science Foundation of Jiangsu Province, China (Grant No. SBK20160800 to Zhouyi WANG) and Jiangsu Provincial Key Laboratory of Bionic Functional Materials.
Appendix

Table S1 Parameter definition and the abbreviation.
Object acquisition mode: Generally, at least 2 cameras were selected to binarize the image. There were only white markers and black background on the screen. At the same time, the 3D position of the markers in space were directly obtained (Figure S1A). The 3D coordinate data can be directly exported; the image acquisition mode: real-time continuous video information of the target scene (Figure S1B) was recorded, and the 3D coordinate data of the markers was obtained by the image post-processing program.

Figure S1 A: Acquisition interface C1, C2, C3 of the quad camera in image mode C4 is a two-dimensional image taken by four cameras. B: The data acquisition interface of the quad camera in the object mode (the white points were the markers, black was background)
Supporting Document
S1. Calculation of some indicators
The lost-marker’s rateDue to occlusion, interference, etc., the markers may not be captured by at least two cameras. The probability of a system losing a marker and finding the correct lost marker directly affected the accuracy of motion capture, so the lost marker rate and the automatic recovery accuracy were defined. a) The lost-marker’s rate in time-TLMR:mwas the total number of frames in a sample experiment, andnwas the total number of frames lost by the markers; b) Spatial lost-marker’s rate-SLMR: the number of all captured markers wasv, and the number of markers which can be captured at the same time wasw; c) The average rate of automatic recovery -ARAR: the total number of frames in which the loss occurred in one experiment wasp, and the number of times the system can retrieve the exact position of the lost marker after the marker lost wasq.

Average standard deviation rate(ASDR) The Standard Deviation (SD) is an important indicator for capturing system performance evaluation. The average standard deviation rate (ASDR) of multiple calibration results reflects the accuracy of the system under the same environment. At each time of the test, the two poWintsLmaintain the same points P1 and P2. During the motion capture process, the system will reconstruct the three-dimensional coordinates of the pointtiin space, and the space coordinates are (XP1ti,YP1ti,ZP1ti), (XP2ti,YP2ti,ZP2ti), calculate the Euclidean distanceDiof two points; see Eq. (S-4) and (S-5), wherenis the number of frames contained in a sample video, andmis the statistical number of times of sample trials.

Average deviation (AD), Average deviation’s variation rate (ADVR) and Root mean square error (RMSE) The average deviation (AD) describes the deviation value between the measured value and the true value, which is the average value of all the errors of the measured distance between the two reference points during a motion capture time. The Root Mean Square Error (RMSE) describes the deviation between the measured value and the true value, and it describes the accuracy of the motion capture system. For the rigid body object, there are markers M1 and M2 at both ends of the rigid body. The actual reference spacing between the two points isLref. The total number of frames of the sample video isu. Assumingattitime, the 3-D coordinates obtained by the automatic mode of M1 are (xw,yw,zw), the 3-D coordinates of M2 are (xe,ye,ze), and the spatial measurement distance of these two markers can be calculated asLti.
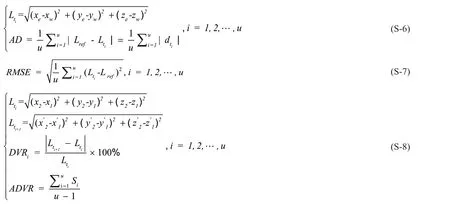
The change of the distance of the two markers measured by motion capture on each frame of image often changes with time, and the percentage of the difference between the measured distance of the current frame and the measured distance of the previous frame is defined as the mean deviation change rate (ADVR), which describes the stability of the system capture process; it is assumed that there are two markers M1 and M2 at both ends of a rigid body on the capture object, and the distance between the two markers isLref. At timet1, the 3-D coordinates of M1 are (x1,y1,z1), the 3-D coordinates of M2 are (x2,y2,z2); at timet2, the M1 are (x'1,y'1,z'1), the 3-D coordinates of M2 are (x'2,y'2,z'2), andurefers to the total number of frames of the selected sample video.

Trajectory deviation rate(TDR)based on image acquisition modeThe image post-processing methods ordinarily include automatic mode and manual mode, and the manual mode relies on human recognition to determine the position of the markers’ position. The automatic mode depends on a computer system that captures and predicts markers by a predictive filtering algorithm. Generally speaking, human recognition is a more accurate way to capture. By connecting the markers on the images of all the frames, the motion trajectory of the markers could be obtained. The position of the markers captured by the system was deviated from the actual position (Fig. S1), and the root mean square error of this deviation was defined as the trajectory deviation rate (TDR) indicating the difference between the measured trajectory and the real trajectory, which describes the accuracy of the system’s motion capture process for small animals. During one period, the two trajectories appeared at the maximum deviation value (dmax) at a certain moment. Assume that at the time oft1, the true 3-D coordinates of the markers on the right rear wrist of the gecko were (xm,ym,zm), and the coordinates (xa,ya,za) were obtained by automatic mode processing. The calculation of the trajectory matching is shown in the Eq. S-10, whereurefers to the number of frames included in the selected sample video.

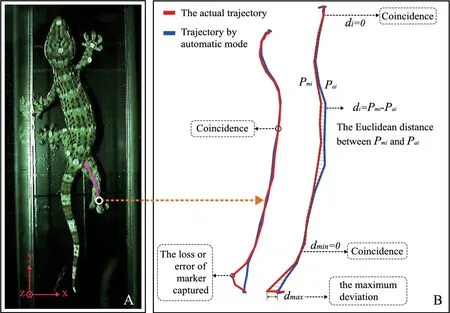
Figure SS1 Schematic diagram of two typical foot trajectories based on image acquisition mode. A: A gecko’s photo of the dorsal view with the right-rear ankle joint as the sampling marker; B: Schematic diagram of the deviation between the actual trajectory and the measurement trajectory obtained by the capture system based on image acquisition mode.
S2. Markers design for experimental objects
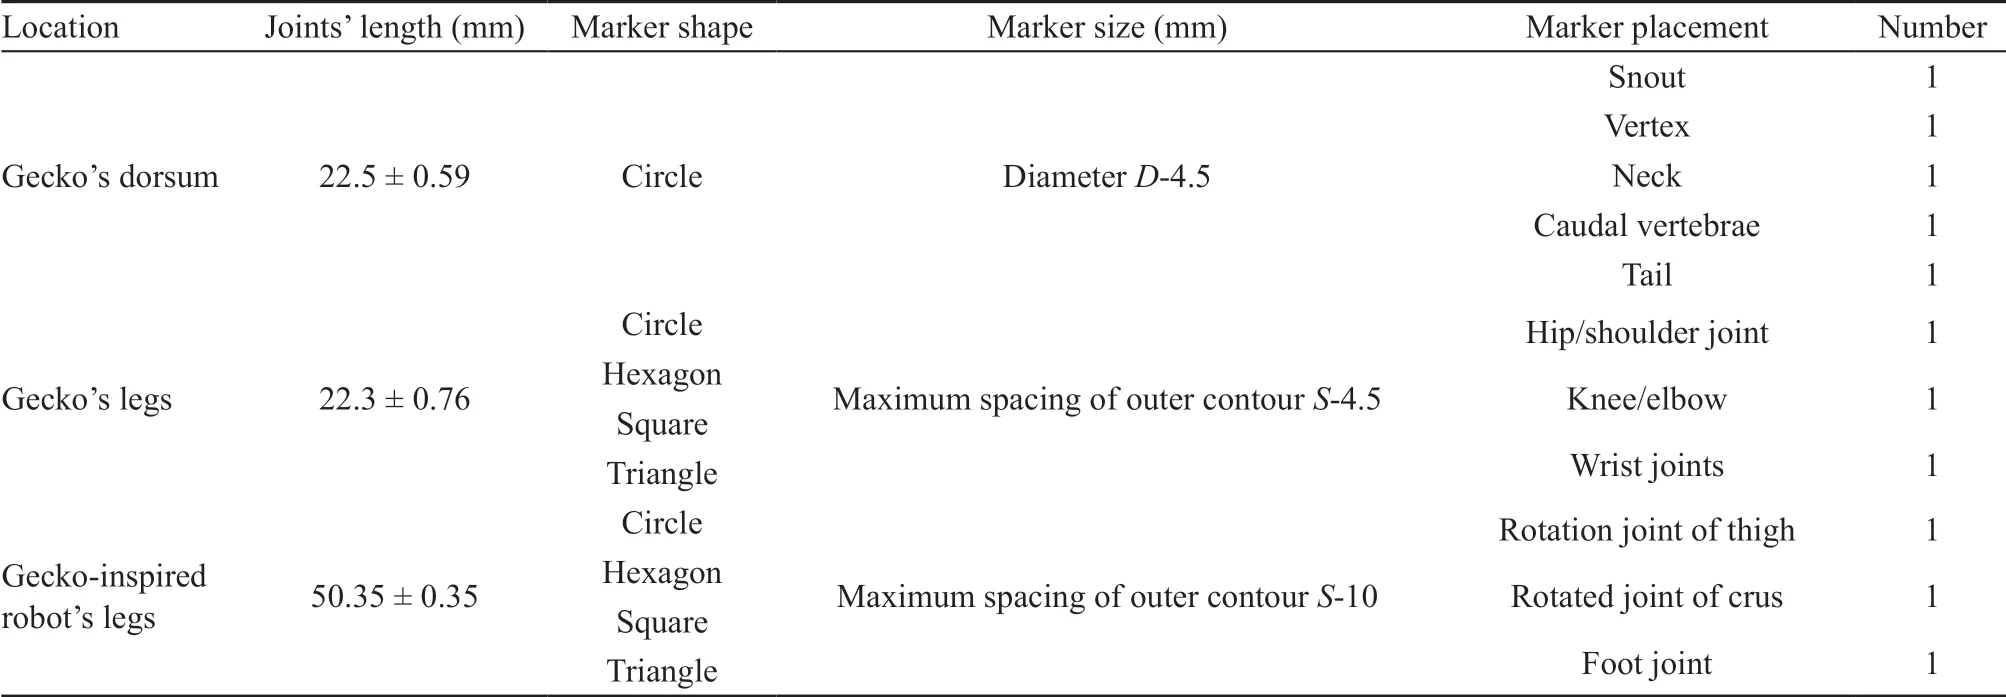
Table SS1 Markers designed for experimental objects.
S3. Result statistics

Table SS2 The RMSE of different diameter markers in the same spacing length.

Table SS3 The RMSE of different diameter markers in the same spacing length.

Table SS4 The SLMR of different shaped markers for spatial twisting and planar bending motions on a flexible object (%).

Table SS5 Statistical analysis of the motion capture experiment for geckos.
Appendix

Table S1 Currently recognized species of genus Scutiger and known distributional ranges.

(Continued Table S1)
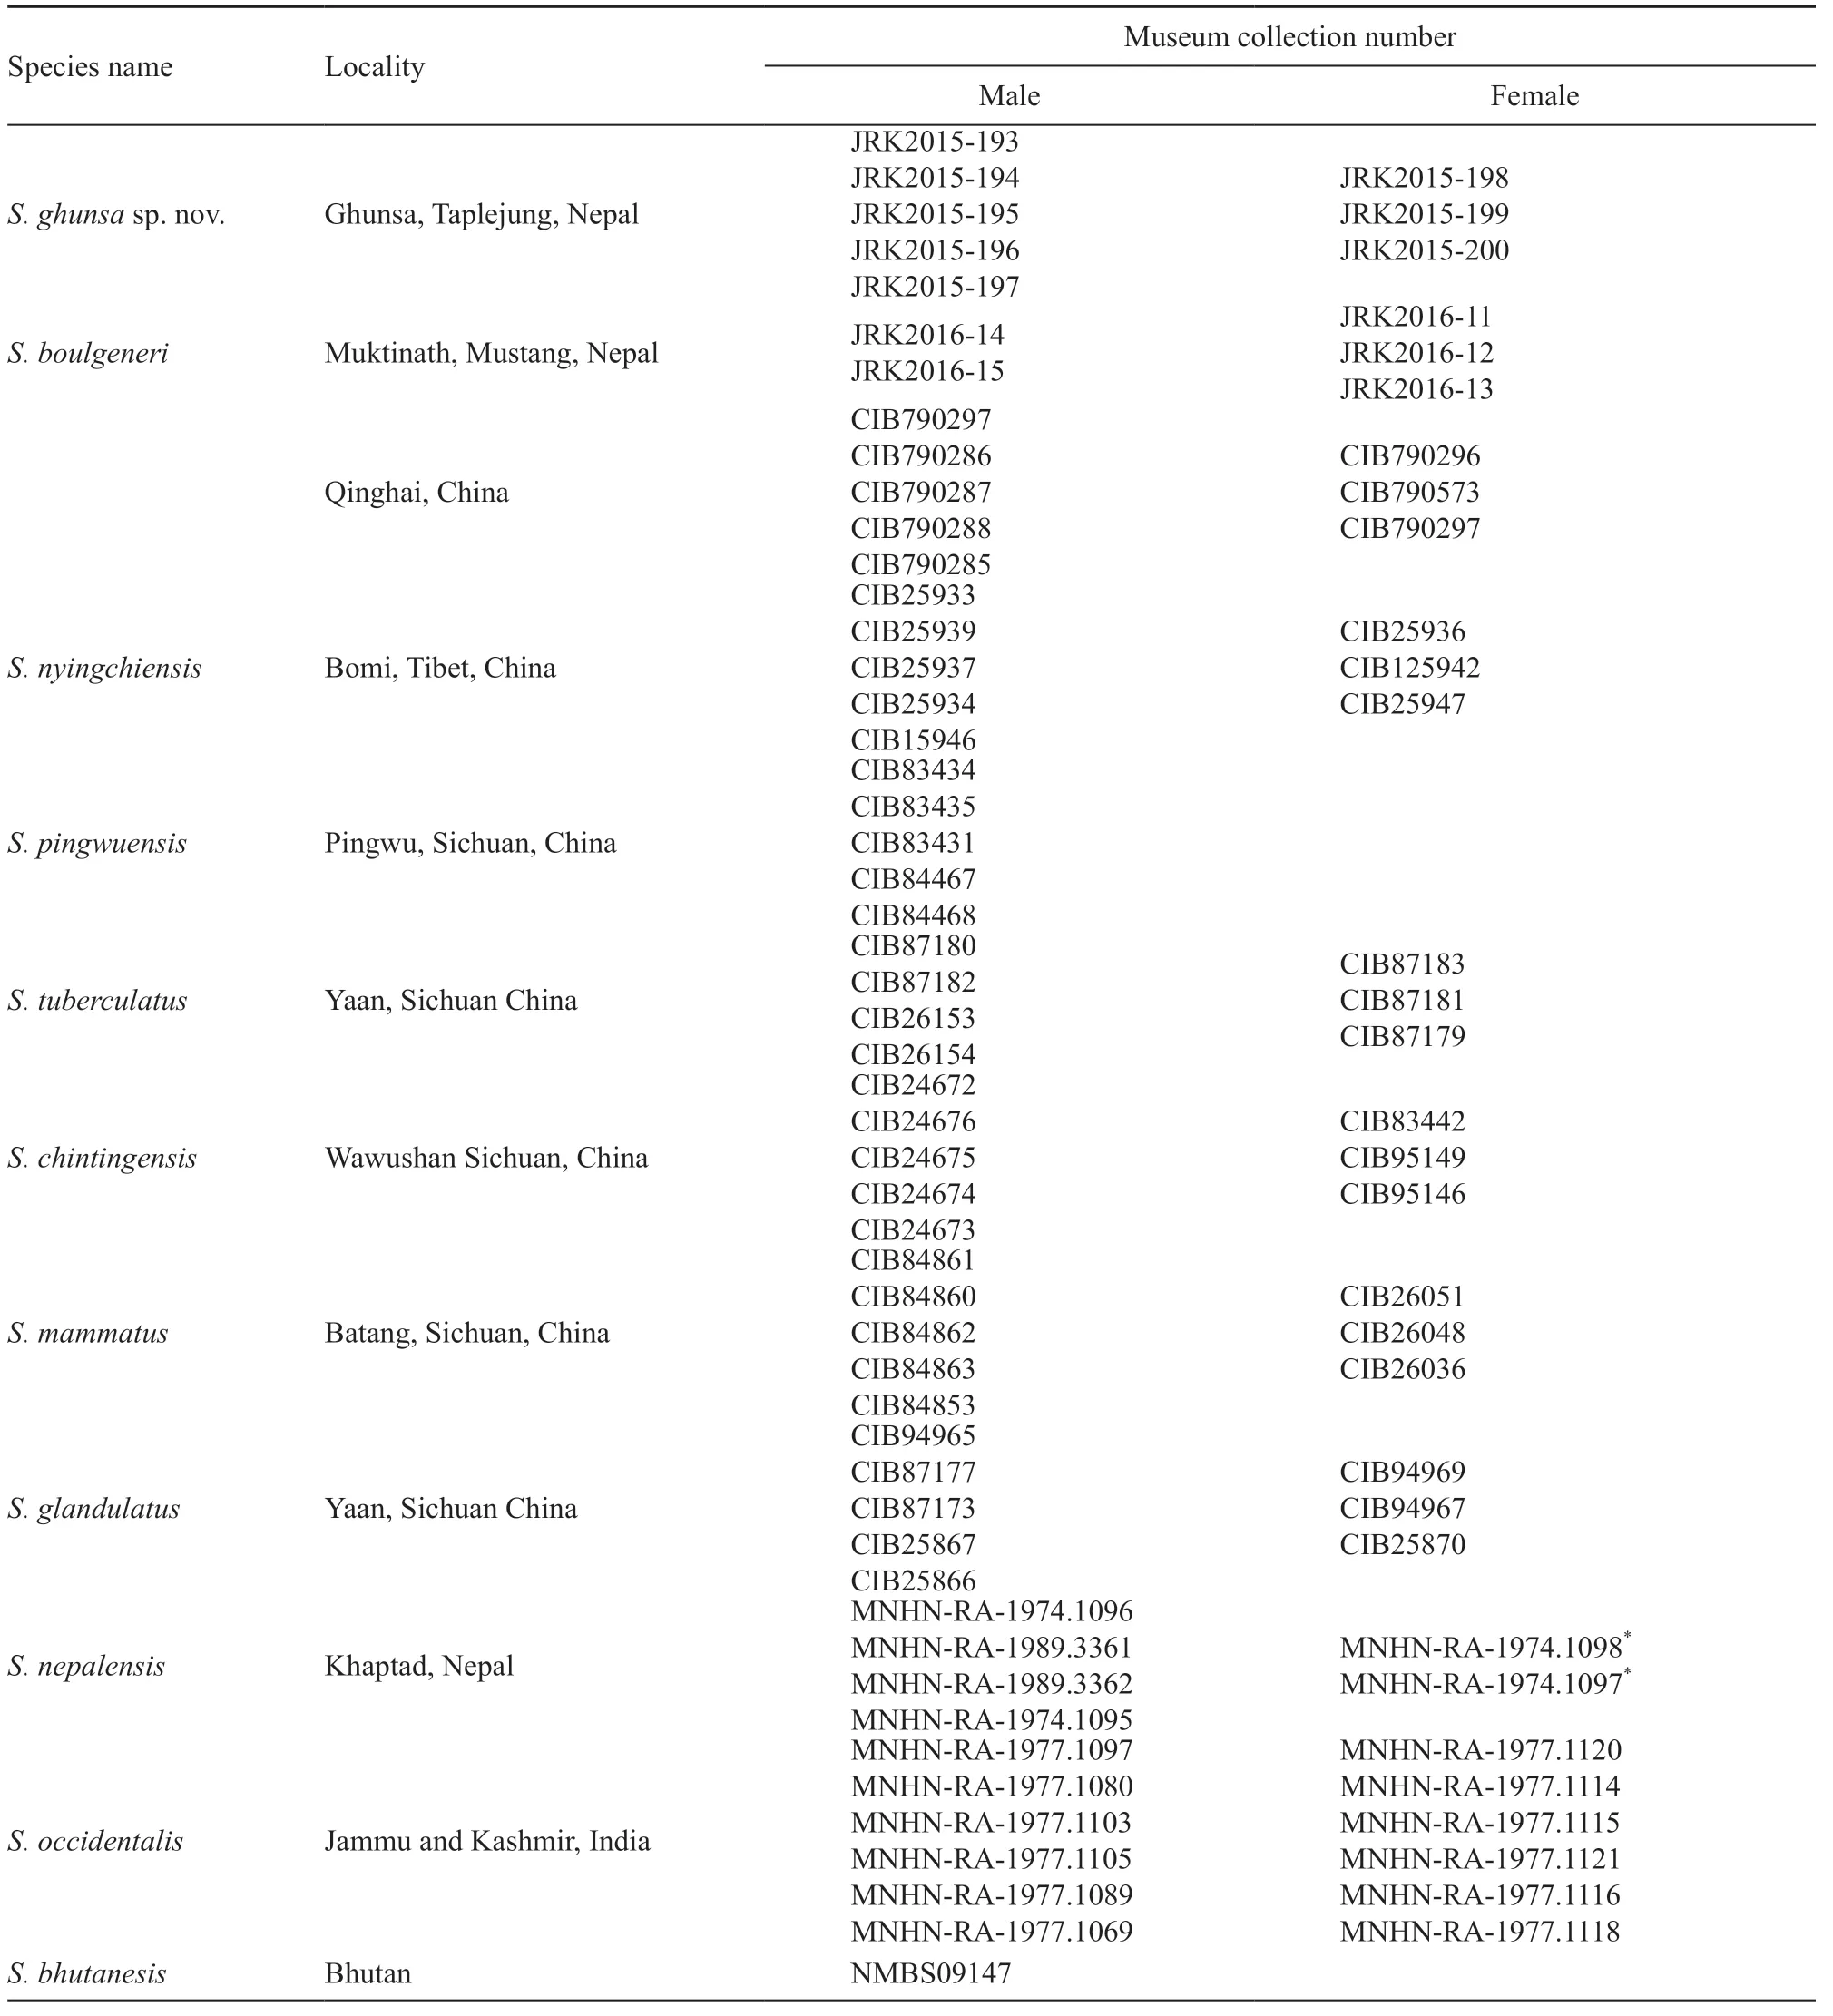
Table S2 Specimens used for morphological comparisons. JRK refers to collection number of Janak Raj Khatiwda, CIB refers to Chengdu Institute of Biology, MMHN to Muséum national d’histoire naturelle, Paris, France and NMBS to Natural History Museum of Basel, Switzerland.
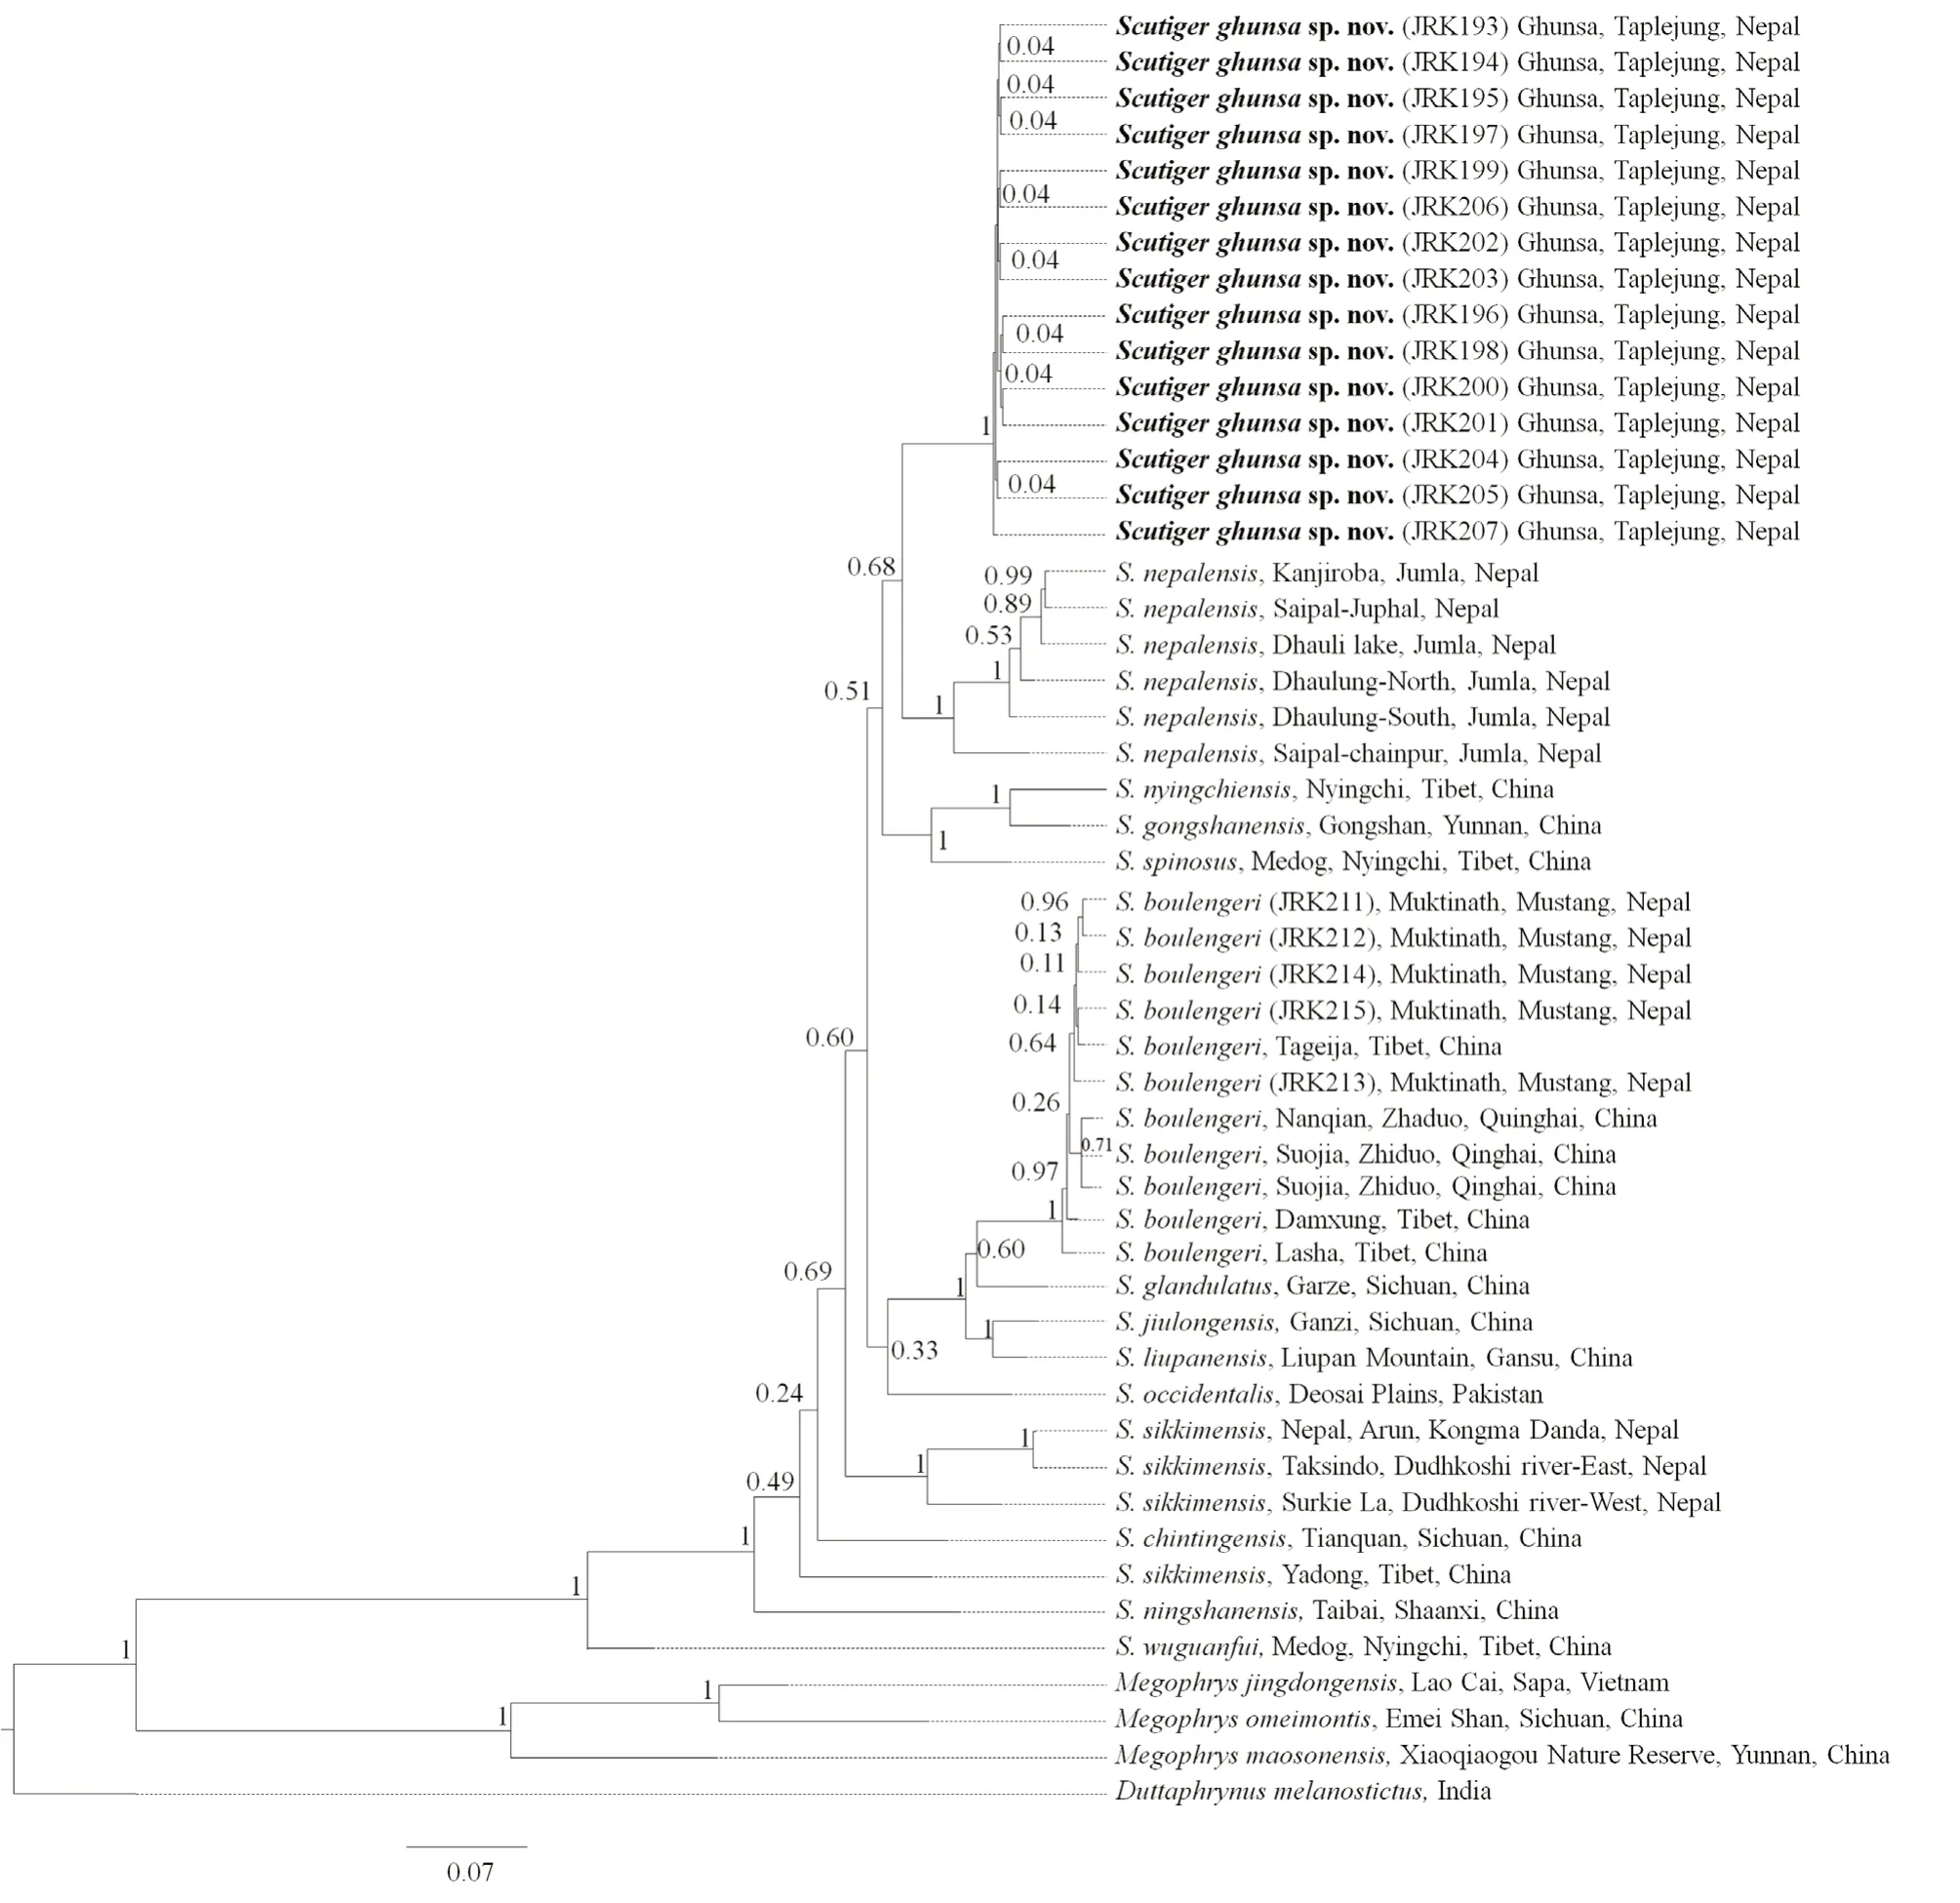
Figure S1 Bayesian inference (BI) tree based on COI sequences. Values on branches of the tree are Bayesian posterior probabilities (bpp) followed by ML bootstrap support (bs) below. Asterisk (*) denotes bpp > 90.

Figure S2 Maximum likelihood tree based on 16S gene sequences. Values on branches of the tree are ML bootstrap supports (bs).
Appendix

Table S1 Average active body temperatures (Ta), active body temperatures at open microhabitat (Ta open), active body temperatures at shaded microhabitat (Ta shade), and thermal preference (Tsel) of Phrynocephalus przewalskii, Eremias argus, and E. multiocellata. Lizards were collected at the Shierliancheng field station, Institute of Grassland Research of the Chinese Academy of Agricultural Sciences (111°09′ E, 40°21′ N, elevation 1 010-1 021 m). Data are expressed as mean ± SE and follow Li et al. (2017).

Table S2 Results of resting metabolic rate (RMR) of each species at different temperatures. RMR was calculated as the CO2 production per gram of body mass per hour (ml/g/hr)*. Data are shown as mean ± SE.
杂志排行
Asian Herpetological Research的其它文章
- A New Species of Megophryid Frog of the Genus Scutiger from Kangchenjunga Conservation Area, Eastern Nepal
- Mitochondrial Diversity and Phylogeographic Patterns of Gekko gecko (Squamata: Gekkonidae) in Thailand
- Molecular Cloning and Putative Functions of KIFC1 for Acrosome Formation and Nuclear Reshaping during Spermiogenesis in Schlegel’s Japanese Gecko Gekko japonicus
- Altitudinal Variation in Digestive Tract Lengh in Feirana quadranus
- Thermal-physiological Strategies Underlying the Sympatric Occurrence of Three Desert Lizard Species
