Mitochondrial Diversity and Phylogeographic Patterns of Gekko gecko (Squamata: Gekkonidae) in Thailand
2019-09-27AnchaleeAOWPHOLSiripornYODTHONGAttapolRUJIRAWANandKumthornTHIRAKHUPT
Anchalee AOWPHOL, Siriporn YODTHONG, Attapol RUJIRAWAN and Kumthorn THIRAKHUPT
1 Department of Zoology, Faculty of Science, Kasetsart University, Chatuchak, Bangkok 10900, Thailand
2 Department of Biology, Faculty of Science, Chulalongkorn University, Pathumwan, Bangkok 10330, Thailand
Abstract The Tokay Gecko, Gekko gecko (Linnaeus, 1758) is widely distributed in Asia and there have been concerns regarding locally decreasing populations due to overexploitation for traditional Chinese medicine. Previous studies of the genetic relationships of G. gecko populations included few populations from Thailand. Here we investigated the phylogeographic patterns of G. gecko from different regions in Thailand using mitochondrial cytochrome b sequences. Phylogenetic analyses revealed two lineages: one (Lineage A) comprising populations from Laos, Vietnam, and Thailand; and a second (Lineage B) comprising three genetically distinct groups within Thailand alone. Some Thai populations were found to have both lineages represented within them. Highly significant genetic differentiation (FST) showed geographic population structuring in Lineage B, indicating limited gene flow among groups in Thailand. Although G. gecko has a wide distribution and is well adapted to human habitation, the observed genetic structure could potentially be explained by geographic barriers such as mountain ranges. In Lineage A, our study provided primary phylogeographic evidence for lineage mixture that might be a result of human-mediated transport. Future research should include more extensive sampling across the geographic distribution of G. gecko and a landscape genetics approach could be applied for conservation planning.
Keywords genetic structure; haplotype, Gekkonidae, mitochondrial DNA, human-mediated transport
1. Introduction
Southeast Asia has a unique geological history that has contributed to high regional biodiversity (Sodhiet al., 2004; Woodruff, 2010). To understand the diversification of organisms and historical biogeography of this region, studies on adaptation and evolution of reptiles in response to the geographical and climatic changes are of great interest (e.g., Brownet al., 2012; Heinickeet al., 2012; Sileret al., 2013), particularly studies exploring cryptic diversity of reptiles at both species and population levels (e.g., Brownet al., 2012; Grismeret al., 2012). Cryptic species are two or more distinct species erroneously classified (and hidden) under a single species name (Bickfordet al., 2007). In some cases two or more members of a cryptic species complex can occur syntopically, making identification challenging and confounding the interpretation of results from studies based on specimens from these populations (McLeod, 2010; Stuartet al., 2006). Moreover, the genetic structure of populations can be affected by human activities such as habitat fragmentation and human-mediated transport (Santoset al., 2018; Templetonet al., 2001). In these instances, genetic divergence can be used to determine whether individuals and populations belong to the same or separate evolutionary lineages (Ferguson, 2002) and can indicate the level of connectivity among populations (e.g., Blairet al., 2013; Dubeyet al., 2011).
Among vertebrates, reptiles are good models for phylogeographic studies because of their global distribution (Pincheira-Donosoet al., 2013; Uetz, 2000), and a high degree of genetic divergence (Linet al., 2010). Very few phylogeographic studies of reptiles have been conducted in Thailand. Lukoscheket al.(2011) and Saijunthaet al. (2017) used mitochondrial DNA (mtDNA) to study the phylogeography of the Mekong Mud Snake (Enhydris subtaeniatus) and Blue Crested Lizard (Calotes mystaceus), respectively. The results of these studies have suggested that genetic structure of reptile populations in Thailand might be affected by geographic barriers such as mountain ranges and river drainage systems.
The Tokay GeckoGekko gecko(Linnaeus, 1758) belongs to the family Gekkonidae and has a wide distribution in Asia (Rösler, 2005; Smith, 1935; Uetzet al., 2018). It has been introduced to many regions of the world and is considered an invasive species in the United States and Brazil (Meshakaet al., 1997; Rocha, 2015). The Tokay Gecko has long been heavily exploited for Chinese traditional medicine, and this has led to localized population declines (Bauer, 2009) in parts of Bangladesh, Indonesia, and Thailand (Caillabet, 2013). The taxonomic status ofG. geckoremains controversial and it is reported to comprise two morphotypes (blackspotted and red-spotted geckos). These two morphotypes occur allopatrically and have high genetic divergence based on mitochondrial and nuclear DNA (Qinet al., 2007, 2012; Wanget al., 2012, 2013), and different chromosome characteristics (Qinet al., 2012). Rösleret al. (2011) revalidated the taxonomic status of the black-spotted gecko asGekko reevesii(Gray, 1831) based on morphological, molecular, and zoogeographic evidence. In addition, the two morphotypes have different advertisement calls (Yuet al., 2010) and ecological data showed niche differentiation (Zhanget al., 2014), corroborating Rösleret al. (2011)’s revalidation ofG. reevesiiin China and northern Vietnam. There are currently two recognized subspecies based on morphology, namelyG. gecko gecko(Linnaeus, 1758), andG. gecko azhariMertens, 1955.Gekko g. geckois widely distributed, ranging from northeast India, southern China, and Southeast Asia, whereasG. g. azhariis found only in Bangladesh (Rösleret al., 2011; Smith, 1935; Rösler, 2001, 2005). This study considers only samples from outside of Bangladesh and therefore we refer the study taxon (G. g. gecko) herein asG. gecko.
AlthoughG. geckohas a wide distribution range in Asia, phylogeographic analyses of this species from some geographical areas, including Thailand, have been limited (Kongbuntadet al., 2016; Qinet al., 2007, 2012; Wanget al., 2012, 2013; Zhanget al., 2006). This study examines the genetic structure ofG. geckopopulations in Thailand. We used mitochondrial cytochromeb(cytb) DNA sequence data to assess the mitochondrial DNA diversity and phylogeographic patterns ofG. geckopopulations in Thailand, and compare Thai samples to specimens from Laos, Vietnam, and southern China.
2. Materials and Methods
2.1. Sample collectionField work was conducted from 2010-2018. A total of 114 samples were collected from 17 populations in the residential areas throughout Thailand whereG. geckooccurs as a human commensal (Table 1; Figure 1). Tail tips ofG. geckowere clipped, and geckos were returned to where they were captured. Liver tissues were collected from individuals that were kept as voucher specimens. All tail tip and liver tissues were preserved in 95% ethanol and stored at -20 °C for genetic analyses. Voucher specimens were fixed in 10% formalin and subsequently transferred to 70% ethanol. All tissues and voucher specimens were deposited in the herpetological collection, Zoological Museum, Kasetsart University (ZMKU).
2.2. DNA extraction, PCR amplification, and sequencingTotal genomic DNA was extracted from tail tip or liver tissues preserved in 95 % ethanol using a DNeasy Blood and Tissue Kit (Qiagen, Hilden, Germany) according to manufacturer’s protocol. Part of the mitochondrial cytbgene was amplified by polymerase chain reaction (PCR) using the combination of forward and reverse primers from Wanget al. (2012) (Table 2). Amplification conditions included initial DNA denaturation at 94°C for 5 min; followed by 35 cycles of 94°C for 1 min, 50°C annealing temperature for 50 s, and 72°C for 1 min; with a final extension at 72°C for 10 min. PCR products were purified using a QIAquick purification kit (Qiagen, Hilden, Germany) and sequenced in both forward and reverse directions using the PCR primers. The sequencing reactions were analyzed on a 3730 DNA Analyzer (Applied Biosystems, CA, USA) by Macrogen Inc. (Seoul, Korea). Sequences were checked by eye, and aligned using MUSCLE implemented in Geneious R11 (Biomatters, Ltd., Auckland, New Zealand). All DNA sequences obtained in this study were deposited in GenBank (Accession numbers MK598399-MK598441).
2.3 Data analyses
Phylogenetic reconstruction
Additional cytbsequences ofG. geckofrom Phonsavan, Laos (GenBank: EF174461, EF640157), Langson, Vietnam (GenBank: EF640155, EF640156), and Guangxi, China (GenBank: EF174462) were downloaded from GenBank and included in the phylogenetic analyses.Gekko reveesiifrom Guangxi and Yunnan, China (GenBank: EF640150-EF640154, EF640179) andGekko vittatusHouttuyn, 1782 (GenBank: NC008772) were chosen as outgroups. Phylogenetic relationships among haplotypes were estimated using both maximum likelihood (ML) and Bayesian inference (BI). A ML tree was constructed in the IQ-TREE web server (Trifinopouloset al., 2016) using the Bayesian information criterion (BIC). The HKY+F+G4 model was selected as the best-fit model of evolution for all codon positions. A BI analysis was performed using the CIPRES Science Gateway portal V. 3.3 (Milleret al., 2015) with default priors. The bestfit substitution model (GTR+I+G) was selected using the Akaike Information Criterion (AIC) as implemented in jModelTest 2.1.10 (Daribbaet al., 2012). Phylogenetic reconstruction was performed running Metropoliscoupled Markov chain Monte Carlo sampling with four chains for 10 million generations and trees were sampled every 1 000 generations. The first 25% of trees were discarded as burn-in and the 50% majority-rule consensus of the remaining trees was constructed to calculate the posterior probabilities of nodes. Stationarity was checked in Tracer v1.7.1 (Rambautet al., 2018) to ensure that effective sample sizes were above 200 for all parameters.

Table 1 Locality, samples sizes (n), Number of haplotype, MtDNA lineage, and haplotype distribution of Gekko gecko used in the present study.
Genetic diversity and population genetic analyses
Haplotypes were extracted using DnaSP v6.12.06 (Rozaset al., 2017). Population genetic diversity among and within sampled populations i.e., haplotype diversity (h; Nei, 1987), nucleotide diversity (π; Nei and Tajima, 1981), the numbers of haplotypes (Nh), and the numbers of unique haplotypes (Nu) were calculated using DnaSP v6.12.06. Uncorrected pairwise sequence divergences (p-distances) between paired phyloclades were calculated in MEGA v7 (Kumaret al., 2018). We constructed a median joining network using Network v4.6.0 (Fluxus Technology Ltd., England) to determine the haplotype relationships and calculated the genetic differentiation among gecko populations as pairwise fixation indices (FST) in Arlequin v3.11 (Excoffieret al., 2005). Genetic structure among and within geographic regions was assessed using the Analysis of Molecular Variance (AMOVA) approach implemented in Arlequin.
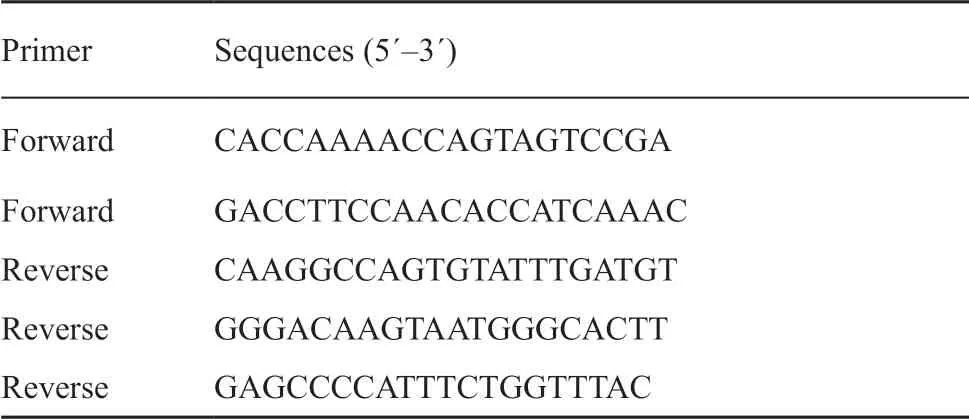
Table 2 Primers for PCR amplification and sequencing from Wang et al. (2012).
Population demographic history
The possibility of demographic expansion ofG. geckopopulations in Thailand was tested based on the mismatch distribution of pairwise differences (Rogers and Harpending, 1992) in Arlequin. The Harpending’s raggedness index (r) and sum of squared deviations (SSD) were calculated to compare observed and expected distributions under the expansion model. We calculated a neutrality test using Fu’s Fs(Fu, 1997) and Tajima’sD(Tajima, 1989) in Arlequin with 1 000 permutations. Significant negative values of Fu’s Fsand Tajima’sDwould indicate demographic expansion.

Figure 1 Map showing sampling localities in Thailand. The details of each locality are shown in Table 1. Blue dots indicate samples of Gekko gecko in Thailand. Red dots represent samples of G. gecko in Laos, Vietnam, and China. Black dots represent samples of G. reevesii in China.

Figure 2 Phylogenetic tree, representing relationship among haplotypes and closely related species. Values above or below branch correspond to maximum likelihood bootstrap support and Bayesian posterior probability.
3. Results
3.1. Genetic diversityAn alignment of 1 125 base pairs (bp) of cytbsequences was obtained. There were 201 polymorphic sites, including 186 parsimony informative sites and 15 singleton variable sites. We identified 43 haplotypes within 114 individuals from 17 localities in Thailand. The haplotype diversity (h) and nucleotide diversity (π) of each locality are presented in Table 3. The overall haplotype diversity was high (0.960 ± 0.007), but nucleotide diversity was low (0.04076 ± 0.00253).
3.2 Phylogenetic analyses and haplotype relationshipsPhylogenetic analyses (BI and ML) of haplotypes showed similar tree topologies.Gekko geckopopulations,formed a monophyletic group sister toG. reevesii. The BI tree (Figure 2) shows thatG. geckois separated into two major clades, A and B. Two subclades were recovered within clade A. Subclade A1 contained two individuals from PL and RB1, whereas subclade A2 consisted of individuals from NR, CT, PL, and SK, together with populations from Laos (Phonsavan), Vietnam (Langson), and China (Guangxi). Clade B comprised three subclades: B1 (ST population from southern Thailand), B2 (populations from northeastern and central (SR) Thailand, and two individuals from RB2), and B3 (populations from western and southern Thailand, and one individual from CB). However, the relationship among these three subclades was only moderately supported (BI posterior probability = 0.70, ML bootstrap = 72).
The median-joining network showed intraspecific genetic structure, comprising two major lineages (Clades A and B) within populations ofG. geckoin Thailand (Figure 3) that were consistent with the phylogenetic tree topology. Most haplotypes were unique to one individual (60.47%). Five haplotypes (H5, H10, H11, H34, and H36) were shared among populations. Clade A was highly divergent from clade B and contained individuals from different regions in Thailand. Most individuals in clade A carried a unique haplotype, but H5 was shared by individuals from CT, NR, and PL. In subclade B2, H10 was the most abundant haplotype and occurred in geckos from three localities (NR, SB, and RB2), while H31 was the most abundant haplotype in subclade B3 and was unique to individuals from the PK population.
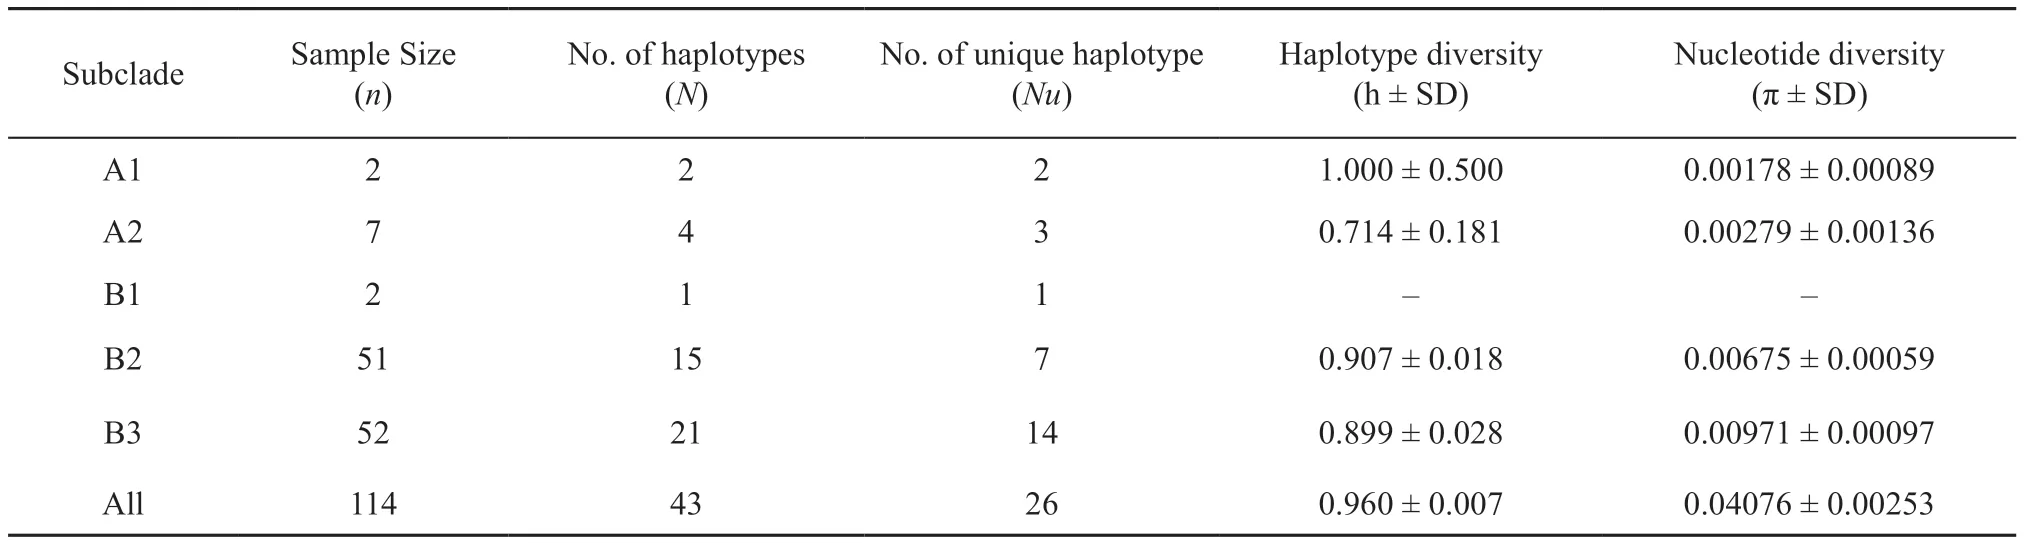
Table 3 Genetic diversity of each phylogenetic clade.
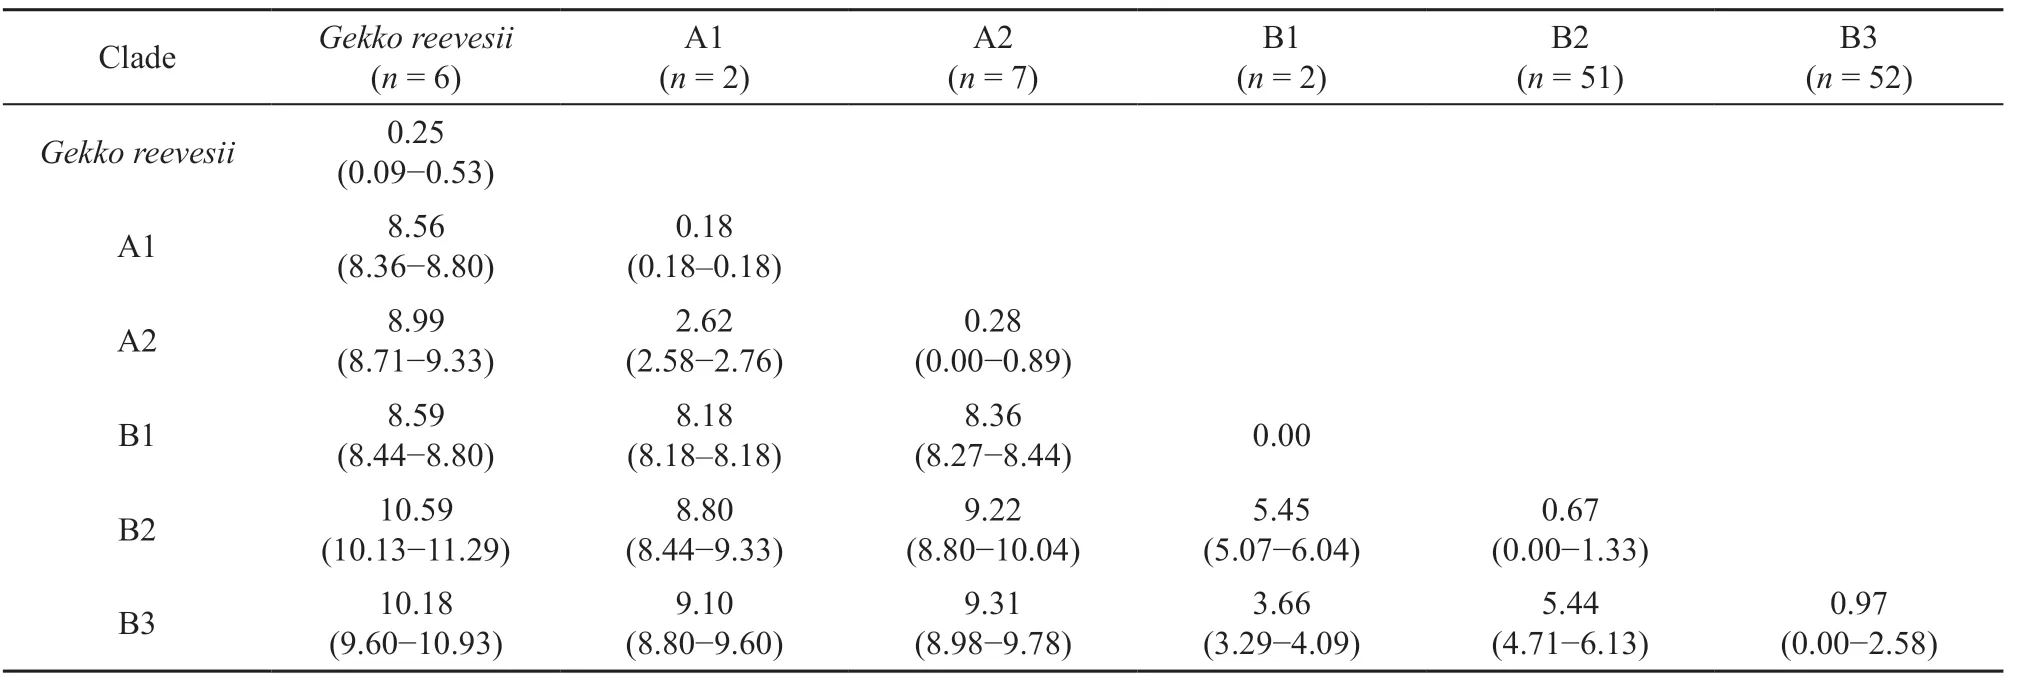
Table 4 Uncorrected pairwise genetic divergence (%) between phylogenetic clades for mitochondrial cytochrome b dataset.

Figure 3 Median-joining network of mitochondrial cytochrome b haplotypes of Gekko gecko. The size of the circles is proportional to haplotype frequency. Each color represents locality.
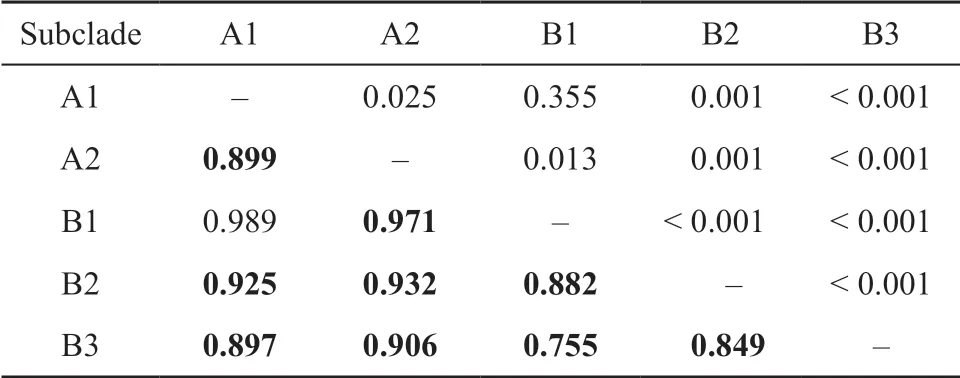
Table 5 Pairwise FST (lower diagonal) and P (above diagonal) values of Gekko gecko mitochondrial cytochrome b dataset. Bold values represent significant FST.
3.3 Population genetic structure and demographyPairwise genetic distances (%p-distance) between clades are presented in Table 4. The results showed high mean genetic divergences betweenG. reevesiiandG. gecko(8.56-10.59%). The meanp-distances between the major clades (Clades A and B) ofG. geckopopulations in Thailand were high (8.18-9.31%). The meanpdistances between populations within clade A were low (0.18-2.62%), whereas the meanp-distances between populations within clade B were higher than those within clade A (0.00-5.45%) and geographic structuring was detected, with the presence of three subclades (B1-B3).

Table 6 Results of analysis of molecular variance (AMOVA) across and within major geographic regions of G. gecko based on mitochondrial cytochrome b.
Overall mean pairwiseFSTvaried from 0.755 to 0.925 and analyses revealed significant genetic differentiation between most subclades ofG. gecko(Table 5). The highFSTvalues indicated long-term restriction of gene flow between populations. AMOVA that revealed genetic differentiation among populations within group explained 45.72% of the total genetic variation, and 8.04% of the genetic differentiation occurred within populations (Table 6).
The mismatch distribution was relatively ragged and multimodal in each subclade (Figure 4; Table 7). These tendencies were also found in Fu’s test of neutrality, showing non-significant values, whereas Tajima’sDwas significantly negative (P= 0.011) only in subclade A2, rejecting the hypothesis of constant population size. However, this group contained individuals from different regions in Thailand (CT, PL, NR, and SK).
4. Discussion
Whereas previous phylogenetic and phylogeographic studies ofG. geckohave been conducted, they have included limited sampling from Thailand. This study carefully examined cytbgene sequence diversity within and among 17 populations ofG. geckofrom residential areas in Thailand. Results of our analyses of partial cytbgene sequences (1 125 bp) revealed two major mitochondrial clades (A and B) with high mean genetic divergence (8.18-9.31%). The mean genetic divergence within clade A ranged from 0.18 to 2.62% whereas that within clade B was higher, ranging from 0.00 to 5.45%, demonstrating that the genetic divergence among Thai populations in this study was much higher than those previously reported between populations ofG. geckofrom China (Guangxi), Laos, and Vietnam (0.5-2.2% (424 bp) in Qinet al., 2007; 0.12-1.66% (1 141 bp) in Qinet al., 2012). High levels of mitochondrial genetic divergence were reported in other vertebrates in Thailand such asHoplobatrachus rugulosus(cytb; Pansooket al.2012),Chiromantis hasenae(16S rRNA; Yodthonget al., 2014), andCalotes mystaceus(COI; Saijunthaet al., 2017), suggesting that strong genetic structuring of these species could resulted from geographic topography in Thailand and/or historical biogeographic process.

Table 7 Results of statistical test of neutrality and mismatch distribution of sampled populations of G. gecko based on mitochondrial cytochrome b. Bold values represent significant value.

Figure 4 Observed frequencies of pairwise nucleotide differences among mitochondrial sequences (dashed lines) and expected frequencies under a model of sudden population expansion (solid lines). Mismatch distributions depict frequencies of pairwise differences for: (A) All subclades of Gekko gecko, (B) subclade A2, (C) subclade B2 and (D) subclade B3.
The results of the median joining network analysis (Figure 4) were concordant with those of the phylogenetic analysis ofG. geckopopulations in Thailand, showing two major clades (A and B) and genetic sub-structuring within each clade. Clade B was divided into three subclades, B1 (ST population), B2 (Northeast, Central, and two individuals from RB2), and B3 (West, South, and one individual from CB). Strong genetic differentiation (FST) indicated limited gene flow among the subclades of geckos (Table 5) that could have resulted from the presence of geographic barriers, such as mountain ranges, preventing dispersal and gene flow between subclades B2 and B3. The geographic topography of western Thailand contains steep hills and mountain ranges, i.e., Tenasserim and Thanon Thong Chai that run north-south orientation whereas the topography of northeastern Thailand contains plateau with lower elevations and mountain ranges, i.e., Phetchabun and Dong Paya Yen mountain ranges (Inger, 1999 ; Gupta, 2005). Therefore, these mountain ranges could play an important role as barriers of gene flow amongG. geckopopulations. A similar phylogeographic pattern was found in the rhacophorid,Chiromantis hansenae, with populations in northeastern Thailand separated from populations in western Thailand (Yodthonget al., 2014). These limited levels of gene flow could resulted from geographic barriers in western and northeastern Thailand and/or the limited dispersal ability ofC. hansenae. In addition, the genetic structure in gecko populations could be affected by natural dispersal which is relatively limited in other geckos such asHesperoedura reticulataandHemidactylus mabouia(Hoehnet al., 2007; Short and Petren, 2011). Hoehnet al. (2007) suggested that a distance as small as 500 m is a barrier to the natural dispersal ofH. reticulata. Short and Petren (2011) showed that genetic structure was found among populations ofH. mabouiaat a small regional scale and suggested that gene flow might be limited by both dispersal ability and geographic distance. Long-distance dispersal of some geckos e.g.,H. mabouia, andHemidactylus brookiihas been reported in previous studies and could be explained by human-mediated transport (Short and Petren, 2011; Weterings and Vetter, 2018). Similarly, evidence of longdistance dispersal by human-mediated transport was revealed among populations ofG. geckoin this study. For instance, H10 and H11 were shared by NR populations (northeastern Thailand), and RB2 population (western Thailand) whereas H5 was shared by CT (eastern Thailand), NR (northeastern Thailand), and PL (central Thailand) populations. Although the dispersal ability ofG. geckomight affect the genetic structure of populations in Thailand, the dispersal pattern of this widely distributed species has not been studied. There is only a report on the foraging distance ofG. geckowhich ranges from 0.1-38.5 m from its retreat (Aowpholet al., 2006). Therefore, the dispersal patterns ofG. geckoshould be further investigated at the regional and landscape scales.
Kongbuntadet al. (2016) analyzed the population genetic structure ofG. geckofrom northern and northeastern Thailand, Laos, and Cambodia based on multilocus enzyme electrophoresis. They found thatG. geckopopulations in northeastern Thailand were more closely related to populations from Laos and Cambodia and suggest that the populations from the Khorat Plateau of northeastern Thailand might be separated from northern populations by the Dong Paya Yen mountain range. In other lizard such asCalotes mystaceus, the phylogeographic patterns from most regions in Thailand, excluding the southern region, exhibited two lineages: (I) northern, western and central regions, (II) northeastern and eastern regions; and this divergence may be due to the Phetchabun, Dong Paya Yen, and Sankambeng mountain ranges acting as barriers to gene flow (Saijunthaet al., 2017). These phylogeographic patterns are congruent with results from studies of other terrestrial organisms such as the centipedeScolopendra dehaaniin mainland Southeast Asia (Siriwutet al., 2015). With these results and the findings of this study, sufficient evidence has been collected to suggest that intraspecific structure of terrestrial organisms in Thailand are primarily the results of historical biogeographic events in the region, namely the uplift of the Khorat Plateau (Racey, 2009).
Although the sampled populations ofG. geckoin Thailand have a shared evolutionary history, a significant amount of time would be required for different populations to establish unique haplotypes, suggesting independent evolutionary histories. The unique haplotypes indicate limited gene flow among populations within clades A and B, despite this species being well-adapted to the human-mediated environment and the lack of obvious geographic barriers between some populations. Interestingly, the genetic divergence within clade A was low (0.18-2.62%). The subclade A1 contained individuals from PL and RB2 whereas subclade A2 comprised populations from Laos, Vietnam, China, and eight individuals from NR, CT, PL, and SK. This finding indicates thatG. geckomay have been introduced to different areas by anthropogenic activities such as commercial trade and human-mediated transport. In conservation assessments completed by the International Union for the Conservation of Nature (IUCN),G. geckois listed as “least concern” because of its wide distribution, presumed large population and occurrence in natural and artificial environments; however, its population size and trends have not been evaluated (Lwinet al., 2019). International trafficking in geckos, especiallyG. geckofor both the pet trade and medicinal uses, occurs on a grand scale (Bauer, 2009). Lwinet al. (2019) suggested that international trade monitoring is necessary, including CITES monitoring to collect data on trade volumes. In conclusion, the results obtained through this study demonstrated substantial genetic differentiation among theG. geckopopulations in Thailand, indicating limited gene flow that could be caused by the complexity of Thailand’s topography and the dispersal ability ofG. gecko. We recommend the extension of fine-scale sampling across the species’ distribution ranges, combining morphological, and molecular investigations in future studies to facilitate understanding of the evolutionary history, and the demographic and taxonomic status ofG. gecko(i.e.,G. g. geckoandG. g. azhari). Additionally, this study provided evidence that human-mediated transport has affected the population genetic structure ofG. geckopopulations in mainland Southeast Asia (Thailand, Laos and Vietnam) and southern China. Therefore, conservation strategies should involve controlling the introduction pathways of non-nativeG. geckopopulations such as commercial and pet trade routes to prevent further impacts on native populations and other species.
AcknowledgementsThis work was supported by the Thailand Research Fund (MRG5380088) and Kasetsart University Research and Development Institute (KURDI). Institutional Animal Care and Use Committee, Kasetsart University for approving the research protocols (ACKU61-SCI-008). We thank Virayuth LAUHACHINDA, Wut TAKSINTUM, Suprawat MAITREEPAEN, Natee AMPAI, and Korkhwan TERMPRAYOON for assisting in the field and Taksin ARTCHAWAKOM for permission to conduct this research at Sakaerat Environmental Research Station. We would like to thank anonymous reviewers for improving the manuscript.
杂志排行
Asian Herpetological Research的其它文章
- The Marking Technology in Motion Capture for the Complex Locomotor Behavior of Flexible Small Animals (Gekko gecko)
- Thermal-physiological Strategies Underlying the Sympatric Occurrence of Three Desert Lizard Species
- Altitudinal Variation in Digestive Tract Lengh in Feirana quadranus
- Molecular Cloning and Putative Functions of KIFC1 for Acrosome Formation and Nuclear Reshaping during Spermiogenesis in Schlegel’s Japanese Gecko Gekko japonicus
- A New Species of Megophryid Frog of the Genus Scutiger from Kangchenjunga Conservation Area, Eastern Nepal